ILA (Epidemiology Thread) (Hundley/ Weber)
1/63
Earn XP
Description and Tags
Hundley/ Weber
Name | Mastery | Learn | Test | Matching | Spaced | Call with Kai |
|---|
No study sessions yet.
64 Terms
The routine recording of births, marriages, divorces, and deaths can provide a snapshot of a population’s health status.
Simple vital statistics
Important indicators to follow are:
maternal deaths
infant mortality
low birth weights
births to teenage mothers.
(death of a child before his or her first birthday) measures the health of the most vulnerable children directly and reflects the health of the mother indirectly.
Infant mortality
Used as an indicator of the level of health in a community
Infant mortality
However, effective health systems can greatly limit the number of infant deaths, particularly by addressing life-threatening issues during the first __ days of life (neonatal period).
28
Infant mortality rate =
# of deaths to live born infants under 1 yo
number of live births
x 1,000
Neonatal mortality rate=
# of deaths to live born infants occurring with first 27 days of life
number of live births
x 1,000
The US ranks __th in infant mortality among 48 countries
38
Some countries, US among them, register all live births including very small babies with low odds of survival. In contrast, several countries apply a minimum threshold of a gestation period of __ weeks (or a birth weight threshold of 500 grams) for babies to be registered as live births.
22
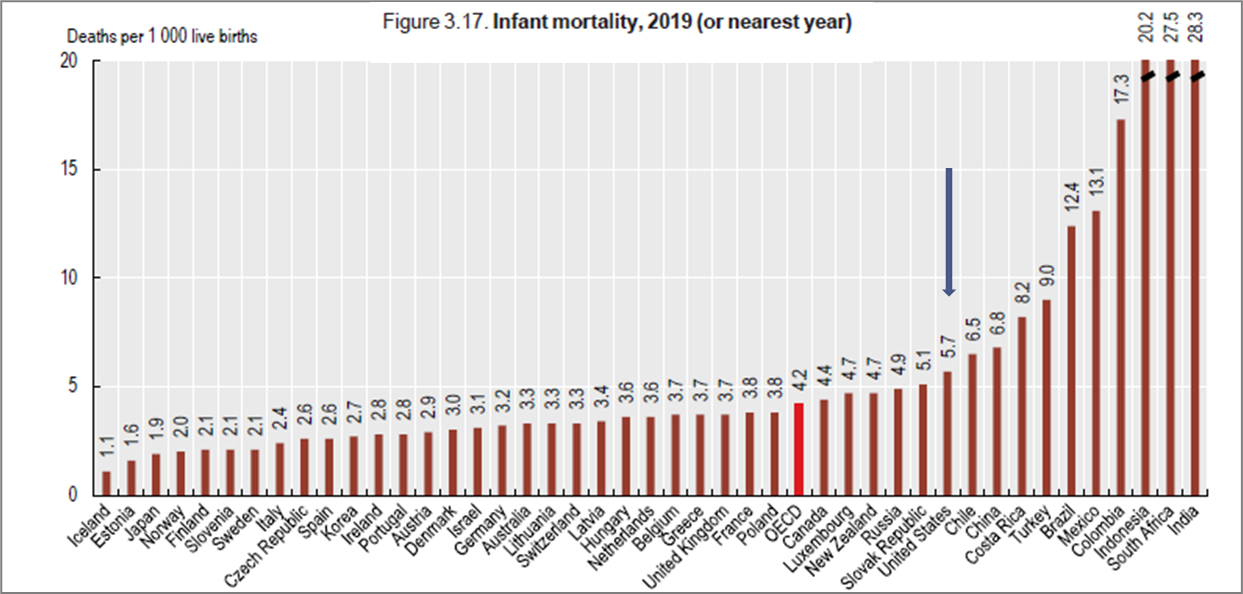
US infant mortality adjusted to 22 week minimum threshold (500 g birth weight)
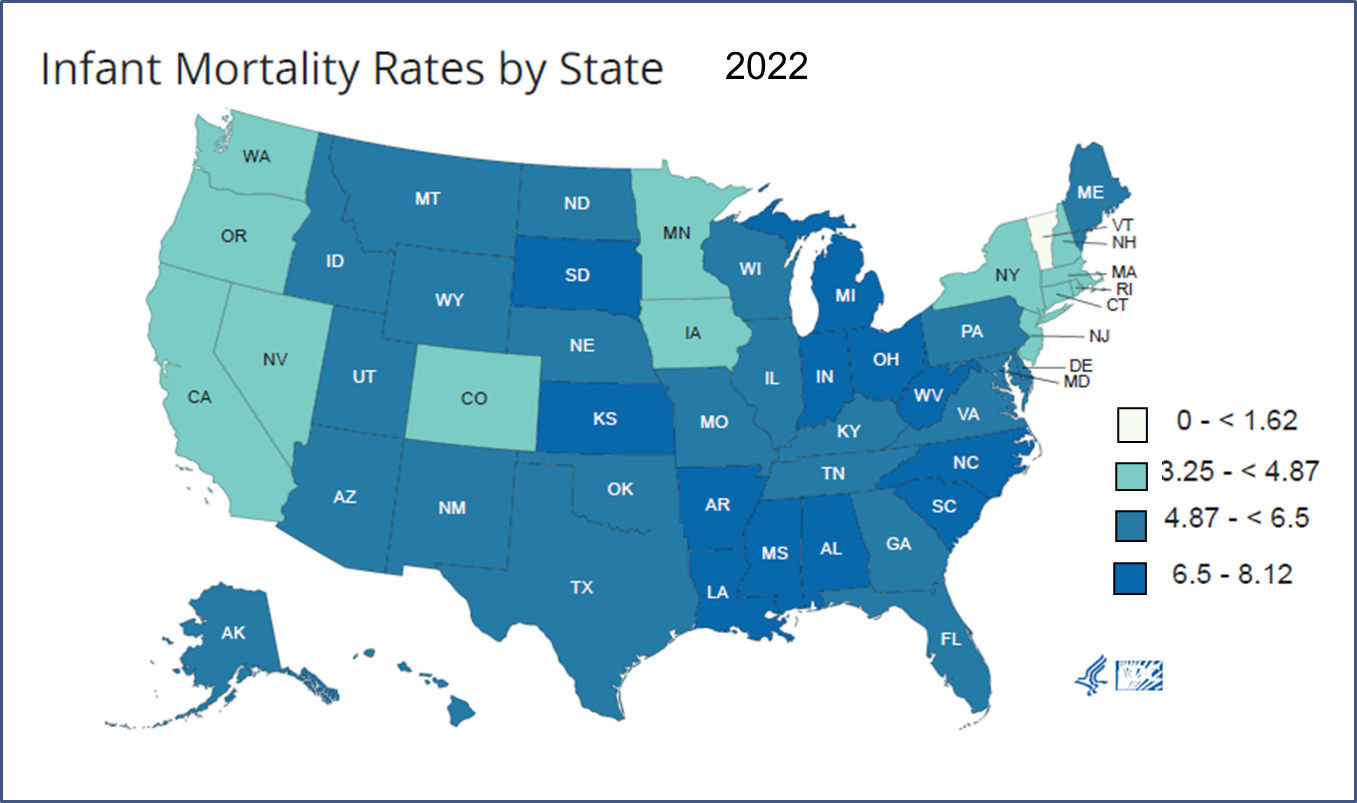
Infant mortality rate by state
In 2020, Alabama’s Infant Mortality Rate of ___ per 1000 live births was higher than the US average of 5.42 per 1000 live births.
6.99
By 2020, the US Infant Mortality rate was ___ per 1000 live births.
5.5
The new goal for healthy people 2030 is to reduce the US Infant Mortality rate to __ per 1000 live births
5
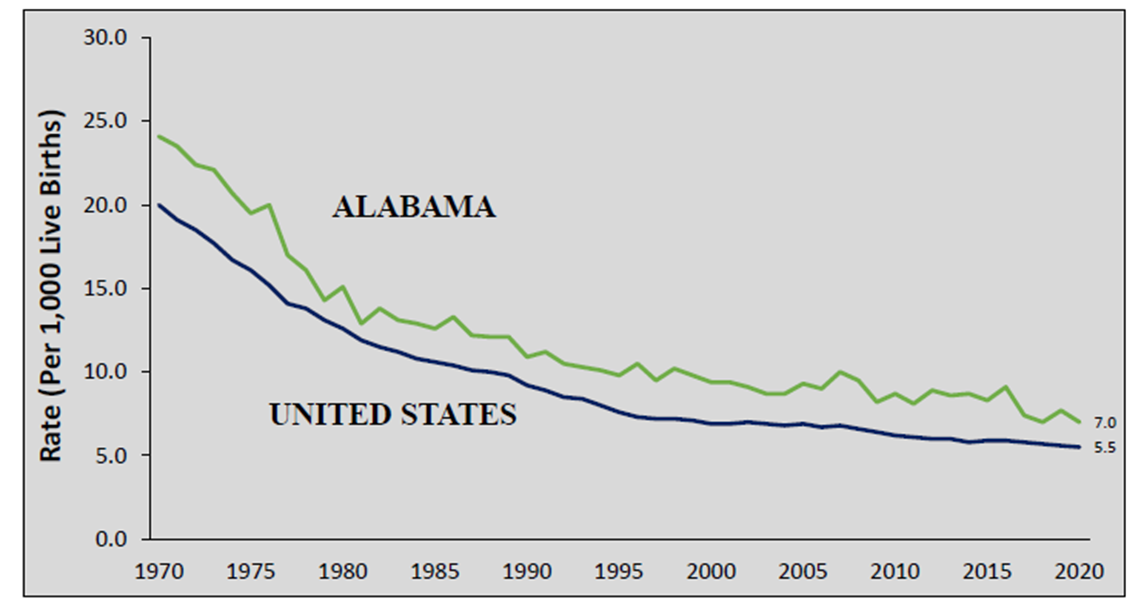
Infant mortality rates through years
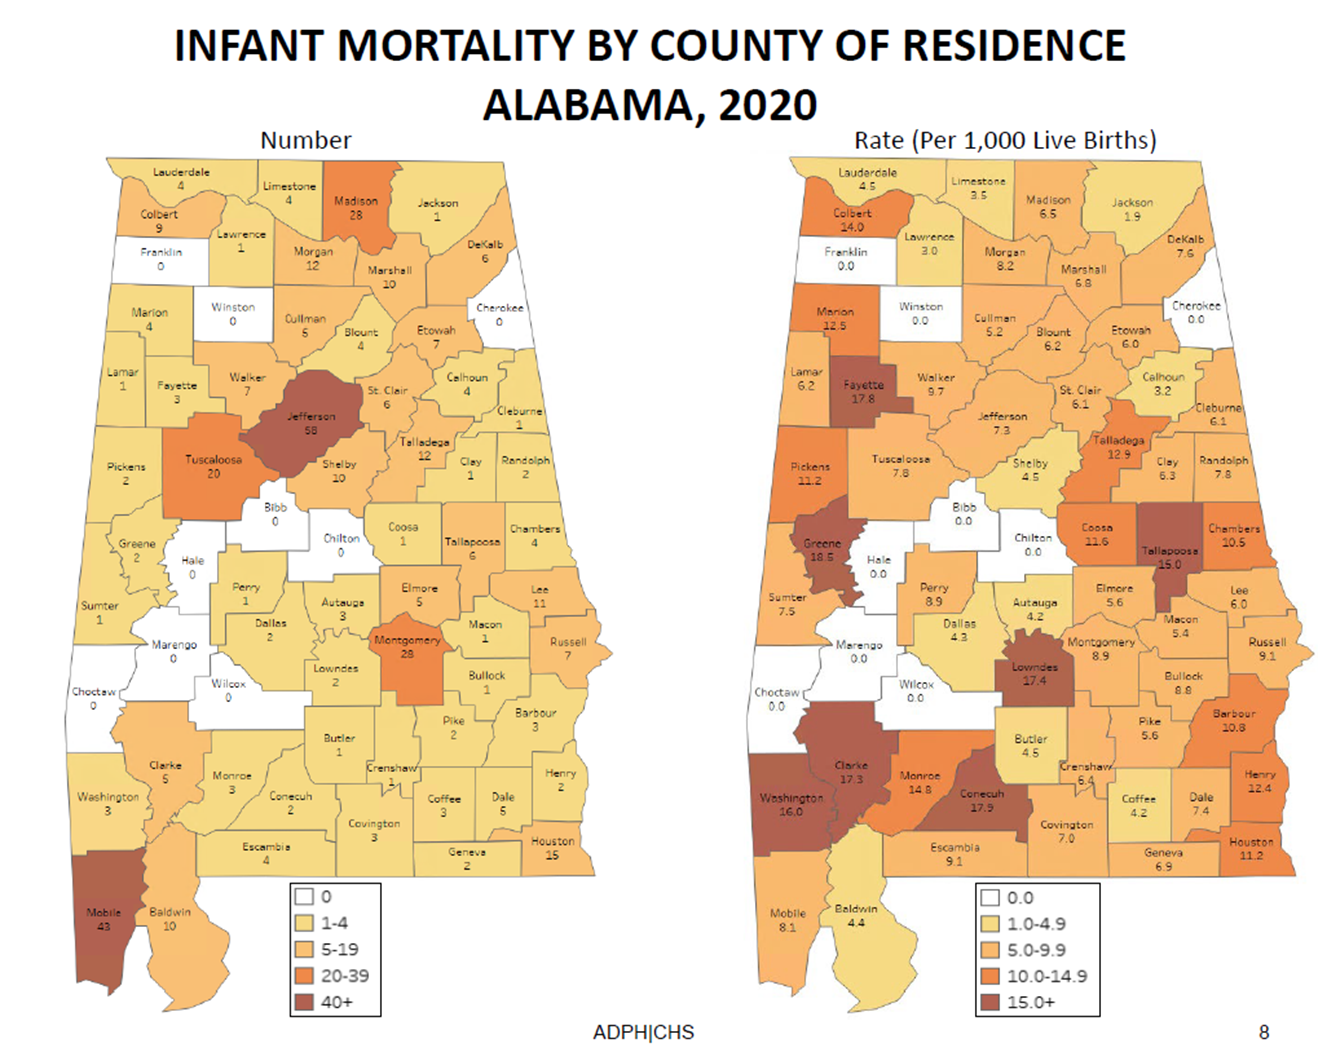
Infant mortality by county
Infant Mortality Rates in Alabama are the ____ highest in the US (2019)
4th
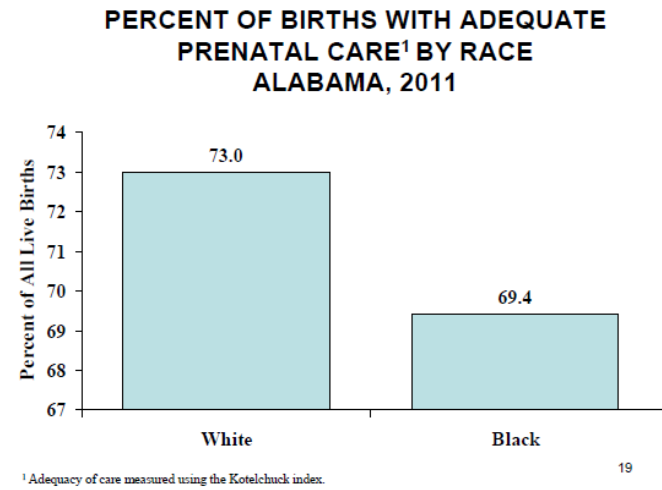
Infant Mortality Rates in Alabama are ___ as high among women of African American descent as compared to Caucasian women
2x
seeks to identify critical community strengths and weakness as well as unique health and social issues associated with poor outcomes of pregnancy
Fetal Infant Mortality Review Program (FIRM)
Collaborates with the Federal Maternal and Child Health Bureau to implement the FIRM Program
American College of Obstetricians and Gynecologists
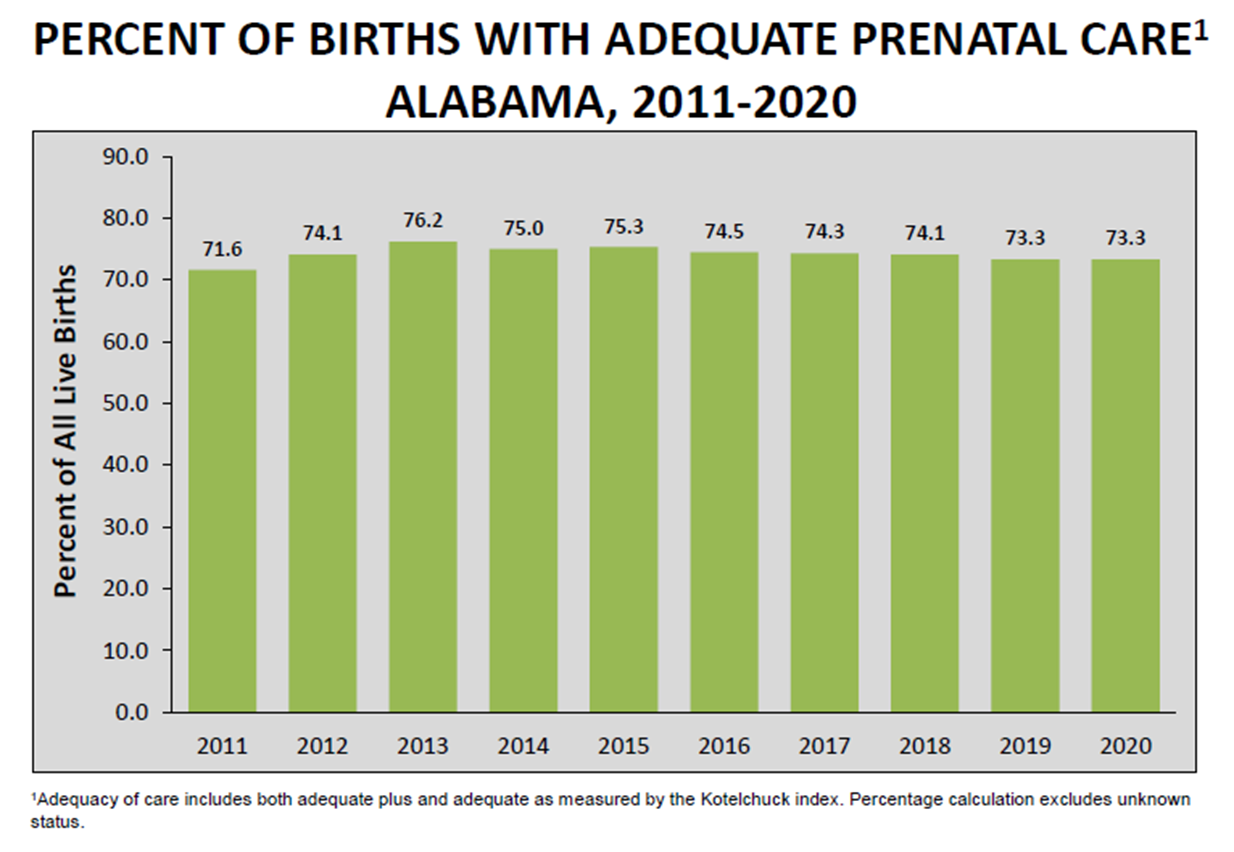
Percents of births with adequate prenatal care in Alabama
Roughly ___/___ of women who gave birth in Alabama in 2020 did not have adequate pre-natal care.
1/4
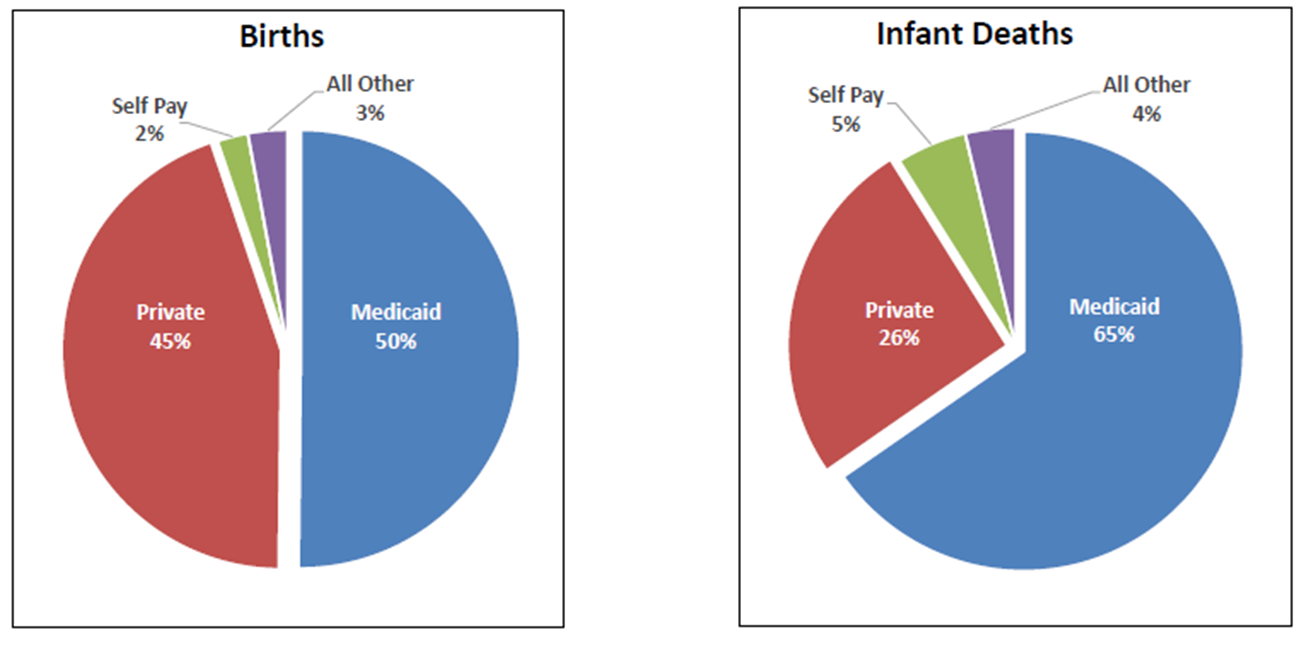
Infant deaths and births by payment source at birth in Alabama
50% percent of all births in Alabama are paid for via
Medicaid
___/___ of infant deaths occur to mothers on Medicaid
2/3
RR of infant deaths under Medicaid as compared to Private Insurance = ___
2.5
Infant deaths are ____% higher among women delivering under Medicaid Insurance
150
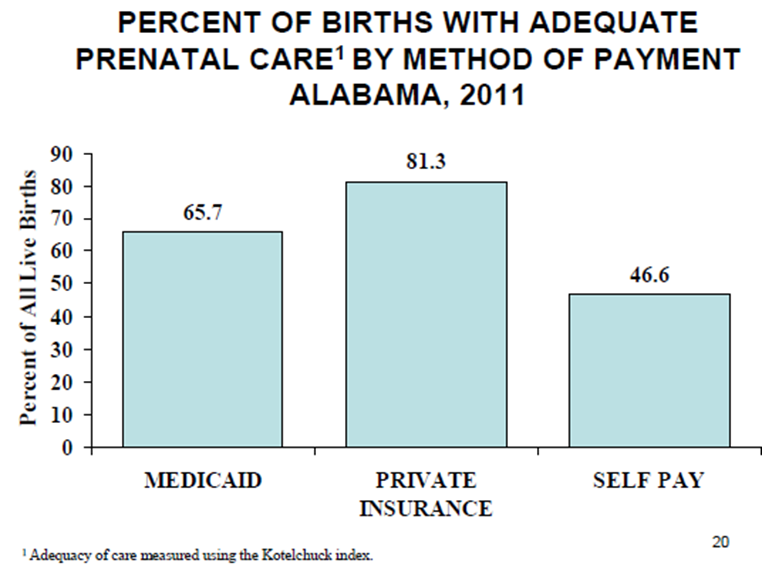
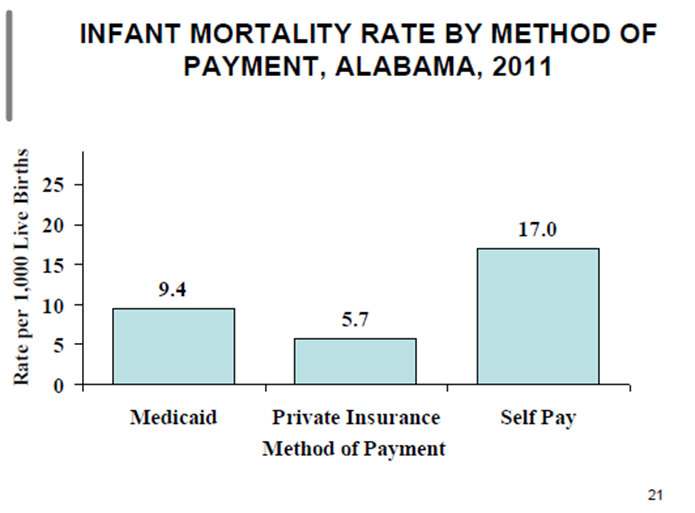
Infant mortality by payment in Alabama
Leading causes of infant mortality US
Congenital malformations, deformations and chromosomal abnormalities (11.2 per 1,000 live births)
Short gestation / low birth weight (8.7 per 1,000 live births)
Sudden Infant Death syndrome (3.8 per 1,000 live births)
Accidents (unintentional injuries) (3.3 per 1,000 live births)
Newborn affected by maternal complications of pregnancy (3.1 per 1,000 live births)
For minority women, the most frequent source for payment for the delivery is ______.
Medicaid
Represents the average number of years that a group of infants would live if they were to experience throughout life the age-specific death rates prevailing during a specified period.
Life expectancy at birth
The COVID-19 pandemic has made a definitive dent in life expectancy in the US: overall, there was a drop of ___ years in life expectancy from 2019 to 2020
1.8
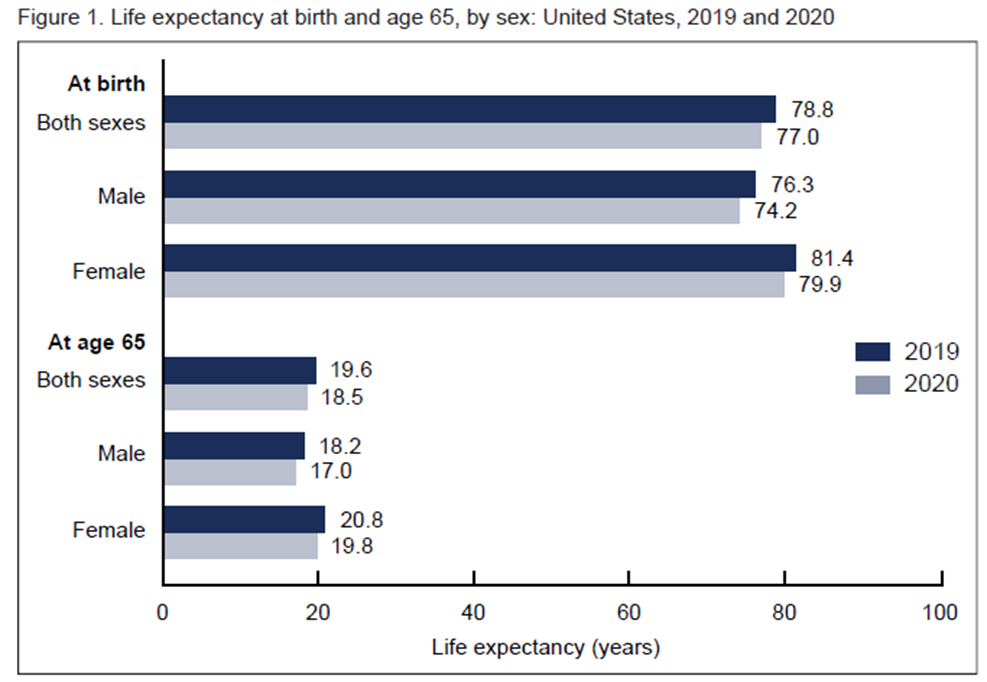
Life expectancy at birth
While all ethnicities experienced a decrease in life expectancy in the first half of 2020, the largest decrease was experienced by ___, non-Hispanic persons (-2.7 years).
Black
Disparities in the death toll from COVID-19
Persons of Hispanic descent experienced a decrease of 1.9 years
White persons experienced a drop of 0.8 years
Non-Hispanic black males experienced a drop of -3.0 years. The highest drop of any subgroup
White males and white females experienced the smallest drops in life expectancy
Types of mortality rates
CRUDE
CAUSE-SPECIFIC
AGE-SPECIFIC
(* INFANT MORTALITY RATE)
SEX-SPECIFIC
RACE/ETHNICITY -SPECIFIC
COMBINATIONS: AGE, SEX, RACE SPECIFIC
AGE-ADJUSTED DEATH RATES
COVID ranked as the ____ cause of death in 2021, while _______ and _______ remained as first and second, respectively.
3rd
heart disease and cancer
Accidents are the _____ major cause of death
4th
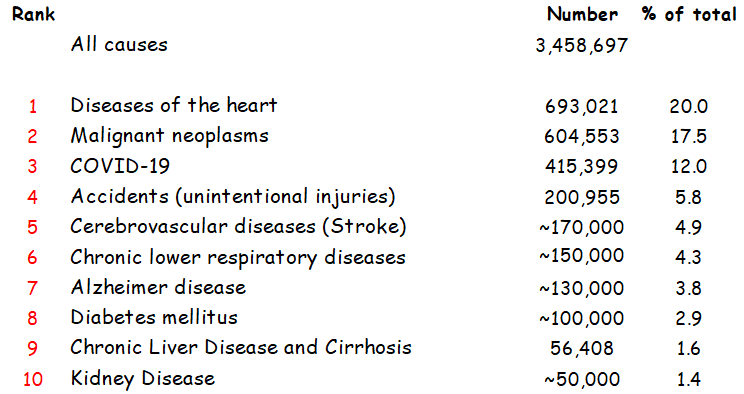
10 major causes of death, US 2021
Mortality rates general formula
Deaths during a given time period
Population among which deaths occured
Crude mortality rate =
Deaths from all causes in a year
Total population at Mid-year
Mortality rate from a specified cause for a population (Cause specific MR)
Deaths from specified cause
Total population at Mid-year
Two major Cancer Registries operate in the United States:
Surveillance Epidemiology and End Results (S.E.E.R Registry) supported by the National Cancer Institute, covers geographic areas representing 28% of the US population
The National Program of Cancer Registries, administered by the Centers for Disease control and Prevention (CDC), operates in 45 States
Alabama’s Cancer Registry is part of the National Program for Cancer Registries
The most numbers of NEW cases of cancer (INCIDENCE) are for ______ cancer in men and ______ cancer in women. Cancer of the _____ _____is the fourth cause of INCIDENT cancer in females.
Prostate
Breast
uterine corpus
With regards to MORTALITY, cancer of the prostate and cancer of the breast fall ______ to lung cancer. Cancer of the ovary ranks _____ in cancer mortality among females, and cancer of the uterine corpus, which ranked fourth in incidence ranks ___ in mortality
second
5th
6th
cancer of the uterine corpus, which ranked fourth in incidence ranks __ in mortality
6th
Cancer of the ovary ranks __ in cancer mortality among females
5th
With regards to MORTALITY, cancer of the prostate and cancer of the breast fall second to ___ cancer
Lung
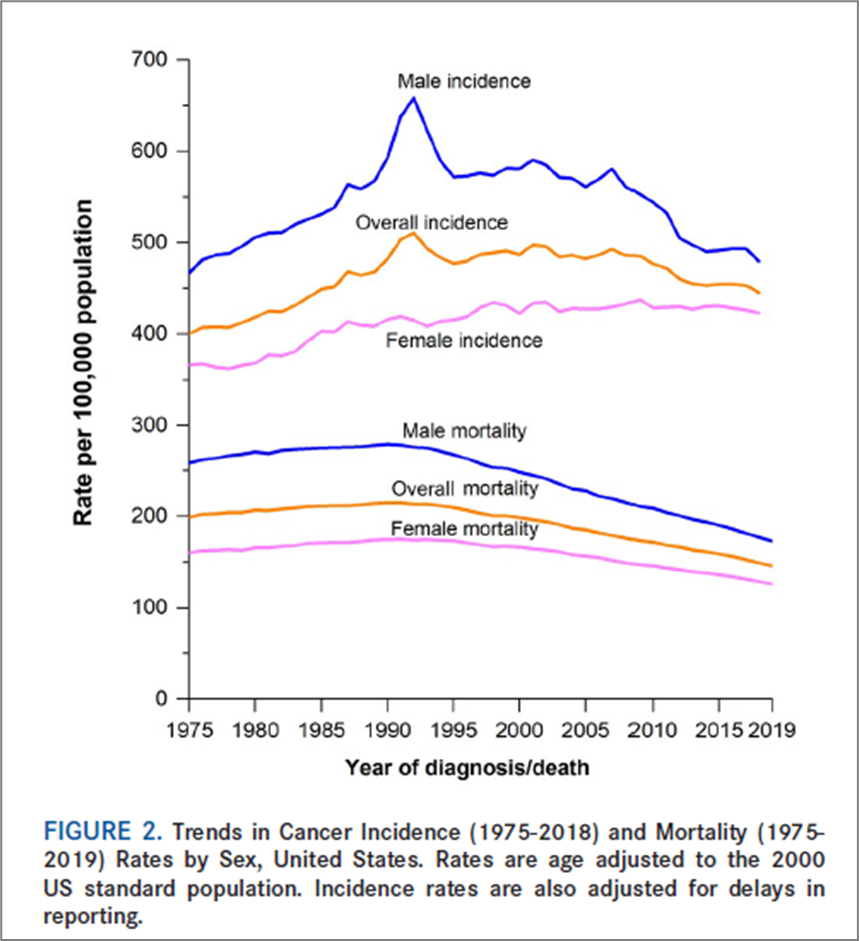
The graph shows trends in cancer incidence and mortality. Both show a tendency to decrease
Crude death rates =
No. deaths/population
Crude death rates are very sensitive to the ___ structure of a population
age
For 2017, per 100000
Crude death rate in Alaska = 596.2
Crude death rate in Florida = 970.4
But, the difference could be due to the higher proportion of older people in Florida as compared to Alaska
For a fair comparison we need to “remove” the difference in age structure
For 2017, per 100000
Age adjusted death rate in Alaska = 708.8
Age adjusted death rate in Florida = 672.1
They are FICTITIOUS RATES generated to account for different age distributions of a population: for example, the age distribution of the US population in 1975 would be different from the age distribution of the US population in 2020
Age adjusted rates
Solve the issue of how to compare mortality rates between populations (e.g., Florida to Alaska) or across time frames.
Age adjusted rates
You need age-specific death rates for ____ of the populations being compared and a single standard population to calculate Age adjusted rate
Each

Alabama has the highest crude death rate, but Mississippi has the highest age-adjusted death rate.
Therefore, relative speaking, Mississippi is doing worse with respect to mortality than Alabama.
If we look at the crude death rate by ethnicity, the Caucasian population in the United States has the _______mortality.
When we age-adjust we see that, relatively speaking, the African American population has the ____ mortality of all ethnicities in the US
highest
most
Are real numbers
Their magnitude represents the actual number of deaths in a population
Have REAL value
Crude death rates
Are fictitious numbers
Their magnitude depends on the standard population chosen for their calculation
Have RELATIVE value
Age adjusted death rates
The leading cause of infant mortality in the US is:
A. Maternal eclampsia
B. Child abuse
C. Congenital malformations, deformations and chromosomal abnormalities
D. Sudden infant death syndrome
E. Rotovirus
C. Congenital malformations, deformations and chromosomal abnormalities
The leading cause of death in the adult US population is:
A. Heart disease
B. Chronic obstructive lung disease
C. Diabetes
D. Cancer
E. Alzheimer’s disease
A. Heart disease
With regards to mortality rates, all of the following are true, EXCEPT:
A. Age adjusted mortality rates do not count actual deaths, rather, they are fictitious numbers with only relative value
B. The denominator of the formula for the infant mortality rate is the number of live births in the year
C. Crude mortality rates show the actual mortality experience of a population
D. Age-adjusted death rates will vary depending on the standard population being used in their calculation
E. The United States has a very low infant mortality rate in comparison with other developed countries in the world
E. The United States has a very low infant mortality rate in comparison with other developed countries in the world
Which of the following is true regarding age-adjusted death rates?
They are based on real numbers
They represent the actual number of deaths in a population
They do not allow compatibility between populations
They are very sensitive to the age structure of a population
They have a relative value
They have a relative value