Clinical Biochemistry
1/280
Earn XP
Description and Tags
1hr exam SAQ 7-8 (75%), ERQ 2 (25%)
Name | Mastery | Learn | Test | Matching | Spaced | Call with Kai |
|---|
No analytics yet
Send a link to your students to track their progress
281 Terms
Clinical chemistry definition
The biochemical analysis of body fluids to support the diagnosis and treatment of disease
Utilizes chemical reactions to identify or quantify levels of chemical compounds in bodily fluids
Instrumentation (Techniques) (20)
Autoanalysers
Calibration curves
Enzymes
Spectrophotometry and photometry
Spectrofluorimetry
Atomic absorption and emission spectrophotometry
Electrochemistry and ion-selective electrodes
Electrophoresis and related techniques
Chromatography and mass spectrometry
Immunoassays
Renal function tests
Electrolyte balance and blood gases
Liver function, enzymes, and isoenzymes
Carbohydrate metabolism
Lipid and lipoprotein metabolism
Hypothalamus and pituitary axis
Thyroid function
Sex hormones
Adrenal hormones
Tumour markers
Biochemical Analysis
Characterisation of biological components in a sample using laboratory techniques
Samples:
Blood
Serum
Plasma
Urine
Cerebrospinal fluid (CSF)
Synovial fluid
Saliva
Other body fluids or tissues depending on the test
Qualitative vs Quantitative analysis of BA
Qualitative analysis:
Determines whether a biomolecule is present or absent
Offers a binary outcome (positive or negative)
Example: Testing blood for a particular drug or presence of a biomarker
Quantitative analysis:
Determines the quantity or concentration of a biological molecule in a sample
Measures amount or concentration
Example: pH, haemoglobin, or glucose concentration in blood
Criteria for Selecting an Analytical Method (11)
Number of samples to be analysed
Cost of test and availability of equipment
Ease and convenience of the method
Duration of analysis (turnaround time)
Required level of accuracy and precision
Expected concentration range of the analyte
Sensitivity and detection limit of the technique
Analytical specificity
Type and physical form of the sample
Likelihood of interfering substances (e.g. lipaemia, cross-reactivity)
Operator skills and expertise (=training)
Lipaemia
The presence of a high concentration of lipids (mainly triglycerides) in the blood
Linearity
Ability of a test to provide results directly proportional to analyte concentration in a sample
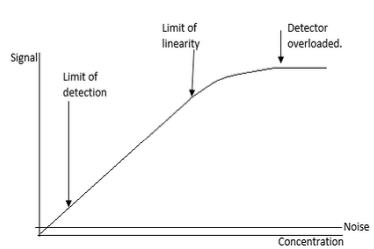
Limits of Linearity
Defines a limited range of values between which results are regarded as accurate
If results exceed the upper limit: dilute sample and retest to obtain accurate value
If results are below the accepted value: repeat test, report result, inform physician, occasionally repeat using larger sample volumes, or analyse other analytes
Results outside the linear range require specific corrective actions
Limit of Detection (LOD)
Limit of Detection (LOD)
Lowest analyte concentration that can be distinguished with reasonable confidence from blank or background
Important for comparing analytical procedures, techniques, or instruments
Analytical Specificity
Ability to measure only the analyte of interest
Example: Immunoassays rely on Ag-Ab interactions
Ideally fully specific, but cross-reactivity or interfering substances can occur → obtain detailed patient history to report results confidently
Analytical Sensitivity
Smallest amount or concentration of an analyte that can be detected
Related to limit of detection (LOD) for the assay
Depends on assay generation (1st, 2nd, 3rd, etc.)
Accuracy vs. Precision
Accuracy:
Ability of a test to produce the true value of an analyte in a sample
Multiple measurements of the same analyte will distribute around the true value
The mean of measurements represents the true value
Check: Compare with different methods
Poor accuracy → procedural or equipment flaws
Precision:
Ability of a test to reproduce the same result consistently in the same specimen
Spread or distribution of results reflects method variability
Variability expressed as Standard Deviation (SD)
Reproducibility: Check by repeating measurements (trials)
Poor precision → poor technique
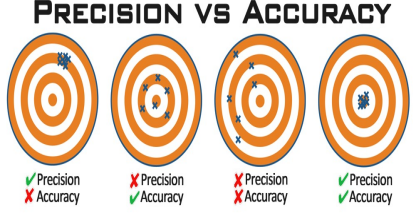
Accuracy and Precision
Accurate but Imprecise: Close to true value on average but results are scattered → Random Error
Precise but not Accurate: Results are consistent but deviate from true value → Systematic Error
Inaccurate & Imprecise: Scattered and far from true value → poor measurement
Accurate & Precise: Ideal state, results are consistent and close to true value (difficult to achieve due to multiple variables like lab staff, steps involved)
Improving Accuracy
Using properly standardized procedures
Statistically valid comparisons of new methods with established reference methods
Using samples of known values (controls)
Participation in proficiency testing (PT) programs
Ensuring Precision
Proper inclusion of standards
Using reference samples or control solutions
Statistically valid replicate determinations of a single sample
Duplicate determinations of sufficient numbers of unknown samples
Measuring day-to-day and between-run precision using control samples
Accuracy and Precision photo
Faulty weighing balance
May give precise (repeatable) but inaccurate (untrue) results
What can be done:
Perform precision checks (repeat measurements)
Compare with known standards or reference methods to detect bias
Calibrate the instrument regularly to correct systematic errors
Random Error
Test values scattered around true mean
Imprecise, usually >2 SD apart
Systematic Error /Bias
Constant bias from true value
Results are grouped closely (within 1 SD) but different from true mean
Measurement error that skews results consistently to one side
Causes:
Incorrectly calibrated instruments
Change in reagent/calibrator lot
Inadequate storage of reagents/calibrators
Pipettor misadjustments or misalignments causing volume changes
Temperature changes in incubators or reaction blocks
Procedural differences between operators
To Overcome:
Use carefully standardised procedures
Measure a single variable in several different ways and compare results
Work blind when possible (e.g., use of codes)
Measurement Error
Examples:
Mistakes in taking readings
Faulty equipment
Equipment accuracy limits
Errors in preparing solutions or dilutions
Calibration errors
Interfering substances
To Overcome:
Take repeated readings
Compare readings between instruments
Spike and measure recovery: add a known amount of analyte to the sample and compare the response to the same spike in standard diluent
Keep records of batch numbers and measurements for solutions
Check controls or standards and construct standard/calibration curves
Validation Procedures
Use Standard Operating Procedures (SOPs)
Calibrate assays with certified reference materials containing known analyte amounts, traceable to a national reference lab
Quality Assurance (QA): System to verify the entire analytical process operates within acceptable limits
Quality Control (QC): Mechanisms to measure non-conforming method performance
Importance:
Essential for all assays
Provides confidence in precision and accuracy of tests
Enables early detection of poor assay performance
Allows proper corrective actions to minimize the risk of patients receiving incorrect result
Keep Records:
Batch numbers
Analysis performance
Results
Reagent and calibrator temperatures
Ability to quote assay performance at measurement time allows labs to defend results and gives clinicians confidence in patient care
SOP (Standard Operating Procedure)
A documented set of step-by-step instructions that describes how to perform a specific laboratory or clinical procedure consistently and correctly
Purpose:
Ensures consistency and reliability of results
Maintains quality and safety
Helps train staff and reduce errors
Provides a reference for audits and compliance
Calibration
Aligning an instrument to provide accurate, precise, and unbiased measurements consistent with other instruments at a precise point
Purpose:
Ensure accuracy and precision
Reduce/eliminate bias across a range of values
Maintain consistency between instruments
Important Notes:
Poor standard preparation → inaccurate results
Never extrapolate beyond the highest standard - assume linearity only within calibrated range
Be consistent in significant figures used
How Calibration is Done
Select reference standards with known values covering the range of interest
Measure standards using the instrument to be calibrated
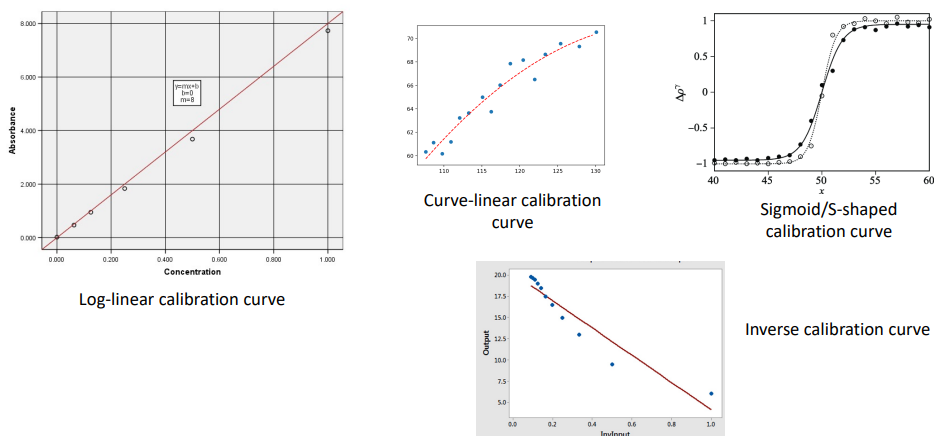
Plot calibration curve/standard curve (response vs known values)
Use the curve to determine amount/concentration in test samples
Correct measurements using the inverse of the calibration curve if necessary
Types of Calibration Curve (photo)
Preparation of a Calibration Curve (9)
Choose an appropriate test method
Select amount/concentration, range, and number of standards covering expected sample levels
Prepare standards carefully (consider volumetric accuracy, standing time, temperature, light protection, include blank/zero standard)
Assay standards and test samples simultaneously; take replicate readings
For some instruments, periodically check zero and highest standard to ensure stability
Draw the standard curve or determine underlying relationship
Draw line of best fit for linear curves
Quote r² to indicate fit quality
Determine unknown sample concentrations from the curve or mathematical relationship (e.g., y=mx+c)
Correct for dilution/concentration if test samples were diluted
Example: 0.2 mL assayed → multiply result by 5 for value per 1 mL
Quote results to an appropriate number of significant figures, reflecting method accuracy and consistency
When to Carry Out Calibration? (8)
Before major or critical measurements
Before measurements requiring high accuracy
After major or critical measurements
When data are unreliable or observations appear questionable
After incidents that may affect the instrument (e.g., impact, accidents)
For long-term instrument use, as conditions can change over time
Per experiment requirements, e.g., when calibration certificates are needed or using a new kit
As indicated by the manufacturer, following periodic calibration schedules to ensure proper and safe instrument function
Preparing Serial Dilutions
Linear Dilution Series:
Concentrations separated by an equal amount (e.g., 0.0, 0.2, 0.4, 0.6, 0.8, 1.0 µg/mL)
Steps:
Prepare a stock solution
Use formula [C1]V1 = [C2]V2 to calculate volumes
Tools like the Tocris dilution calculator can help determine volumes for desired concentrations
V1 = volume of stock solution
V2 = volume of diluted solution
C1 = starting concentration
C2 = target diluted concentration
Logarithmic Serial Dilution:
Concentrations separated by a constant proportion rather than equal increments
Clinical Sensitivity
Describes the ability of an assay to detect only patients with a particular disease
Clinical Specificity
Describes the ability of an assay to detect individuals who do not t have a particular disease
Clinical Validation
Examines the probability that an analytically correct result is really possible for that patient
Auto-Validation of Results
Delta Check: examine any value obtained for an analyte against the previous result
Range Check: determines whether the result is physiologically possible
Reference Range: within which 95% of the healthy population fall
Automation
Steps which were previously performed manually can now be automated
Scientist can focus on tasks that are not automated
Increases efficiency and capacity
Automation has been extended into areas not related to analysis:
Processing and transportation of specimens
Loading of samples onto analysers
Assessing results of the performed tests
Clinical Laboratory Automation
Integration of robotic transport systems with analytical instruments and pre/post-analytical equipment (e.g., centrifuges, aliquoters, decappers, recappers, sorters, specimen storage/retrieval)
Computers controlling devices must be interfaced with each other and/or the LIS
Types of information communicated include:
Process control and status of devices/analyzers, specimens, containers, and carriers
Patient, order, and result data
Specimen flow algorithms and automated decision-making
Ensures each specimen/aliquot undergoes correct tests in the proper sequence
Why Do We Need Automation?
Increases the number of tests one person can perform in a given time
Minimises result variations between operators
Reduces errors from manual analyses (e.g., equipment variations, pipettes)
Uses less sample and reagent per test
Allows scientists to focus on decision-making and result interpretation
Expands lab services into specialised and technically demanding assays
Makes performing repeats easier when necessary
Provides walkaway operations and standardised methodology for accurate and reproducible results
Limitations of Automation
Some basic steps might not be fully automated:
Specimen preparation and identification
Labelling (critical)
Programming of instruments
Checking Quality Assurance (QA) and Quality Control (QC) – of utmost importance
Analytic Process & Automation
Can be divided into 3 major phases:
Pre-analytic: Sample processing
Steps before the actual chemical analysis
Includes:
Patient preparation
Specimen collection, handling, and transportation
Labelling and identification
Sample processing (e.g., centrifugation, aliquoting)
Critical because errors here can affect all downstream results
Analytic: Chemical analyses
Steps during the actual chemical analysis
Includes:
Measurement of analytes using chemical or instrumental techniques
Use of calibration, standards, and controls
Ensuring accuracy, precision, and quality control
Most automated phase
Post-analytic: Data management
Steps after the chemical analysis
Includes:
Data verification and validation
Interpretation of results
Reporting results to clinicians
Archiving and record-keeping
Increasingly targeted for automation to improve efficiency and reduce human error
Research is increasingly focused on automating pre-analytic and post-analytic processes
Auto-validation
Automated process of result validation based on criteria set by scientific and clinical staff
Post-analytical automation mainly involves it
Benefits:
Improves turnaround time by automatically validating results that meet preset criteria
Withholds results that need further attention (e.g., out-of-range, repeats)
Introduces a uniform standard of validation across the laboratory
Types of Analysers
Continuous Flow Analysers
Centrifugal Analysers
Discrete Analysers
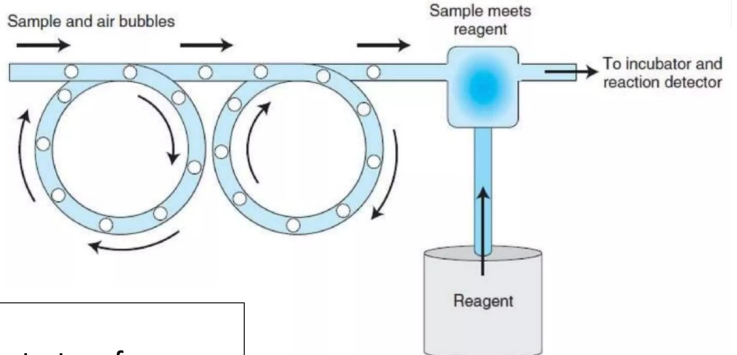
Continuous Flow Analysers
Liquids (reagents, diluents, samples) are pumped through continuous tubing
Samples introduced sequentially, following the same network and reaction path
Air bubbles at regular intervals separate and clean tubing
Sample + reagent → chemical reaction → chromagen solution pumped for spectrophotometric analysis
Advantages:
Uniformity in test performance
Run many samples requiring the same procedure
Multiple tests on each sample
Disadvantages:
Carry-over problems
Wasteful use of continuously flowing reagents
Continuous Flow Analysers (photo)
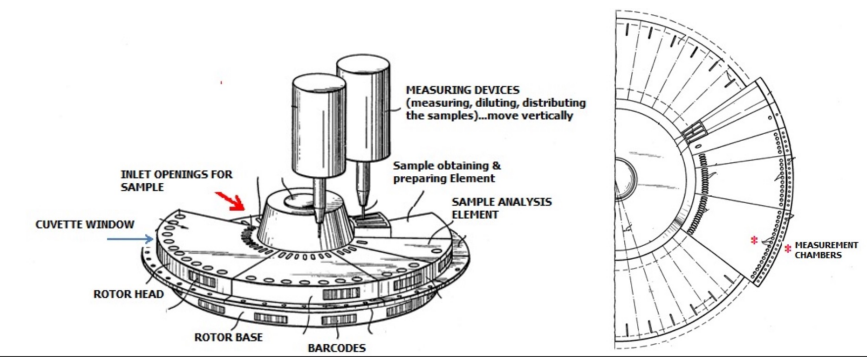
Centrifugal Analysers
Use centrifugal force to mix sample aliquot with reagent in spinning rotor
Sample + reagent passes through detector for quantification
Features:
Single-test batch analysers
Sequential analysis
Discrete (one compartment per assay)
Parallel analysis possible
Uses the force generated by centrifugation to transfer and then contain liquids in separate cuvettes for measurement at the perimeter of a spinning rotor
Advantage: Capable of batch analysis (multiple samples, one test at a time)
Centrifugal Analysers (photo)
Discrete Analysers
Most widely used automation type; most versatile
Each sample and reagent in separate cuvette/container
Can run:
Multiple tests on one sample (random access; e.g., LFTs, FBG)
Multiple samples, one test at a time (batch analysis; e.g., FBG on 20 patients)
Random Access:
Analysis kept separate in reaction chambers (cuvettes, wells, slides)
Minimizes carryover, but increases cost per test due to disposables
Batch Analysis:
Accumulating specimens into one run reduces reagent and personnel costs
Cost-effective for specialty tests with small order
Modern Discrete Analyser Capabilities
Routine and special chemistries, including enzymes, substrates, electrolytes, proteins, drugs of abuse, therapeutic drug monitoring
Capacity: up to 300 tests/hour
Continuous access to samples, reagents, cuvettes
On-board storage: 84 routine samples, 6 STAT samples, 39 fixed cooled calibrator/control positions, 45 refrigerated reagent positions, 600 cuvette storage positions
Low-volume cuvettes reduce reagent consumption and running costs
Automatic clot detection ensures result integrity
Integrated touchscreen workstation enables fast and convenient data management
Laboratory Information Systems (LIS)
Important development in laboratory automation
Initially used to generate consolidated laboratory result reports
Evolved to capture test requests and results and manage laboratory workflow
Has improved the overall quality of laboratory data
Types of Automation
Total Laboratory Automation (TLA):
First developed in the 1980s in Japan
Conveyor belts carry specimens to workstations
Automated pipettors aspirate serum from tubes for testing
Can include pre-analytical modules: centrifugation, decapping, aliquoting, labelling
Includes transport system for tube delivery to analysers, recapping, sorting, and storage of specimens
Modular Automation:
Integrates different aspects of automation and analysis into one module
Task-targeted automation systems for specific functions
Flexible: modules can be added or upgraded as lab needs change
Can operate independently or linked with other modules or LIS
Often includes sample handling, analysis, and reporting within a single module
Selecting the Analyser
Things to Consider:
Laboratory’s Workload:
Discrete vs large batch testing
open vs closed system
Single instrument or multiple instruments – ease of use & complexity
Back-up options vs outsourcing
Storage of Reagents:
Need for refrigeration or freezing
Effect of repeat freeze-thaw cycles
Random access
Patient/test orientation
STAT (emergency) facilities
Temperature control system (water bath vs Peltier effect)
Maintenance requirements
Running costs (excluding reagents, plastic ware, etc.)
Quality Assurance (PHOTO!)
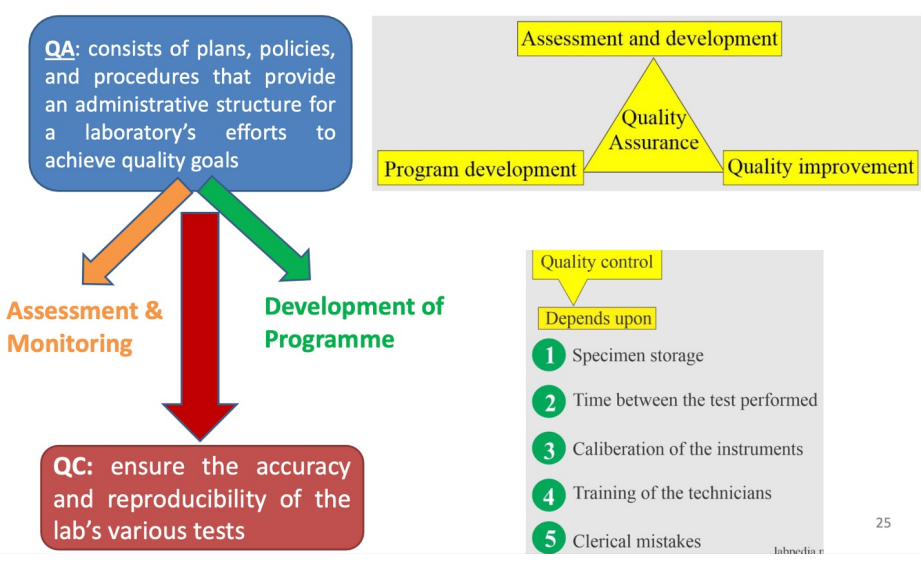
Quality Control (QC)
Purpose:
Ensure accuracy and reproducibility of laboratory tests
Provide early warning of errors so corrective action can prevent major mistakes
Maintain continuous record of test precision
Monitor analytic process and evaluate method accuracy
Evaluate technologist skills
Determine analytical errors during analysis
Prevent incorrect patient values
QC Goals:
Accuracy
Precision
Total error of the chemical method
Ideal Properties of QC Materials:
Resemble human serum, plasma, blood, urine, or cerebrospinal fluid
Stable for prolonged periods without interfering preservatives
Free from communicable diseases (bacteria, viruses, fungi)
Known concentration of analytes
Easy to store and dispense
Affordable
QC Objectives:
Continuous accuracy of results
Early warning to take remedies before major mistakes
Compare tests at different times using the same control sera
QC Tools:
Procedure manuals
Maintenance schedules
Calibrations
Quality assurance programs
Staff training
QC Results:
Acceptable: Within error limits
Unacceptable: Excessive errors, out of range
Types of QC Reagents
Pooled Sera:
Analyte levels usually within normal patient range; not suitable for clinically significant levels
Stability not validated like true third-party control
Increased infection risk (may not be tested for HIV, Hepatitis)
Inconsistent long-term supply
Company/Third-Party Produced Controls:
Extended shelf life and stability
Enable long-term QC monitoring
Detect shifts when reagents or calibrator lots change
Quality Assurance (QA) vs Quality Control (QC)
Aspect | Quality Assurance (QA) | Quality Control (QC) |
|---|---|---|
Definition | Set of activities to ensure quality in processes by which products/tests are developed | Product-oriented activities to ensure quality in finished products/tests |
Focus | Prevent defects by improving processes | Identify and correct defects in products/tests |
Goal | Ensure defects do not arise | Detect defects before release |
How | Establish, implement, and audit quality management systems | Use tools, equipment, assays, and procedures to find defects |
Orientation | Proactive; preventive | Reactive; corrective |
Process vs Product | Process | Product |
Sampling vs Specifications | Specifications | Sampling |
Assays vs Documentation | Documentation | Assays |
Organisation vs Authorisation | Organisation | Authorisation |
Function Type | Staff function | Line function |
Defect Handling | Prevent defects | Find and correct defects |
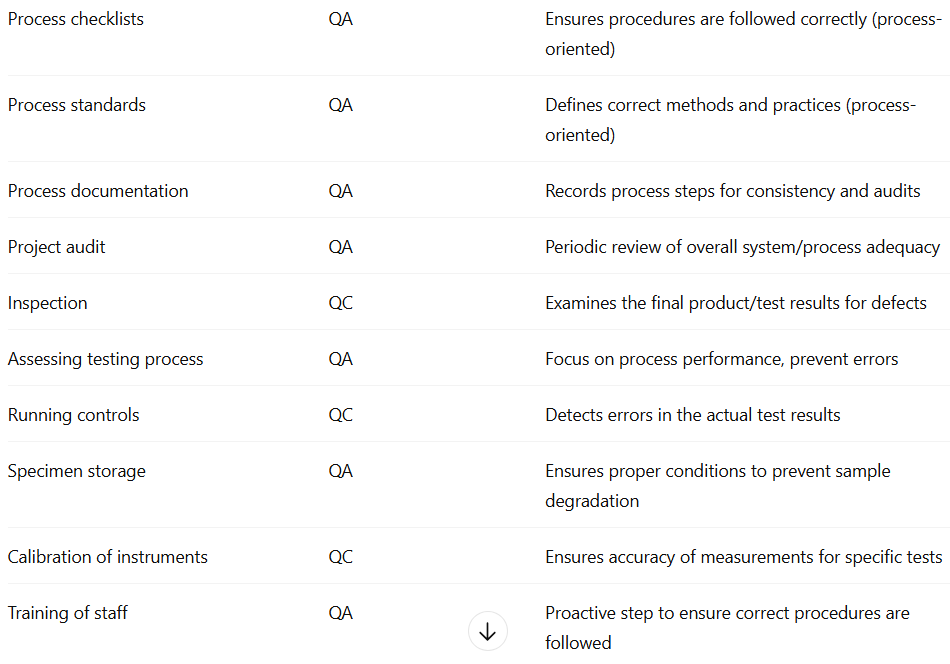
Examples of QC vs QA (photo)
Pre-Analytical Errors Prevention
Patient identification & labelling: Use barcode technology to reduce errors
Record keeping: Track sample receipt and reporting
Request form checks: Confirm test tube, name, and requested tests
Sample adequacy: Ensure sufficient volume
Sample quality: Check for haemolysis, lipemia, icterus
Patient history: Record food intake, alcohol, drugs, smoking, stress, sleep, posture; explain instructions for sample collection
Containers & preservatives: Use correct types to avoid affecting results
Transport: Ensure proper handling to protect sample integrity
Processing: Correct separation (e.g., centrifugation) with proper speed, temperature, and operator technique
Analytical Errors Prevention
Preventive maintenance: Daily/monthly schedules for instruments
Equipment checks: Monitor water quality, power supply, calibrate balances, glassware, pipettes
Reagents/kits: Date upon receipt and opening
Lot validation: Run new reagent lots in parallel with old ones before use
Standards:
Primary standard: Highly purified substance
Secondary standard: Concentration determined by comparison with primary standard
Post-analytic errors: Avoid errors in recording and reporting results
Quality Management (photo)

Photometry
The measurement of luminous light (luminous intensity) falling on a surface from a light source
Photometric instruments measure light intensity without considering wavelength (λ)
Electromagnetic Radiation
Described as photons of energy traveling in waves
Frequency is inversely proportional to wavelength (λ)
Energy is inversely proportional to wavelength (shorter wavelength = higher energy)
Spectrum ranges from short-wavelength, high-energy gamma and X-rays to long-wavelength radio waves
Absorption and Emission
Spectrophotometers and photometers measure absorption or emission of radiant energy to determine concentration
Absorption or emission of energy by atoms produces a line spectrum
Molecules absorb or emit energy over a broad region (band spectrum)
Solids produce a continuous spectrum
Absorbance: amount of light absorbed
Excited electrons return to ground state by emitting a specific wavelength of radiant energy
Light Interaction with Solution
When a light beam enters a solution:
Some light is absorbed
The remaining transmitted light reaches the detector and is converted into an electrical signal
The amount of light absorbed varies according to the concentration of the substance
Light Interaction with Solution (photo)
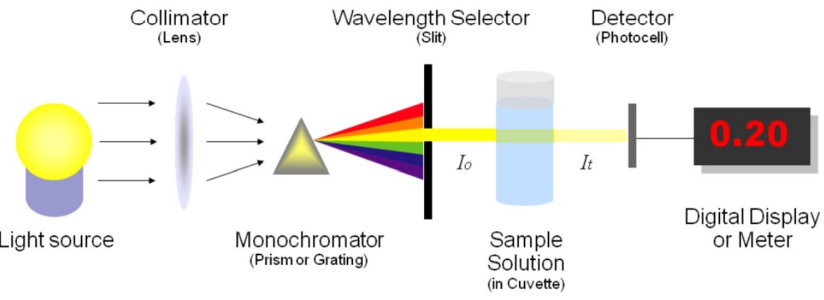
% Transmittance (T)
Defined as the ratio of radiant energy transmitted (It) to radiant energy incident on the sample (I₀):
T = It / I₀If all light is absorbed or blocked → 0% T (e.g. a very concentrated sample)
It is important to always run a blank to account for background absorbance
Absorbance (A) = –log(T) = –log(It / I₀)
The difference in transmitted light between the blank and the sample is due only to the compound being measured
Beer’s Law (Beer-Lambert Law)
Establishes the relationship between analyte concentration and absorbance
States that absorbance (A) is directly proportional to concentration (c) and path length (L)
Mathematically:
A = ε × L × cε = molar absorptivity (ability of a molecule to absorb a specific wavelength)
L = path length of light through the solution
c = concentration of the absorbing molecule
The amount of light absorbed at a given wavelength depends on:
Type of molecules or ions present
Concentration
pH and temperature
Absorbance and Concentration
Unknown concentrations are determined using a calibration curve plotting absorbance vs. concentration for known standards
This allows for accurate quantitative analysis and instrument calibration
Spectrophotometry
When light passes through an object, part of it is reflected, absorbed, and transmitted
Purpose: Measures the amount of light transmitted by a solution to determine the concentration of the light-absorbing substance
Principle: Measures light intensity as a function of wavelength by:
Diffracting the light beam into a spectrum of wavelengths
Directing it onto a sample
Receiving and detecting the transmitted or reflected light
Measuring the intensity and displaying it as a graph on the detector/display device
Spectrophotometer Components
Light Source
Monochromator
Sample Cell (Cuvette)
Photodetector
Light Source
Provides the initial beam of radiant energy
Important factors:
Range/Bandwidth (spectral distribution)
Brightness
Stability (bulb condition)
Temperature
Lifetime
Common Light Sources
Source
Region
Notes
Tungsten Lamp
Visible & IR
- Produces 320–2500 nm range- Often paired with heat-absorbing filter to block IR- Glass construction (400–800 nm)
Advantages: Cheap, non-toxic, good for small-area lighting
Disadvantages: Inefficient (90% energy lost as heat), unsuitable for large areas
Deuterium Lamp
UV
- Continuous emission down to 165 nm- Common for UV work (160–325 nm)- Quartz construction (does not block UV)
Mercury or Xenon Lamp
UV-Vis
- Mercury provides line spectra; Xenon provides continuous spectra
Laser
Variable - Xray/ UV/ IR
- High power, narrow bandwidth, coherent, tunable wavelength, very expensive
Plasma/Furnace Sources
Elemental studies
Used for atomic absorption or emission spectroscopy
Monochromator
Purpose: To isolate individual wavelengths of light and direct only one onto the sample
Reason: Each compound absorbs optimally at a specific wavelength (e.g. Urea: 260–280 nm; Creatinine: 280–320 nm)
Function:
Isolation of wavelength depends on the entrance and exit slit width
Bandpass (bandwidth): Defines the range of wavelengths transmitted
Slit width determines resolution and signal-to-noise ratio
Large slit width: More light energy → higher signal-to-noise ratio → lower resolution
Small slit width: Less energy → lower signal-to-noise ratio → better resolution
Wide slit → more energy, lower resolution
Narrow slit → less energy, higher resolution
Diffraction gratings = most accurate and commonly used
Coloured-glass filters = cheapest, least precise
Interference filters = narrow, efficient, precise
Prism = adjustable, produces continuous spectrum
Types of Monochromators
Coloured-Glass Filters
Interference Filters
Prism
Diffraction Gratings
Coloured-Glass Filters - Monochromators
Simple filters that transmit a wide band of wavelengths and absorb others
Features:
Least expensive and simple to use
Pass a broad range of wavelengths with low precision
Application: Used in colorimeters for measuring color intensity
Interference Filters - Monochromators
Based on constructive interference of light waves
Construction: Two glass plates, each mirrored on one side, separated by a transparent spacer equal to half the target wavelength
Features:
Produces monochromatic light with a narrow bandwidth
Provides high efficiency and better wavelength selectivity
Prism - Monochromators
Light is refracted as it enters and exits the prism, separating white light into its spectral components
Operation:
A narrow light beam enters the prism and disperses into a continuous spectrum
Rotation of the prism allows selection of the desired wavelength through the exit slit
Output: Continuous spectrum with adjustable wavelength selection
Diffraction Gratings - Monochromators
Most commonly used monochromator type
Construction: A polished surface etched with many fine parallel grooves (15,000–30,000 per inch)
Principle:
Light is diffracted (bent) when it passes by sharp edges
Constructive interference (in-phase waves) reinforces certain wavelengths → produces clear spectral lines
Destructive interference (out-of-phase waves) cancels out others
Output: Complete and highly resolved spectra
Note: Accessory filters are often added to reduce stray light caused by multiple diffraction orders
Sample Cell (Cuvette)
Shape: Can be round or square
Key Point: The light path must remain constant since absorbance is directly proportional to concentration
Round cuvettes:
Must have an etched mark indicating the correct position for use
Square cuvettes:
Have plane-parallel optical surfaces and a constant light path
Frosted sides to ensure correct positioning
Advantages:
Reduced lens effect and refraction errors
Less dependent on orientation
Most commonly used type
Condition:
Cuvettes with scratches scatter light and should be discarded
Material:
Glass cuvettes: Cheap and disposable; suitable for visible range but absorb UV light
Quartz cuvettes: Reusable and essential for UV applications
Photodetector
Purpose: Converts transmitted radiant energy into an equivalent electrical signal
Choice of detector: Depends on the wavelength being studied
Single-beam spectrophotometer: 100% transmittance control must be adjusted each time the wavelength is changed
Types of detectors:
Potentiometric recorders
Photocell
Phototube
Photomultiplier (PM) tube
Amplifiers & Ammeters
Requirements:
High sensitivity to detect low radiant energy
Short response time
Long-term stability
Electrical signal easily amplified for readout
Photomultiplier (PM) Tube - Photodetector
Purpose: Detects and amplifies radiant energy
Advantages:
200× more sensitive than other detectors
Ideal for extremely low light levels or very short light flashes
Current signal is proportional to light intensity
Analog signal is converted to voltage, then to digital via an A/D converter
Single-beam Spectrophotometer
One light path for both reference and sample
Light passes through collimating lens → entrance slit → filter → sample → shutter → photovoltaic cell → readout
Requires blank for correction between reference and sample absorbance
Advantages:
Less expensive
High energy throughput → high sensitivity
Easy to operate
Disadvantages:
Instability from electronic, voltage, or mechanical fluctuations
Must be zeroed or calibrated regularly → human error
Variations in light intensity → errors in %T
Non-monochromatic light → deviation from Beer’s law
%T and A not “true” values
Not designed for spectral data
Double-beam Spectrophotometer
Splits light path into reference and working segments
Automatically corrects for variations in light intensity
Advantages:
High speed, stability, flexibility
Reduces errors from single-beam fluctuations
More reproducible measurements
Typically simpler operation
Wavelengths easily selected
Disadvantages:
Changes in wavelength may cause variations
Measurement Options
Qualitative Analysis
Quantitative Analysis
Typical Plate-based Spectrophotometric Assay
Enzyme Assays
Qualitative Analysis
Visible and UV spectrophotometers can identify classes of compounds in pure or biological samples
Done by plotting absorption spectrum curves
Absorption in different regions gives structural hints
Absorption Range (nm)
Structure / Type of Compounds
220–280
Aliphatic or alicyclic hydrocarbons or derivatives
220–250
Compounds with two unsaturated linkages in conjugation, benzene derivatives
250–330
Compounds with more than two conjugated double bonds
450–500
Beta-carotene (11 conjugated double bonds, precursor of Vitamin A)
250–330
Vitamin K1
Quantitative Analysis
Substrates: UA, Urea, Creatinine, LFTs, Lipid profile, etc
DNA
Protein (measured at 280 nm, depends on tyrosine and tryptophan content)
Typical Plate-based Spectrophotometric Assay
Often kit-based, specific for particular analyte (e.g., ELISAs, small molecules, lipids)
Prepare standards of known concentrations
Add samples to wells
Add reactants (assay-dependent)
Color develops based on analyte concentration
Read at appropriate wavelength
Create standard curve
Calculate sample concentrations using standard curve
Enzyme Assays
Examples: LDH, GPT, GGT, GOT, CK, ALP
Substrate or product absorbs light in visible or UV range
Lactate Dehydrogenase (LDH)
Reaction: Lactate + NAD → Pyruvate + NADH + H⁺
NADH absorbs at 340 nm; NAD does not
Forward reaction monitored by measuring increase in absorbance at 540 nm
Spectrophotometer QC – Maintenance / Routine Checks
Washing, blanking, water check
Temperature check
Alignment of the needle
Cuvette dispenser
Bulb lifetime
Piping (contamination, kinks, solids)
Waste disposal and container washing
Washing of pipes
Spectrophotometer QA
Periodic Checks (Monthly or more)
Wavelength accuracy: Using standard absorbing solutions or filters with known absorbance maxima
Stray light: Caused by scratches or dust in the light path, λ outside the transmitted band
Linearity: High concentrations may not be linear; dilution and calibration curve needed
Filters: Checked and replaced as needed
Spectrophotometers should be able to automatically dilute samples when necessary
Fluorescence Spectroscopy
Based on the ability of certain molecules (fluorophores) to absorb light at one wavelength (excitation) and emit light at a longer wavelength (emission)
Fluorescence
Some molecules absorb energy from photons and move to an excited state
When they return to the ground state, they release a photon as fluorescence emission
Fluorophores
Molecules that can be excited by light of a particular wavelength, absorb photons, and emit light at a different wavelength
Rigid planar structure
Highly conjugated system with alternating single and double bonds
Condensed fused-ring system containing one or more heteroatoms
Presence of electron-donating groups (e.g., –OH, –NH₂)
Presence of electron-accepting groups conjugated with the donating groups
Biological Fluorophores
Endogenous Fluorophores
Exogenous Fluorophores
Endogenous Fluorophores
Amino acids
Structural proteins
Enzymes and co-enzymes
Vitamins
Lipids
Porphyrins
Certain metals
Exogenous Fluorophores
Cyanine dyes
Drugs, both medicinal and illegal
Pollutants
Photosensitizers
Molecular markers, e.g., GFP
Applications of fluorophores
Immunofluorescence
Cytogenetics: FISH
Flow cytometry
Fluorescent immunoassay
DNA sequencing
Determination of fluorescent drugs in low-dose formulations in the presence of non-fluorescent excipients
Carrying out limit tests where the impurity is fluorescent
Studying the binding of drugs to components in complex formulations
Widely used in bioanalysis for measuring small amounts of drug and studying drug-protein binding
Immunofluorescence - Applications of fluorophores
Important immunochemical technique that utilizes fluorescence-labelled antibodies to detect specific target antigens
Used widely in both scientific research and clinical laboratories
Allows for excellent sensitivity and amplification of signal
Analysis of samples labelled with fluorescence-labelled antibodies must be performed using a fluorescence microscope or other type of fluorescence imaging
Cytogenetics: FISH - Applications of fluorophores
= Fluorescence in situ hybridization
Involves unwinding of the double helix structure and binding of fluorescently labeled DNA probes to specific sequences in sample DNA
The fluorescent probes are nucleic acids labeled with fluorescent groups and can bind to specific DNA or RNA sequences
This allows visualization of where and when a specific DNA sequence exists in cells
Flow cytometry - Applications of fluorophores
Operates on the principles of light scattering, excitation, and emission
Fluorescently tagged cell components are excited when they pass through a laser beam, producing light of different wavelengths
The fluorescence is used to analyze cellular properties such as size, granularity, and protein expression
Fluorescent immunoassay - Applications of fluorophores
Utilizes fluorescent molecules as labels to measure antigen concentrations
Time-resolved immunoassay methods allow overcoming background fluorescence
DNA sequencing - Applications of fluorophores
Fluorescent dyes label nucleotides in sequencing reactions:
red for thymine
green for adenine
blue for cytosine
yellow for guanine
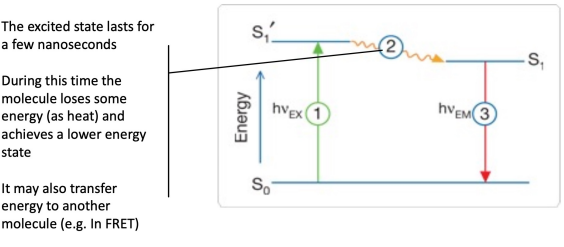
Fluorescence process
Stage 1: Excitation
Stage 2: Excited state lifetime
Stage 3: Fluorescence emission
Stage 1: Excitation
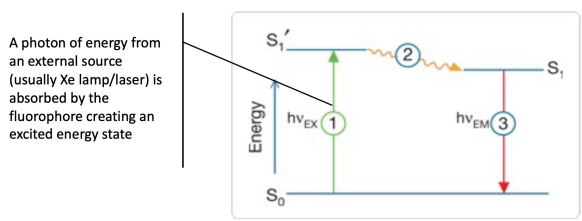
Stage 2: Excited state lifetime