unit 1 STATS
1/145
There's no tags or description
Looks like no tags are added yet.
Name | Mastery | Learn | Test | Matching | Spaced | Call with Kai |
|---|
No analytics yet
Send a link to your students to track their progress
146 Terms
What graphs can be used to summarize data for a single qualitative variable?
bar charts and pie charts (pie charts can only be made if each object can belong to exactly one category)
What graphs can be used to summarize data for a single quantitative variable?
histograms or stem and leaf plots (histogram is the most important one of these..we get box plots in the next chapter)
What graph do we look at to determine the shape of a distribution?
histogram
What 4 common shapes did we discuss?
left-skewed, right-skewed, uniform and bell-shaped
What is the difference between raw data and grouped data?
Raw data is a list with the information recorded for each individual, whereas grouped data has been organized in a frequency table.
What table and graph do we use to organize information collected for two qualitative variables?
contingency table and side-by-side bar chart
What is the distribution of a variable?
a table, graph or formula that shows the possible values of the variable and how often they each occurred.
Given a frequency table, how do you find the class width?
see what number you would need to add down the columns of classes
What does a left-skewed distribution look like?
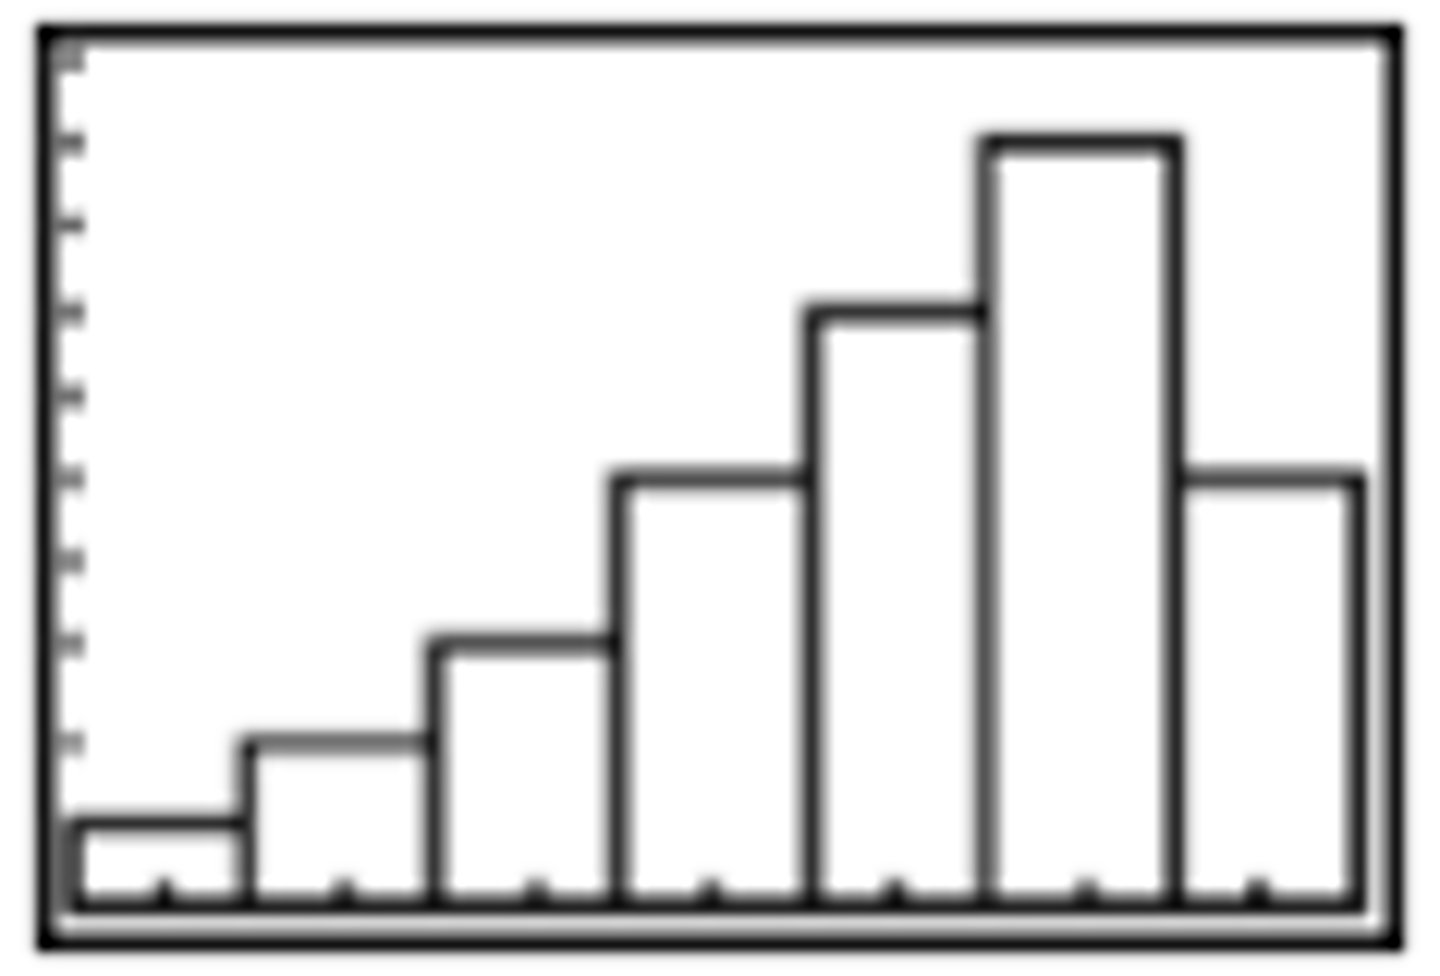
What does a right-skewed distribution look like?
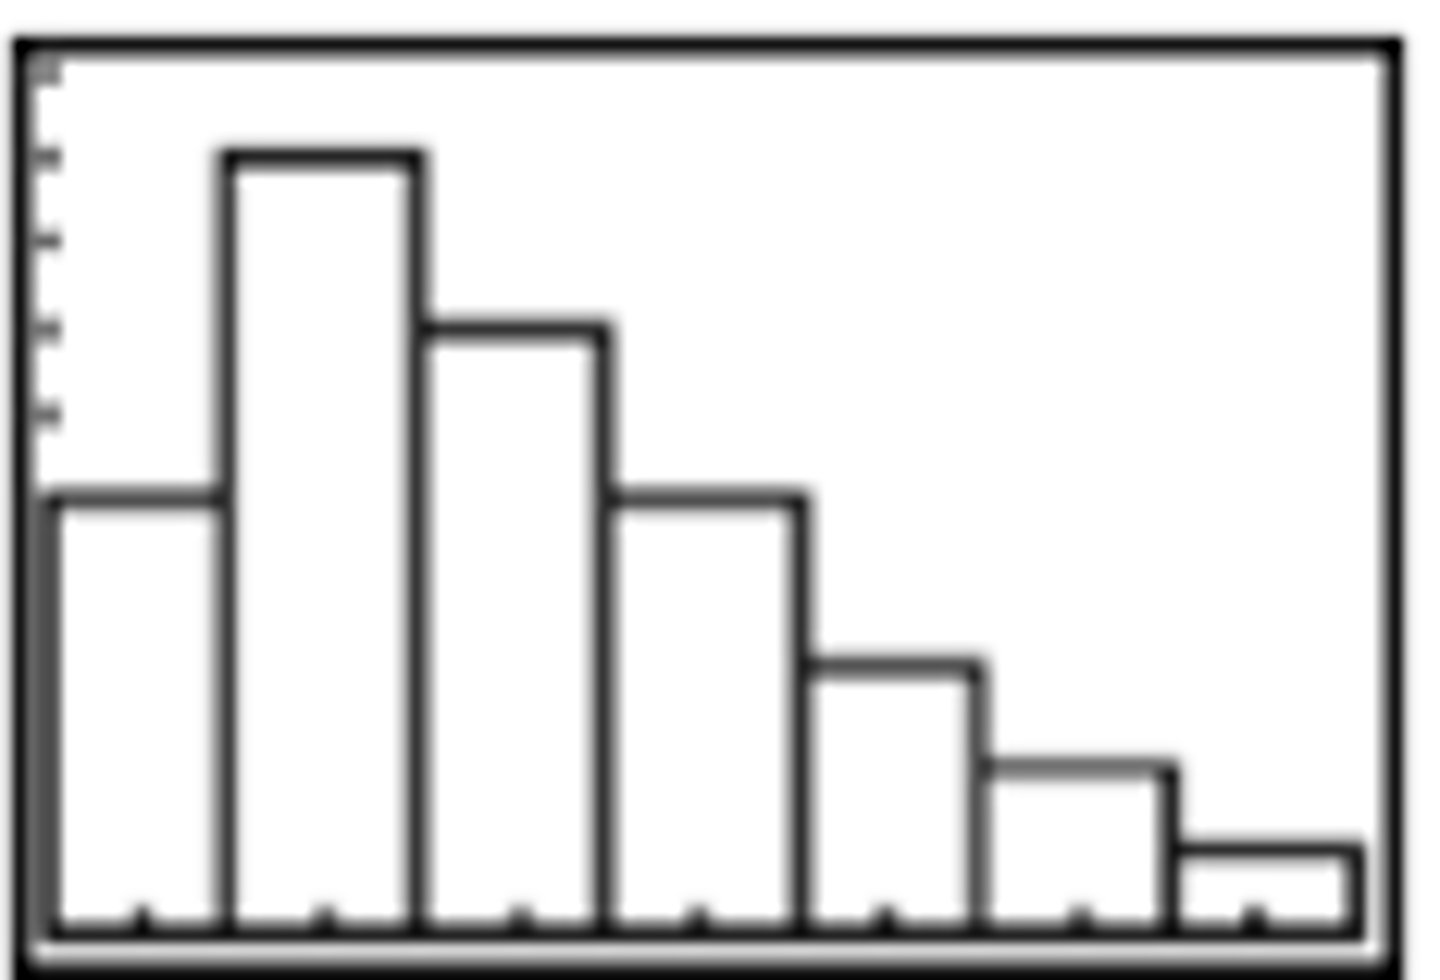
What does a uniform distribution look like?
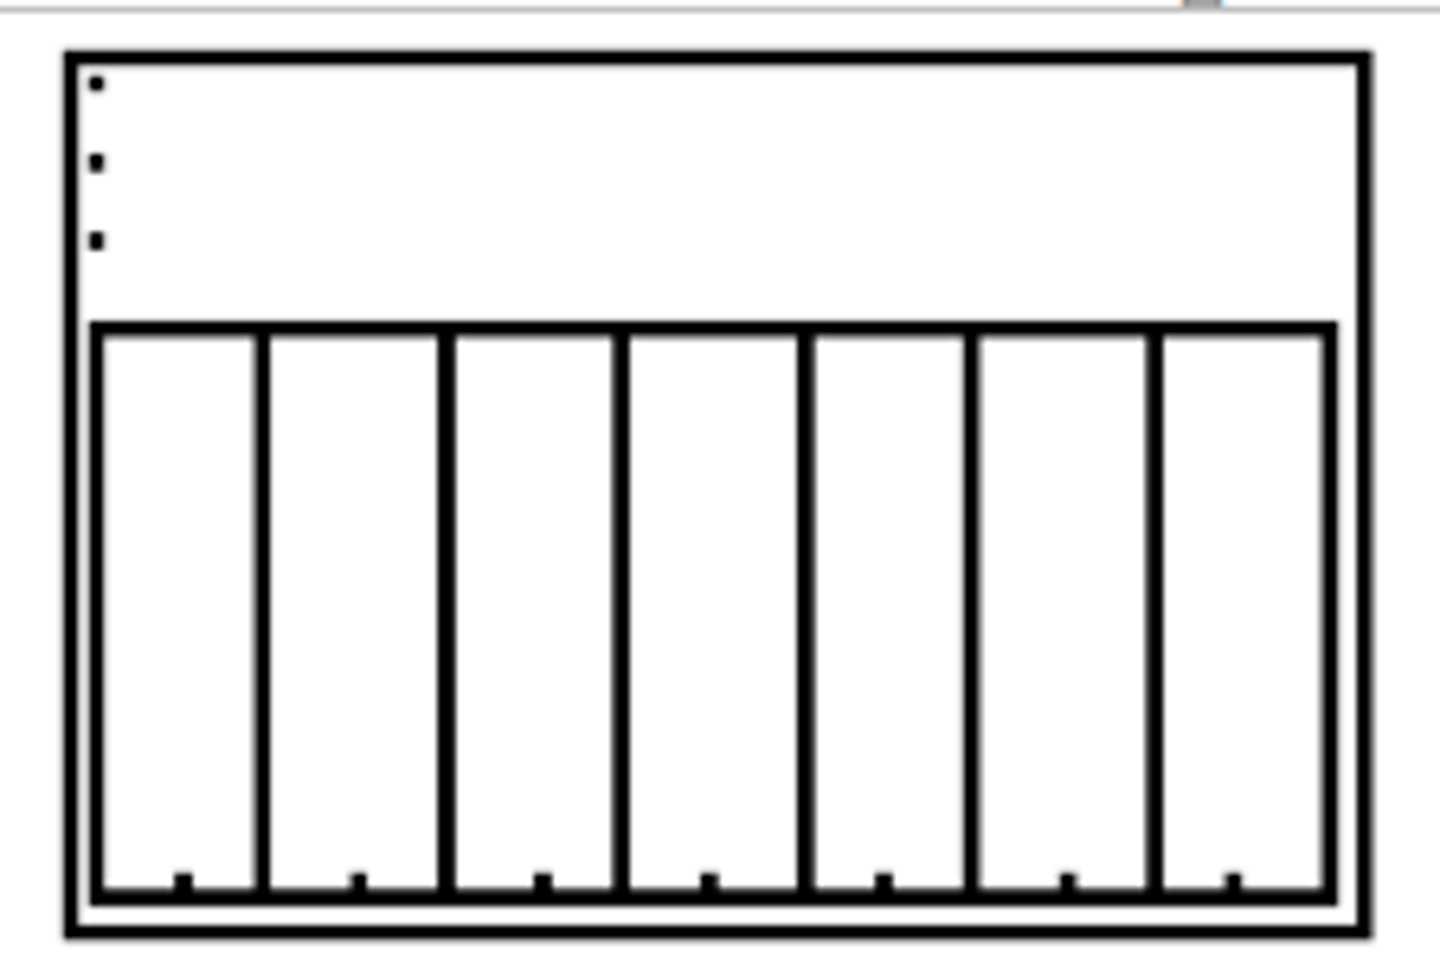
What does a bell-shaped distribution look like?
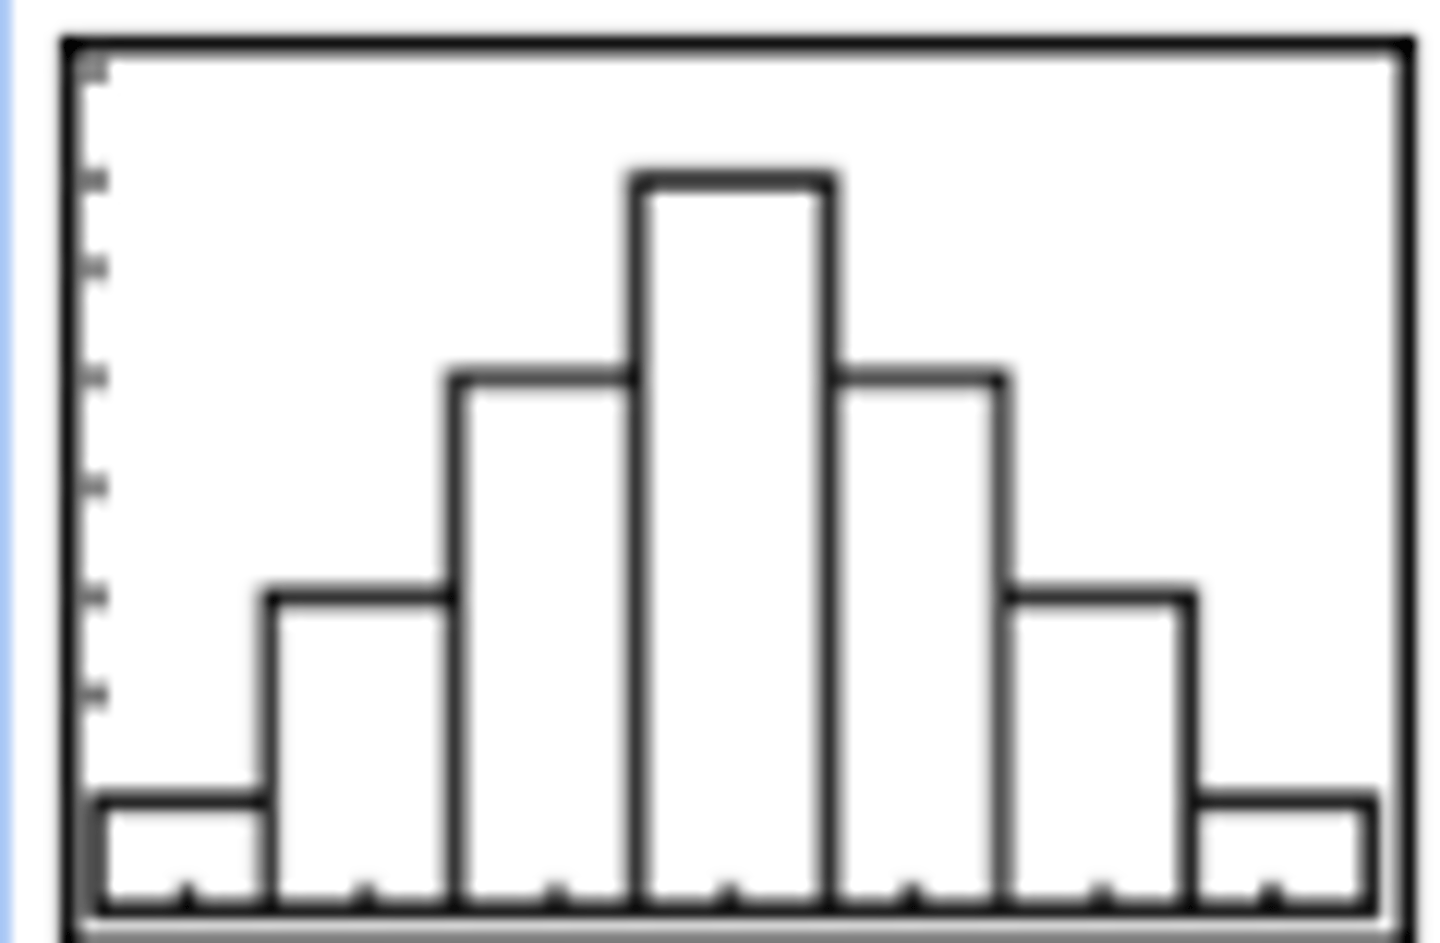
What graph do we look at when we have information for two quantitative variables on each individual?
scatterplot
What does it mean to say a distribution is symmetric?
You can fold the graph in half vertically and get mirror images left to right.
data
information collected from each object in a study
population
the set of all individuals you are interested in studying
individual
one object from the population of interest
sample
the smaller group of objects from the population that we actually collect data for
descriptive statistics
stating facts about or making graphs with the collected data
inferential statistics
using sample results along with probabilities to make educated guesses about the population
parameter
numerical summary of a population
statistic
numerical summary of a sample
Example: We typically summarize qualitative data with the percentage of objects in some category of interest. We typically summarize quantitative data with the average of the numbers collected.
variable
the measurement or observation recorded for each individual
qualitative variable
information collected that places objects into categories
Some examples: eye color, hair color, gender, ethnicity
quantitative variable
numerical information collected that counts or measures something for each object
Some examples: height, weight, number of absences
quantitative-discrete variable
numerical information that counts how many
Some examples: number of credit cards you have, number of siblings you have
quantitative-continuous variable
numerical information that measures how much
Some examples: height, weight, temperature, speed
observational study
A study where someone measures the value of the response variable without attempting to influence the value of either the response or explanatory variable. The researcher simply observes; the researcher does not control the values of either variables.
designed experiment
A study where a researcher assigns the individuals in a study to a certain group, intentionally changes the value of the explanatory variable, and then records the value of the response variable for each group.
conclusion from an observational study
There is (or is not) an association between the explanatory variable and the response variable. For example, there is an association between the increased study time and increased test scores.
conclusion from a designed experiment
Changing the value of the explanatory variable causes a change in the response variable. For example, studying more hours causes a higher test score.
simple random sampling
choosing a sample in such a way that every sample of size n has the same chance of being chosen from a population of N objects.
How can you pick a simple random sample using your calculator if you have a numbered list of objects in the population?
Use randInt(1,N,2n) and then take the first n distinct numbers and then use the numbered list to see what objects these numbers correspond to.
stratified sampling
Sampling where the population is divided into subgroups and a random sample is taken from each subgroup to be included in the sample. (Taking some from all subgroups)
systematic sampling
Sampling where the objects are somehow ordered and then you start with a randomly chosen object and then take every kth object thereafter.
cluster sampling
Sampling where the population is divided into subgroups and whole subgroups are randomly selected to be included in the sample. (Taking all from some subgroups)
convenience sampling
Sampling done where the objects are easy to obtain. "Hey you" sampling.
sampling error
The natural tendency for samples to be different from each other and different from the population from which they were taken.
What is the symbol for sample size?
n
What is the symbol for population size?
N
Give an example of a qualitative variable that has numeric values.
Harper ID number, SSN, jersey number, phone number, etc.
census
a study where information is collected from every individual in the population
What graphs can be used to summarize data for a single qualitative variable?
bar charts and pie charts (pie charts can only be made if each object can belong to exactly one category)
What graphs can be used to summarize data for a single quantitative variable?
histograms or stem and leaf plots (histogram is the most important one of these..we get box plots in the next chapter)
What graph do we look at to determine the shape of a distribution?
histogram
What 4 common shapes did we discuss?
left-skewed, right-skewed, uniform and bell-shaped
What is the difference between raw data and grouped data?
Raw data is a list with the information recorded for each individual, whereas grouped data has been organized in a frequency table.
What table and graph do we use to organize information collected for two qualitative variables?
contingency table and side-by-side bar chart
What is the distribution of a variable?
a table, graph or formula that shows the possible values of the variable and how often they each occurred.
Given a frequency table, how do you find the class width?
see what number you would need to add down the columns of classes
What does a left-skewed distribution look like?
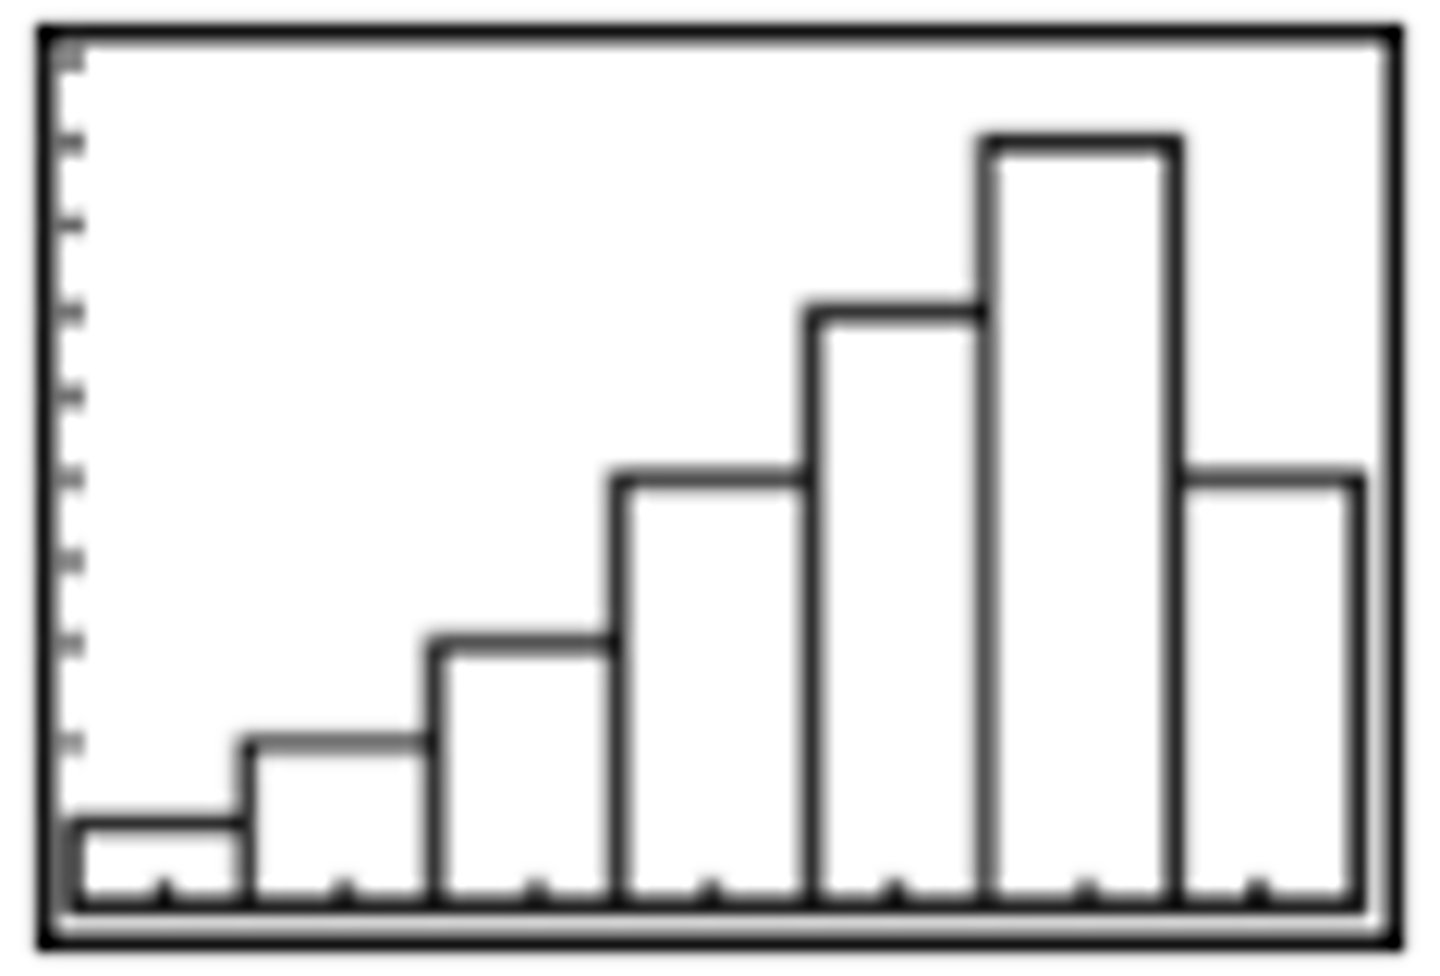
What does a right-skewed distribution look like?
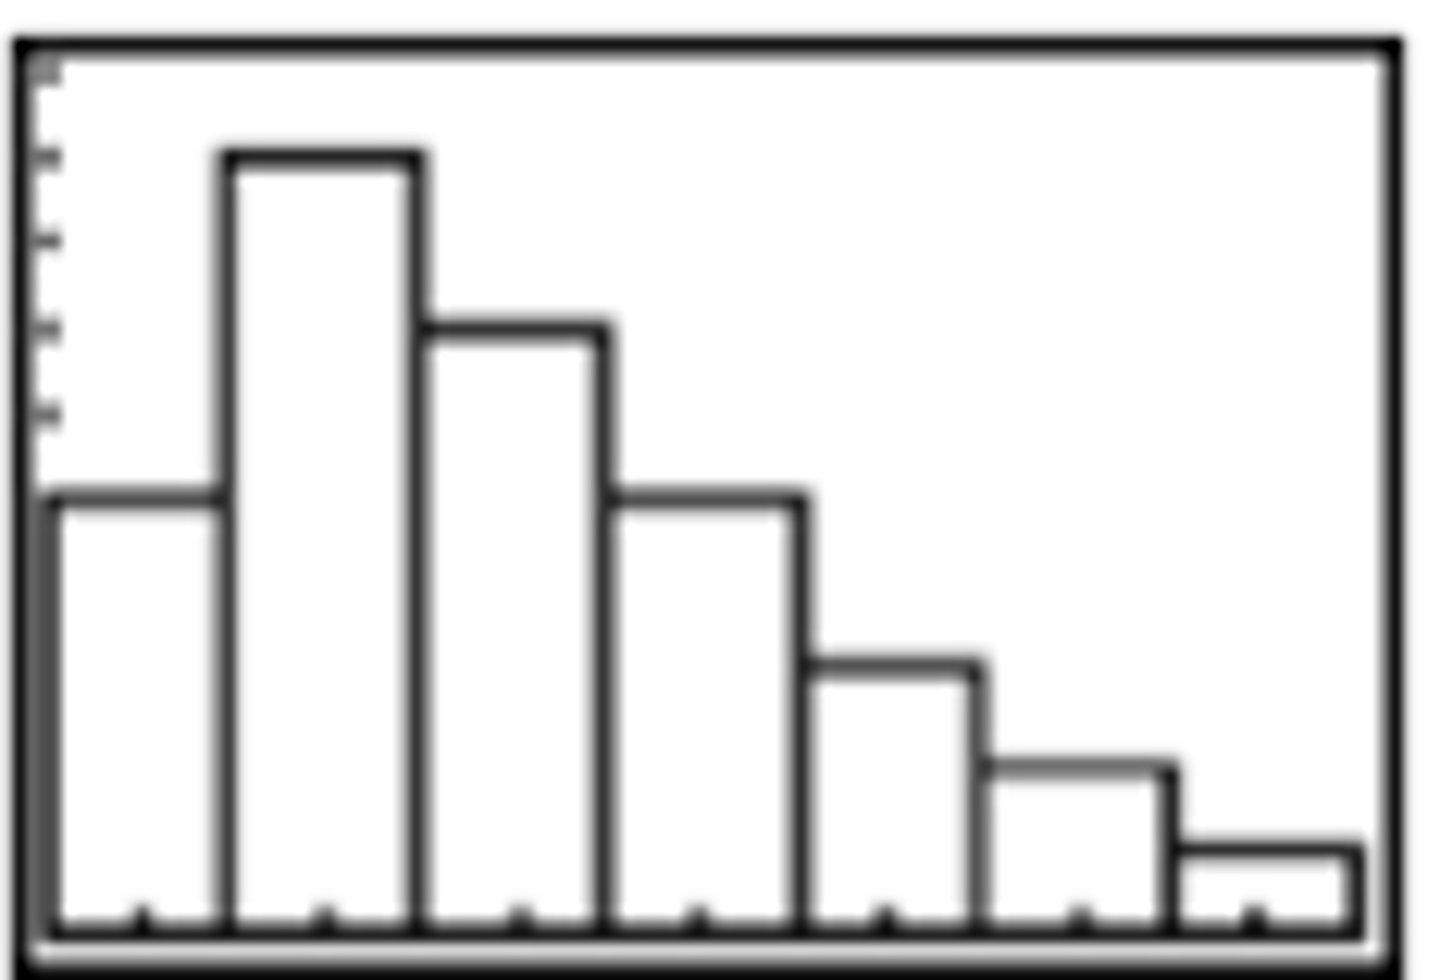
What does a uniform distribution look like?
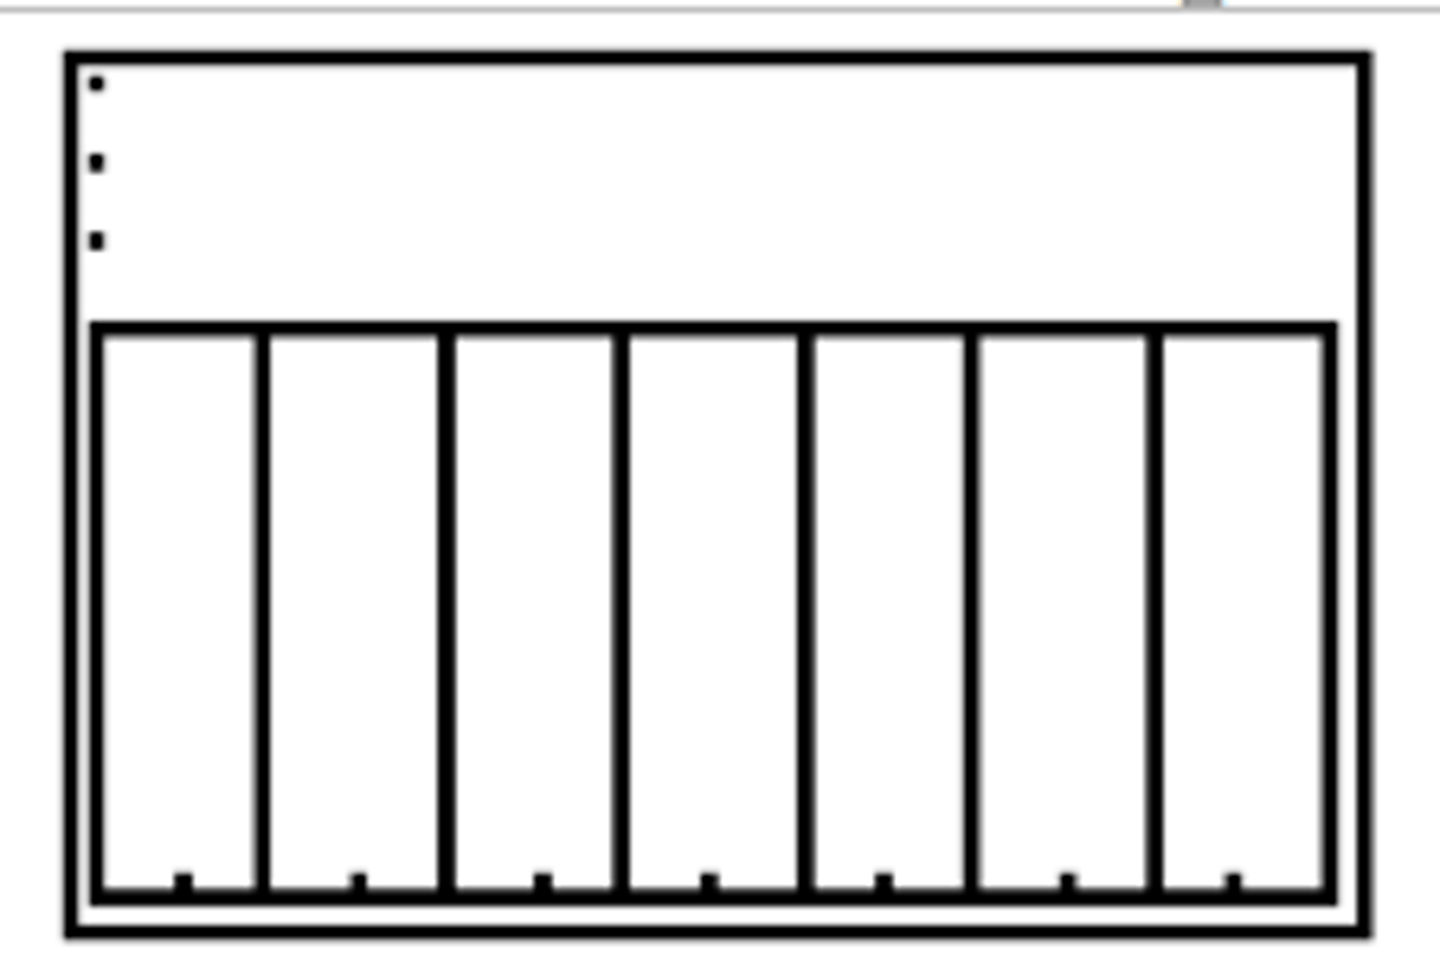
What does a bell-shaped distribution look like?
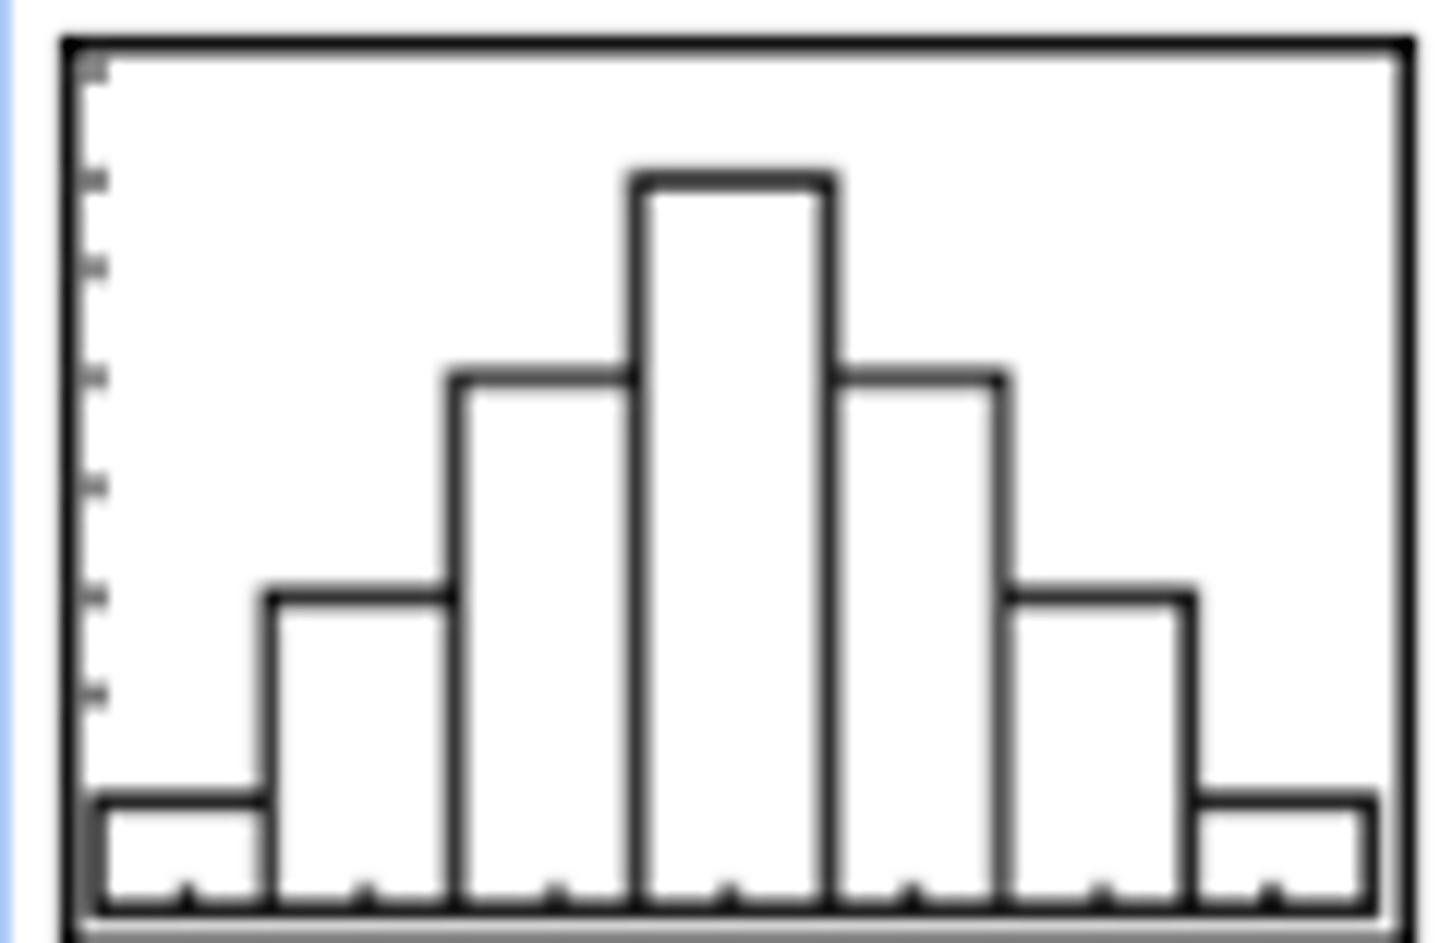
What graph do we look at when we have information for two quantitative variables on each individual?
scatterplot
What does it mean to say a distribution is symmetric?
You can fold the graph in half vertically and get mirror images left to right.
What are the 3 measures of central tendency?
Mean
Median
Mode
What are the 4 measures of variation?
Range
IQR
variance
standard deviation
What are the two measures of position?
z-scores
percentiles (quartiles are special percentiles)
What statistics do we use to summarize data from a symmetric distribution?
mean, standard deviation and from these we can compute a z-score for each data point
What statistics do we use to summarize data from a really skewed distribution or a distribution with outliers?
median, IQR and we can compute a percentile position for each data point
When you are given a small set of raw data, what should your first step be?
Push STAT and enter the data into L1
When asked to compute the summary statistics for a small set of raw data, what should you do?
After entering the data into L1, push STAT right arrow 1 to do 1 var stats on L1
What is the symbol for the sample mean?

What is the symbol for the sample standard deviation?
s
What is the symbol for the sample size?
n
What is the symbol for the population mean?
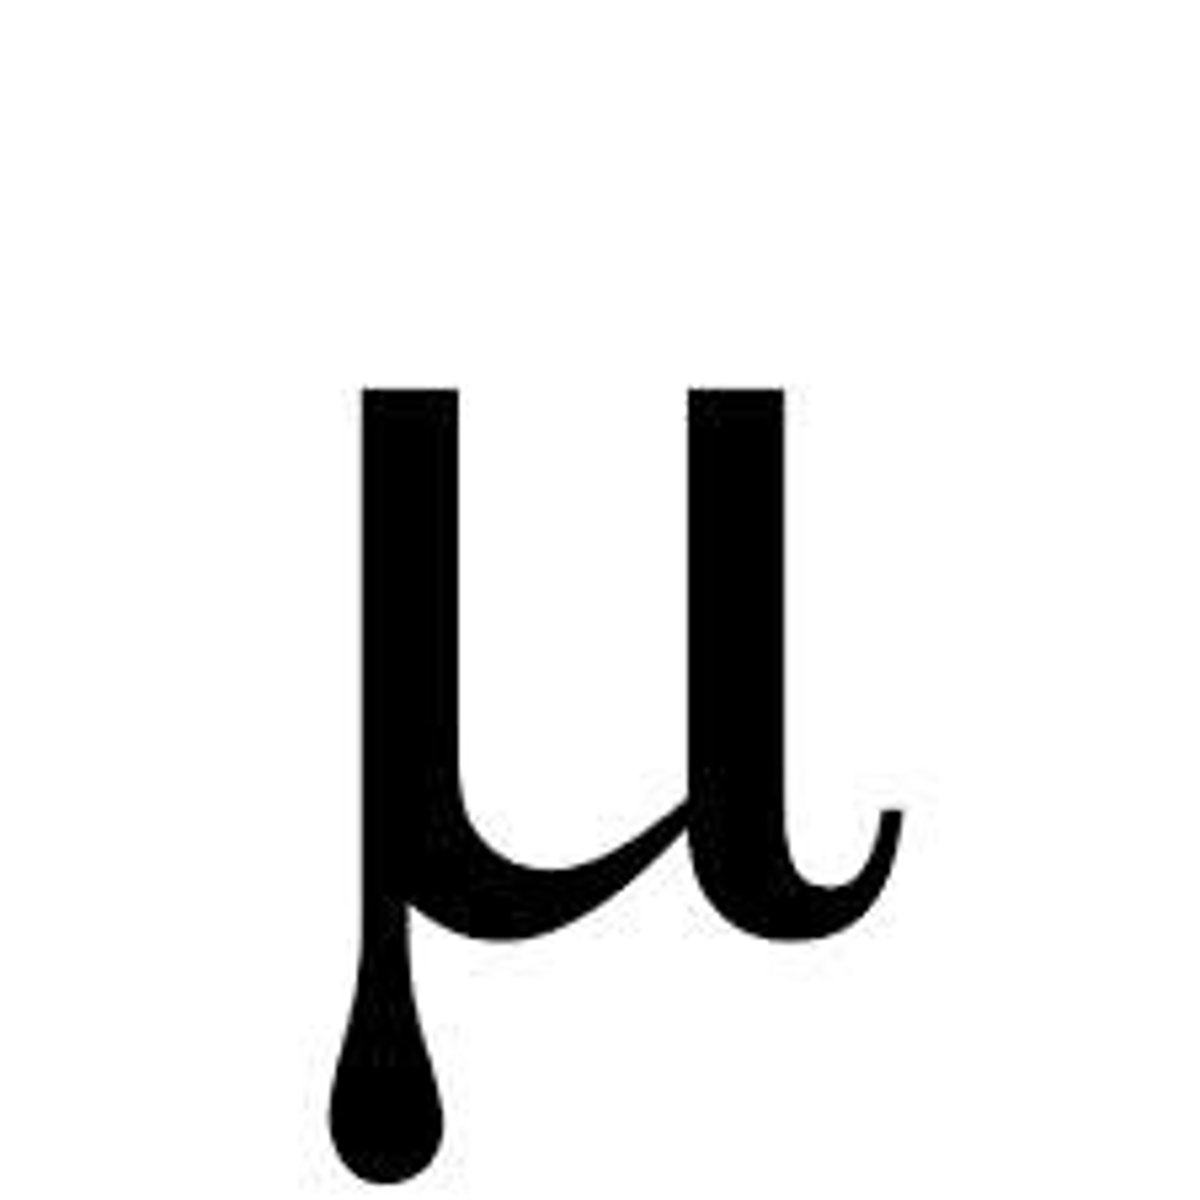
What is the symbol for the population standard deviation?
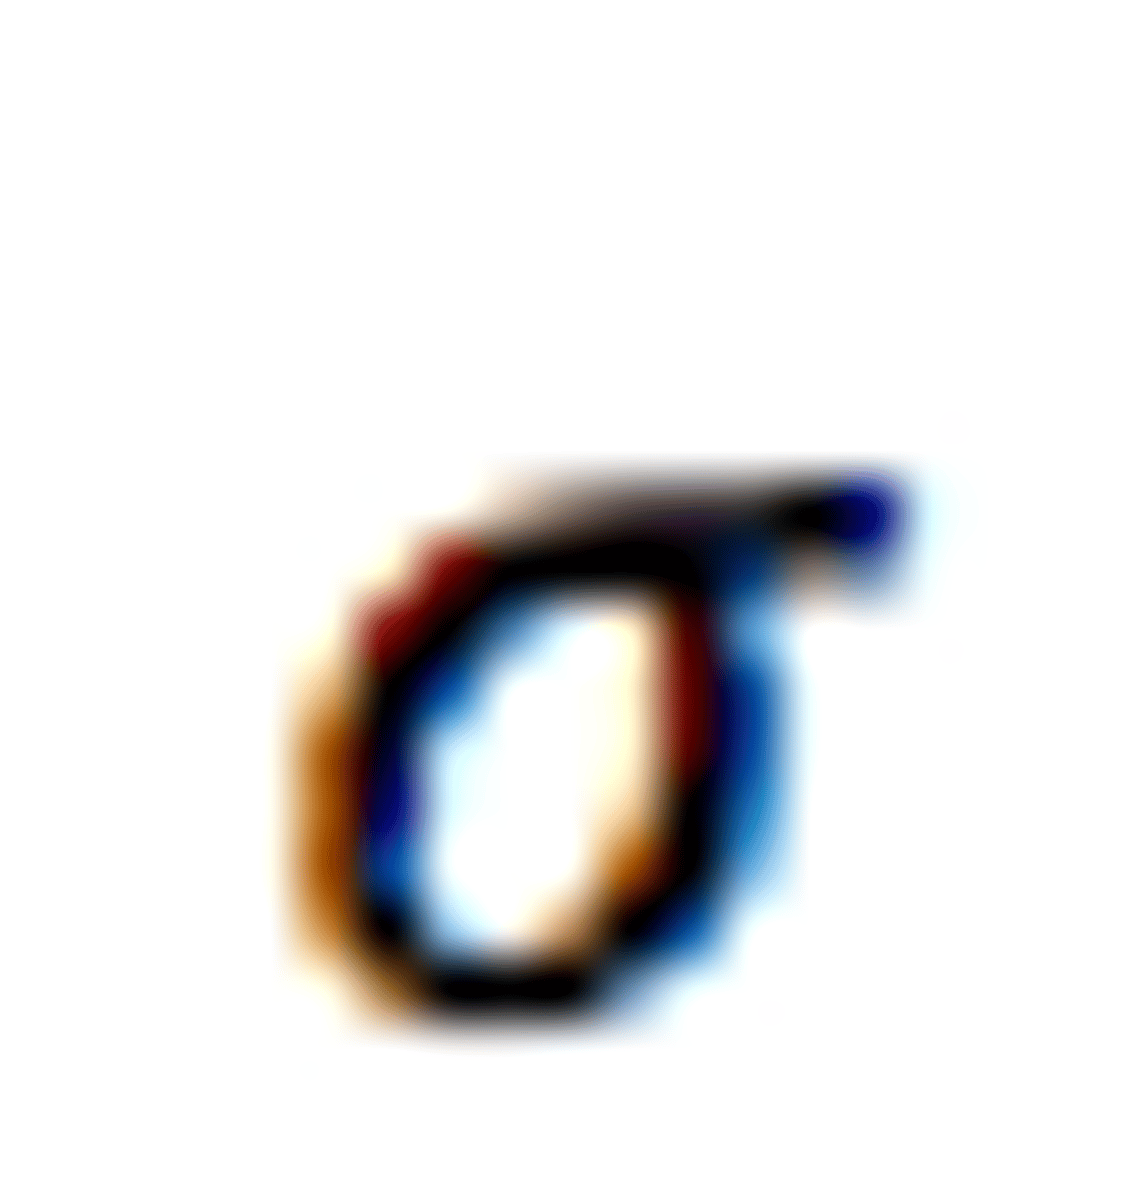
What is the symbol for the population size?
N
What does the mean tell us about a distribution?
The mean is the balancing point of the histogram. This is typically what most people think of as the "average".
What does the median tell us about the distribution?
The median is the middle of the data set. 50% of the data are lower than the median and 50% of the data are higher than the median.
What does the range tell us about the distribution?
How large of an interval of numbers the entire data set covers. How spread out the data set is from the lowest to highest value.
How do you compute the range?
The values of minX and maxX are on the 1 var stats output screen.
Range = maxX minus minX
What does the IQR tell us about the distribution?
How large of an interval of numbers the middle 50% of the data set covers. How spread out the middle 50% of the data set is.
How do you compute the IQR?
The values of Q1 and Q3 are on the 1 var stats output screen.
IQR = Q3 minus Q1
What does the mode tell us about the distribution?
The mode tells us what value occurs the most often in the data set. Be careful NOT to say "most of the data ....."
What does the standard deviation tell us about the distribution?
The standard deviation tells us how far on average individual data points fell from the mean.
If someone has a weight that is in the 70th percentile what does that mean?
70% of people have a weight the same or LESS than this person.
If someone has a height in the 30th percentile, what does that mean?
30% of people have a height the same or LESS than this person.
If someone has a weight that has a corresponding z-score of -2.3, what does that mean?
That person's weight is 2.3 standard deviations below the mean weight. (Do not say -2.3 std devs below the mean)
How do you determine if a data set has any outliers?
There are two ways:
1. Use the formulas to compute the lower and upper fence and see if any data points fall outside of these fences.
2. Make a modified boxplot on your calculator and see if there are any outliers designated beyond the whisker tips.
What 5 numbers make the 5 number summary for a set of data, and how do you compute them?
{minX, Q1, Median, Q3, maxX} these are the last 5 numbers on the output for 1 var stats
How do you compute the sample variance for a set of data using your calculator?
Use 1 var stats and take the UNROUNDED value next to s and square it.
What does it mean for a statistic to be resistant? Which summary statistics are resistant?
If a statistic is resistant, its value does not change much when a data point is made more extreme. The median is a resistant measure of center, the IQR is a resistant measure of variation and percentiles are resistant measures of position.
How do you compute a weighted average using the TI84?
Put the data values in L1 and the corresponding weights in L2 and then do 1-var stats using L1 for "List" and L2 for "Freq"
For any data set, what does Chebyshev's Theorem tell us about what percentage of data are within 2 standard deviations of their mean?
at least 75% (which means it could be anywhere from 75% to 100%)
For any data set, what does Chebyshev's Theorem tell us about what percentage of data are within 3 standard deviations of the their mean?
at least 89% (which means it could be anywhere from 89% to 100%)
What are the 3 measures of central tendency?
Mean
Median
Mode
What are the 4 measures of variation?
Range
IQR
variance
standard deviation
What are the two measures of position?
z-scores
percentiles (quartiles are special percentiles)
What statistics do we use to summarize data from a symmetric distribution?
mean, standard deviation and from these we can compute a z-score for each data point
What statistics do we use to summarize data from a really skewed distribution or a distribution with outliers?
median, IQR and we can compute a percentile position for each data point
When you are given a small set of raw data, what should your first step be?
Push STAT and enter the data into L1
When asked to compute the summary statistics for a small set of raw data, what should you do?
After entering the data into L1, push STAT right arrow 1 to do 1 var stats on L1
What is the symbol for the sample mean?

What is the symbol for the sample standard deviation?
s
What is the symbol for the sample size?
n
What is the symbol for the population mean?
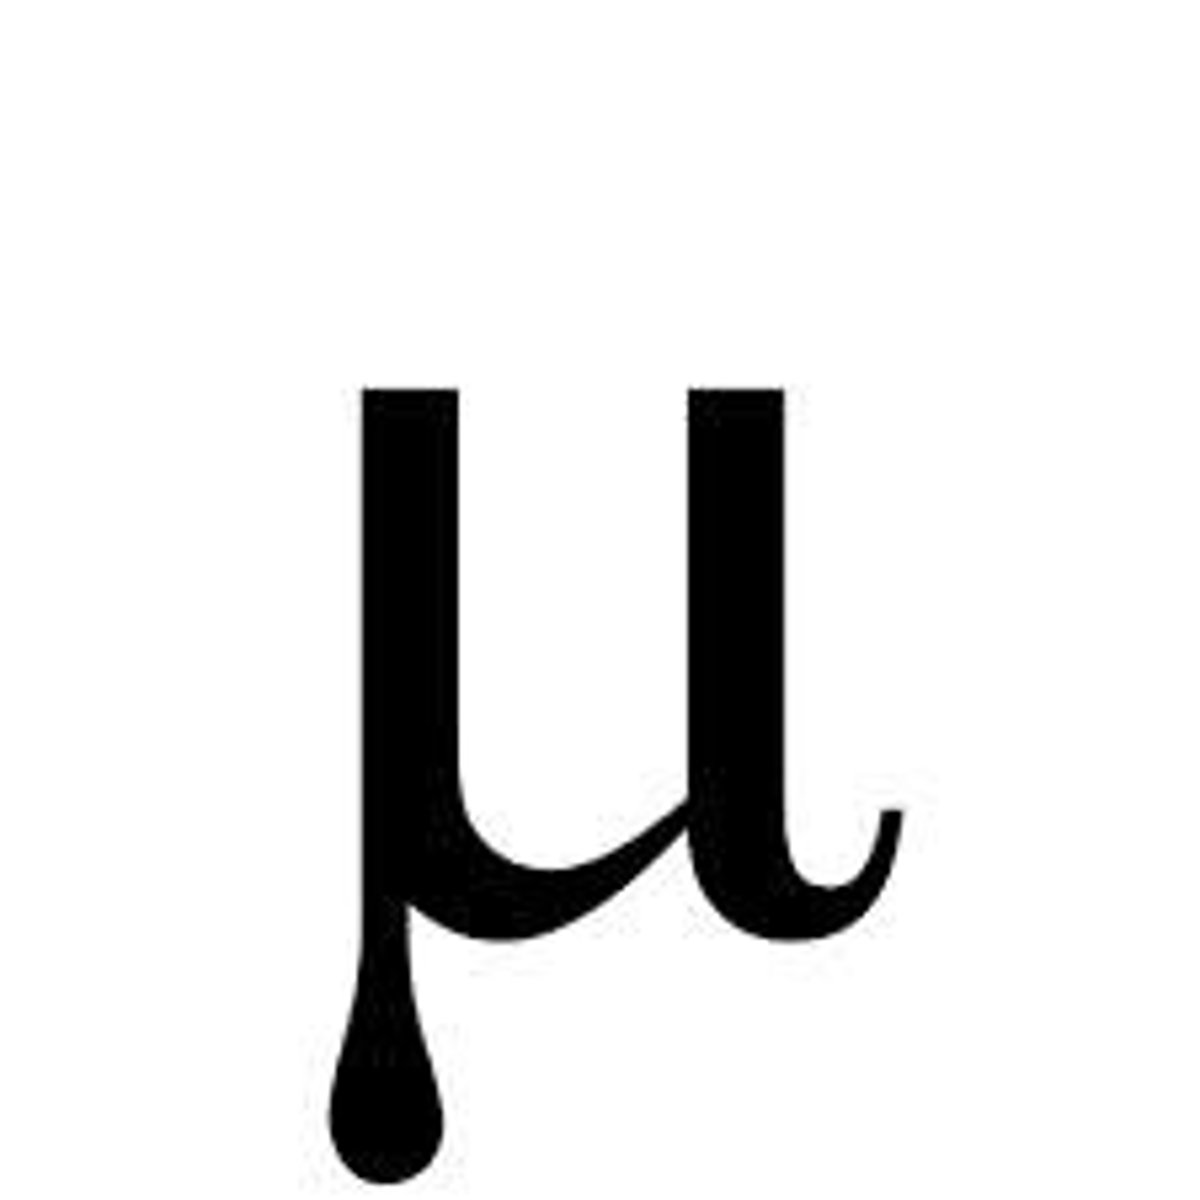
What is the symbol for the population standard deviation?
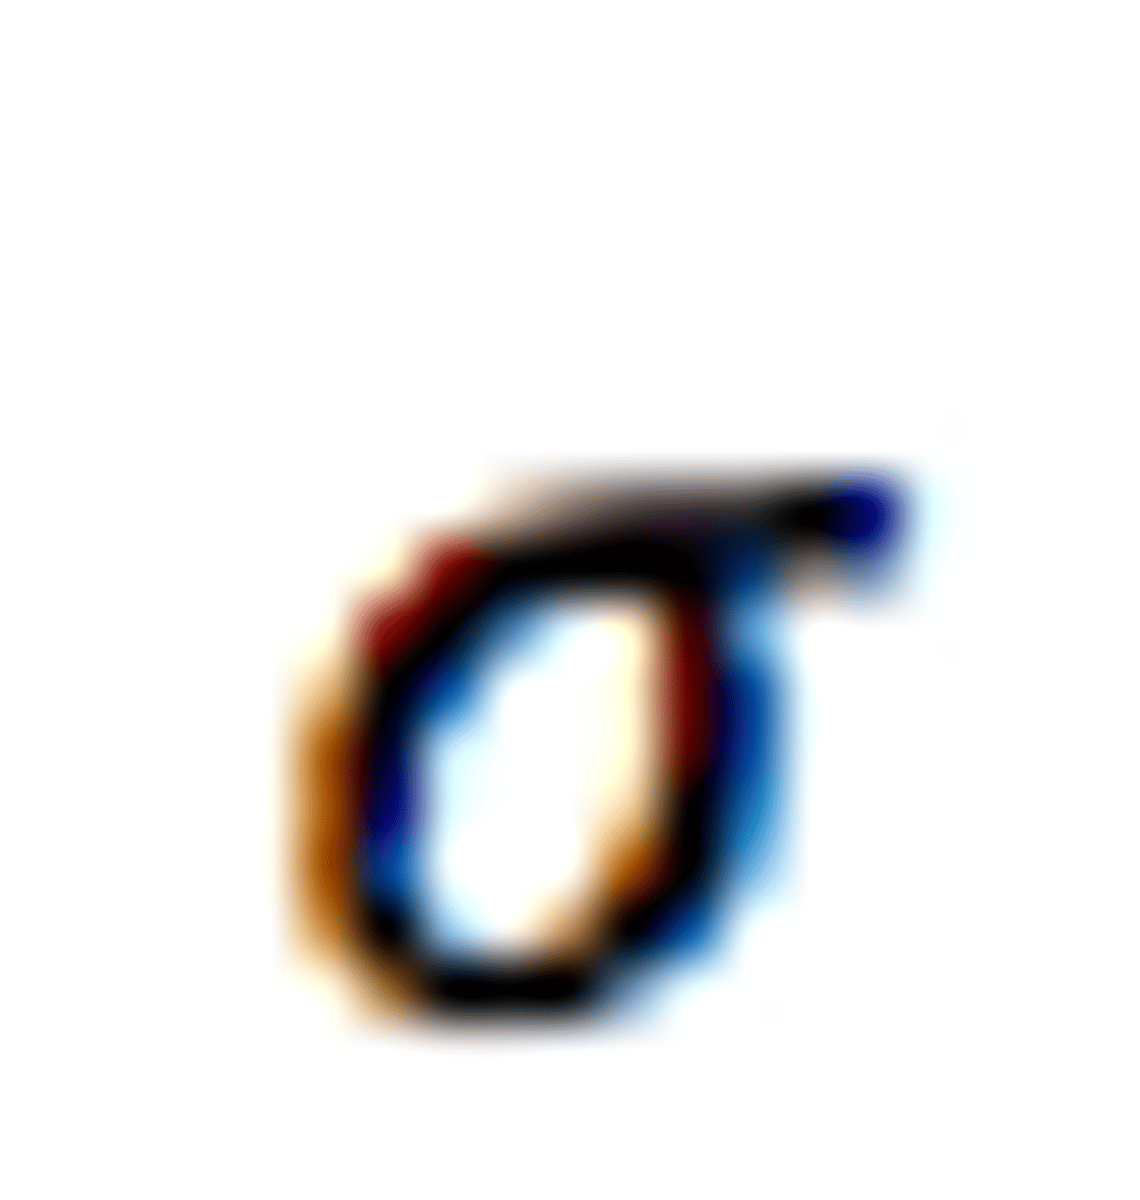
What is the symbol for the population size?
N