Geography IGCSE Paper 2
1/217
Earn XP
Description and Tags
Name | Mastery | Learn | Test | Matching | Spaced | Call with Kai |
|---|
No analytics yet
Send a link to your students to track their progress
218 Terms
Primary sector
Growth/extraction of raw materials
e.g. farming, fishing, mining
Secondary sector
Where materials are processed to produce finished product
e.g. car manufacture, food processing
Tertiary sector
Provision of a service
e.g. retail, schools, healthcare
Quaternary sector
Provision of specialist info/knowledge
e.g. research + development, IT
Clark Fisher Model
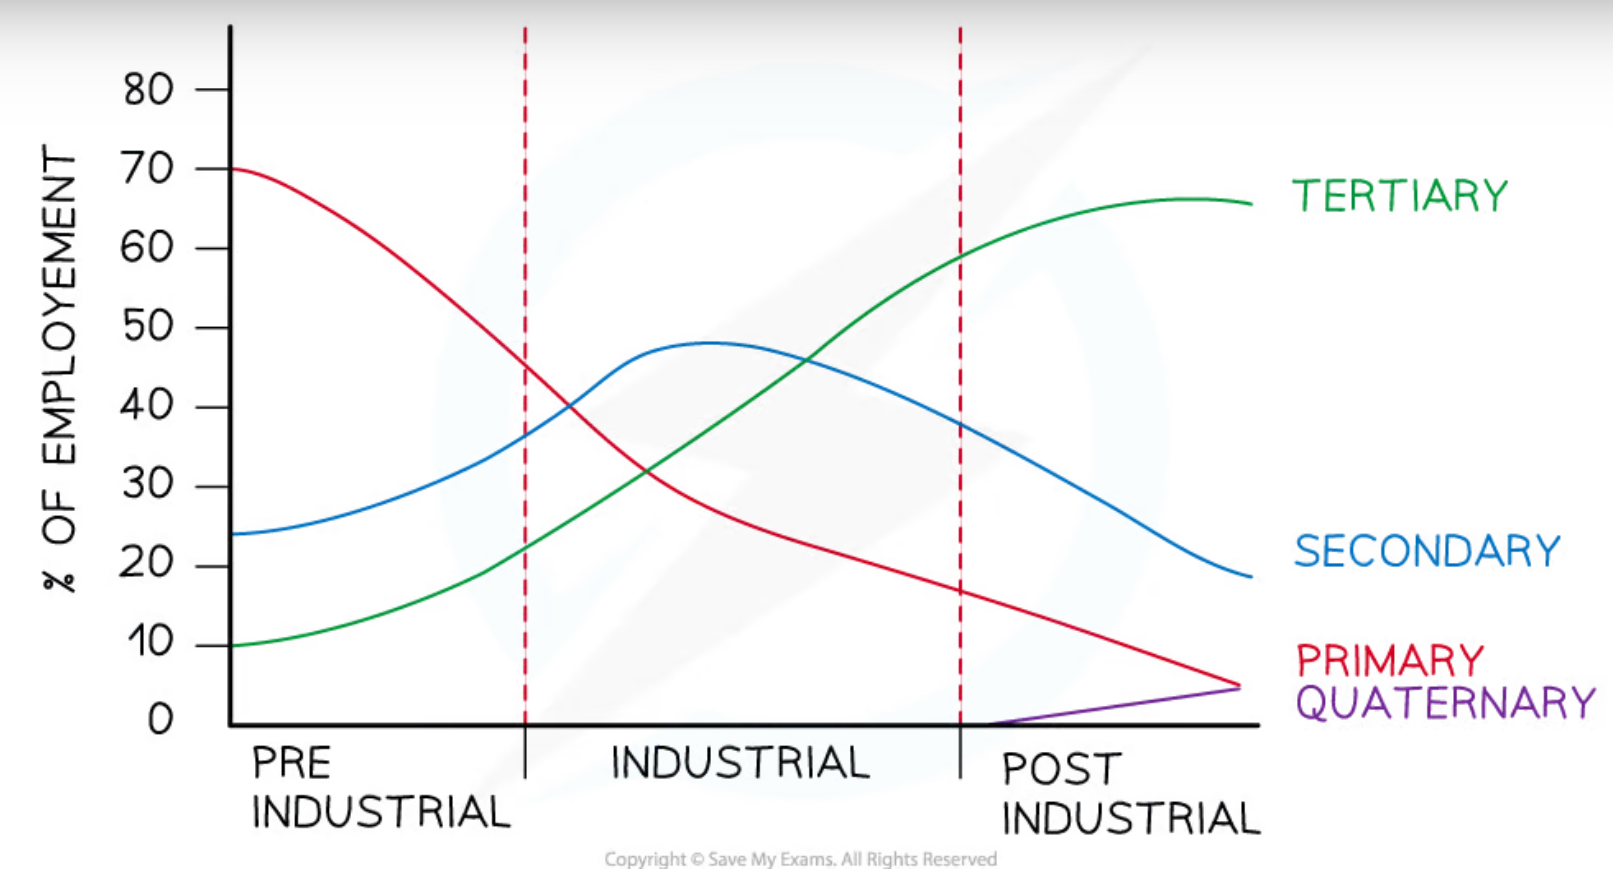
Pre-industrial period
Primary sector dominates
Steady increases in secondary + tertiary sectors
Industrial period
Amount of GDP + employment in secondary sector increases to become dominant, then decreases
Primary sector continues to decrease
Tertiary sector increases
Post-industrial period
Tertiary + quaternary sectors increase
Secondary + primary decrease
Tertiary sector dominates employment + GDP
Employment structure in developed countries
Usually more people working in tertiary/quaternary sectors than primary and secondary
Employment structure in developing countries
Usually more people working in primary sector than secondary/tertiary sectors
Causes of changes in employment structure
Increasing mechanisation in agriculture → decrease in jobs available in primary
People move to urban areas to find jobs in secondary + tertiary sectors
Increasing mechanisation + global changes lead to decrease in secondary employment in some countries
Tech improvements lead to increase in tertiary + quaternary employment
Physical factors influencing location of economic sectors
Raw materials - industries require raw materials to produce goods
Land - cost of land + how much is available
Energy - where industries get power supply from
Climate - some industries benefit from particular climates
Human factors influencing location of economic sectors
Capital - money available to set up + run economic activity
Transport + communications - accessibility by road, air and rail is important to many industries
Market - how close industries are to market
Labour - all industries need workers
Govt. policy - tax incentives, cheaper rent
Factors affecting location of primary activities
Climate (mainly agriculture) - precipitation, sunshine hours and temp affect type of crops grown or livestock
Land - amount of land available, cost, soil type, resources (coal, gold)
Market (mainly mining) - distance from market + transport cost particularly important for mining due to bulky products
Govt. policies - whether subsidies are available
Labour - in developed countries, few workers needed due to mechanisation
Transport - access to roads to transport crops, animals, quarried/mined materials, timber
Factors affecting location of secondary activities
Raw materials - how close the activity needs to be to raw materials + types of raw materials depends on the industry
Land - large areas of land often required, so cost + amount of land important - car manufacture needs more space than food processing/clothing production
Market - access to market is important to be able to sell goods
Govt. policies - tax incentives, grants, loans may be available if economic activity is located in particular area
Energy - power source needed, used to be coal/water but is now electricity, which can be accessed in many areas
Labour - mechanisation means not as many workers required
Transport - access to roads essential to bring in raw materials + send out product - heavier, bulkier products have higher transport cost
Factors affecting location of tertiary activities
Land - amount of land depends on type of economic activity, large retail parks need lots of land
Market - needs to be close to customers
Energy - power source is needed, electricity can be accessed in many areas
Labour - workers needed, both skilled + unskilled
Transport - needs to be accessible for customers, workers and in case of retail, to bring in products
Factors affecting location of quaternary activities
Land - science parks need large areas usually near a university on rural-urban fringe; needs to be near skilled workers + universities; pleasant working environment
Energy - power source needed, electricity can be accessed in many areas
Labour - skilled labour needed, often uni graduates
Transport - needs to be accessible to workers
How location of secondary activities has changed
Transport is faster + cheaper so products can be moved around the world
Increase in transnational corporations (TNCs) with factories + offices in many countries
Factories were once tied to power source of coal/water - electricity now available almost anywhere
Internet means instant communication with factories/offices around the world is possible
Govt. policies in developing countries are aimed at attracting manufacturing often using tax incentives
Cheaper labour, less strict health and safety, cheaper land and more workers are available in developing countries - reduces costs + increases profits
Raw materials may no longer be available in the area
Deindustrialisation
Reduction of secondary economic activities (manufacturing)
How location of tertiary/quaternary activities has changed
Increasingly located in rural (greenfield) areas on rural-urban fringe due to number of factors:
More open space for expansion + car parking
Cheaper land
More accessible
Located near suburbs + commuter village - good access for workers + customers
Increase in science, business and retail parks where similar businesses are located together
Decentralisation
The relocation of economic activities to rural areas on rural-urban fringe
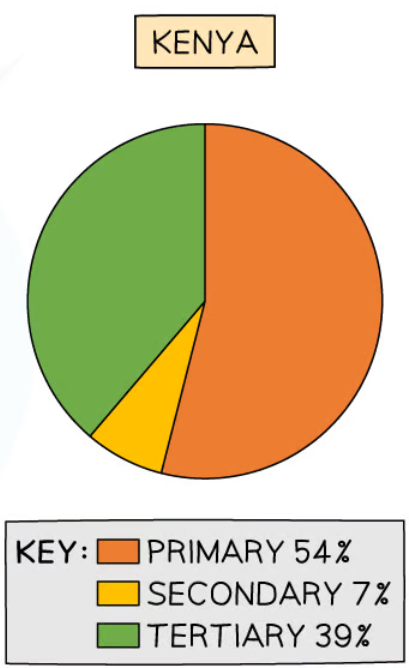
In developing countries, more people are employed in ____ sector because…
Primary
Often a significant % of rural population are subsistence farmers
Countries depend on raw material exports to developed countries
e.g. Kenya
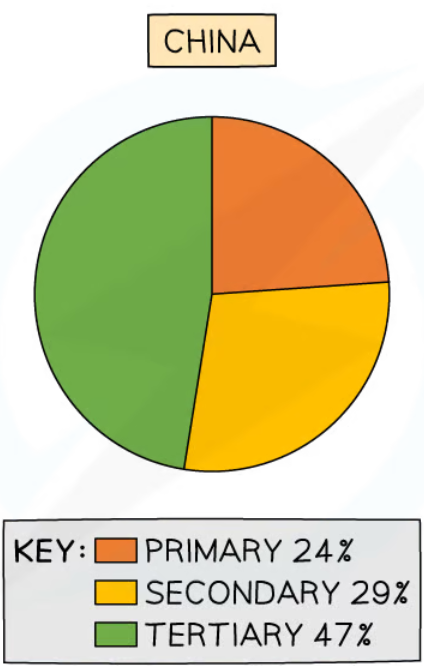
In emerging countries, dependence on ____ economic activity increases because…
Secondary
Factories are located in emerging countries due to lower costs
More raw materials may be available
Govt. policies aim to attract companies to locate there
e.g. China
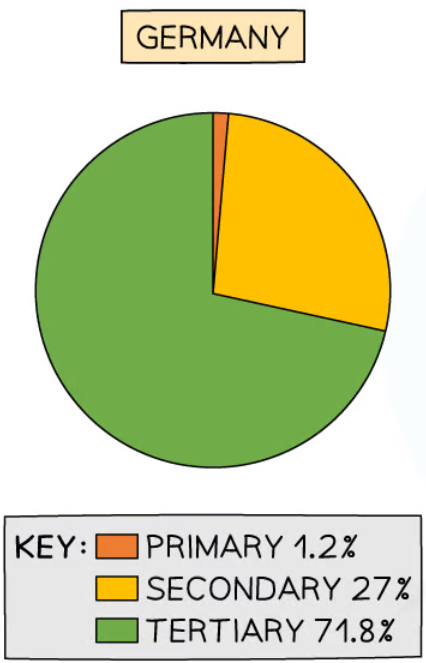
In developed countries, there is dependence on ____ economic activities because…
Tertiary
Education levels are higher so people want tertiary sector jobs - higher paid (on avg.) than secondary + primary jobs
Deindustrialisation means fewer jobs in secondary economic activities
Mechanisation means fewer jobs in primary + secondary economic activities
e.g. Germany
Factors affecting no. of people employed in each sector
Availability of raw materials
Globalisation
Technology
Demographic changes
Govt. policies
How availability of raw materials affects no. of people employed in each sector
Raw materials may have run out or be economically unviable to obtain
Crop production + livestock may be reduced due to drought, flood, pest/disease, soil erosion
Improvements in tech may reduce amounts of raw materials needed
How globalisation affects no. of people employed in each sector
Transnational corporations (TNCs) have factories + offices in many countries
Lower costs tend to be in developing + emerging countries
Internet + improved communication mean that service activities such as call centres can be located anywhere in the world
Industries such as textiles and steel manufacturing are increasingly located in emerging countries
How technology affects no. of people employed in each sector
Fewer jobs in farming, mining and many factories due to mechanisation
Internet means companies can manage factories + offices located in different countries
Improvements in transport have reduced friction of distance
How demographic changes affect no. of people employed in each sector
Increasing population means greater demand for products + services
People have more disposable income to spend on leisure and other services
Demand for goods + services is affected by age structure of population
Increasing population means more workers available
How govt. policies affect no. of people employed in each sector
Govt. policies target particular economic activities to locate in their country using tax incentives, infrastructure improvements (new railways, airports) and grants/cheap rent
Sector shift in developed country (UK)
UK in post-industrial stage of Clark-Fisher model
First country to experience Industrial Revolution
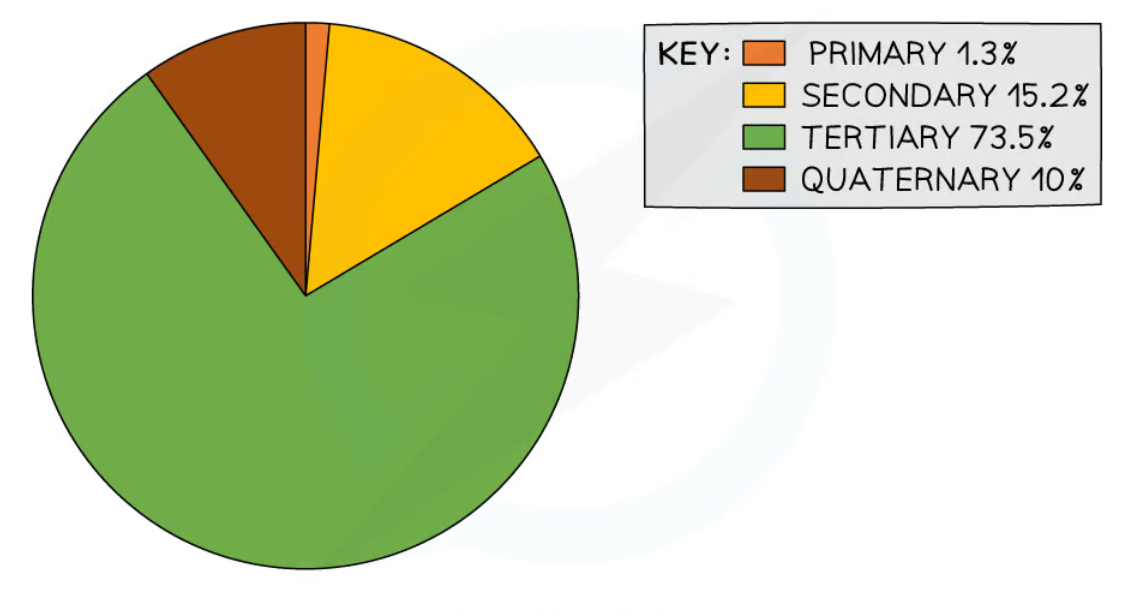
In 1800s, most jobs in primary economic activities were rapidly declining, reaching 15% in 1900
In 1900, most people (over 60%) worked in secondary economic activities + tertiary activities were steadily increasing
In 1950s, tertiary economic activities overtook secondary activities as main employment sector
In 2021, over 70% of people in UK are employed in tertiary activities
Positive impacts of sector shift in developed country (UK)
Deindustrialisation → environment improvement + decreased pollution levels
UK has developed expertise in secondary + tertiary activities which are in demand around the world
London is 2nd most important financial centre in the world after NYC
Negative impacts of sector shift in developed country (UK)
Deindustrialisation led to high number of job losses, particularly in north of UK
Job losses in secondary industries led to large areas of deprivation, especially in inner cities, such as Liverpool and Leeds
Increasing numbers of transnational corporations (TNCs) have moved factories & offices to emerging + developing countries
Sector shift in developing country (Kenya)
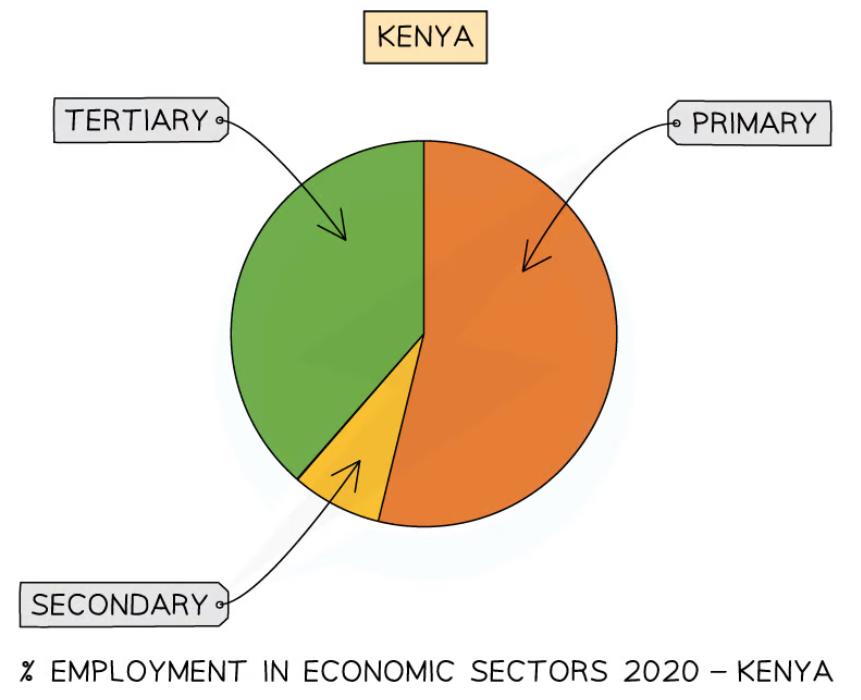
Kenya is in pre-industrial stage of Clark-Fisher model
Over 50% of population are currently employed in agriculture - decreased from over 60% in 2010
Very little secondary activity due to lack of resources + infrastructure
Tertiary activities have rapidly increased - mostly related to tourism
Positive impacts of sector shift in developing country (Kenya)
Improved incomes + higher standard of living
More investment in education + health
Increased investment by transnational corporations (TNCs)
Investment in roads, airports, ports and other infrastructure
Negative impacts of sector shift in developing country (Kenya)
Increased rural-urban migration, leading to development of informal settlements
Increased gap between rich and poor, particularly gap between wealthier urban residents + poorer urban residents
Most of profits from commercial farming + tourism go to TNCs rather than locals
Jobs in tertiary sector are often low-paid jobs in tourism
Increased tourism can have negative impacts on environment + animal habitats
Informal employment
Any employment which is unregulated + unofficial
Estimated that over 60% of world’s employed population work in informal employment
Estimated 93% of informal employment is in developing + emerging countries
Most informal employment is work in tertiary sector
Examples of jobs in informal economy
Shoe shining
Rubbish collecting
Selling fruit or other products on the street
Para-transit - inc. rickshaws, tuk tuks
Causes of informal employment
People want to avoid paying taxes
High levels of rural-urban migration - more people than jobs available
Employers want to avoid paying holiday and sick pay
Low wages mean people need additional jobs to make enough money
People need flexible hours to fit around their family
Lack of qualifications/education means people can’t get work in formal sector
Impacts of informal employment
People working in informal economy:
Have no healthcare benefits
Are often exposed to health/safety risks
Have no contracts or guaranteed pay
Have no holiday/sick pay
Para transit often causes congestion and if motorised, they cause additional pollution
Lack of regulations means workers are often exploited by employers
Many children working in informal employment can’t go to school
Children may be exposed to health risks, drugs, violence, crime
Govts. collect less tax because jobs are unofficial
Informal employment in Dhaka
Capital of Bangladesh
Megacity - 22.5m population
Approx. 400,000 people migrate to Dhaka each year
Estimates suggest thar over 75% of population are engaged in informal employment:
500,000 rickshaw drivers
80,000 waste-related workers
Workers in small workshops
Casual workers in restaurants + hotels
Day labourers in construction
Informal employments also include children, with over 690,000 children in Dhaka involved in informal employment
Many of Dhaka’s informal workers live in informal settlements
Characteristics of Dhaka’s informal sector
Low pay
Long working hours
Temporary/part-time work
Underemployment
No benefits such as holiday/sick pay
Poor + unhealthy working conditions
Health + safety risks
No training
Exploitation by employers
No legal protection
Relationship between population & resources
Economic activities involve use of resources + energy
Rate at which resources + energy are used depends on:
Pop. size
Rate of development
Many resources inc. energy sources are finite and non-renewable
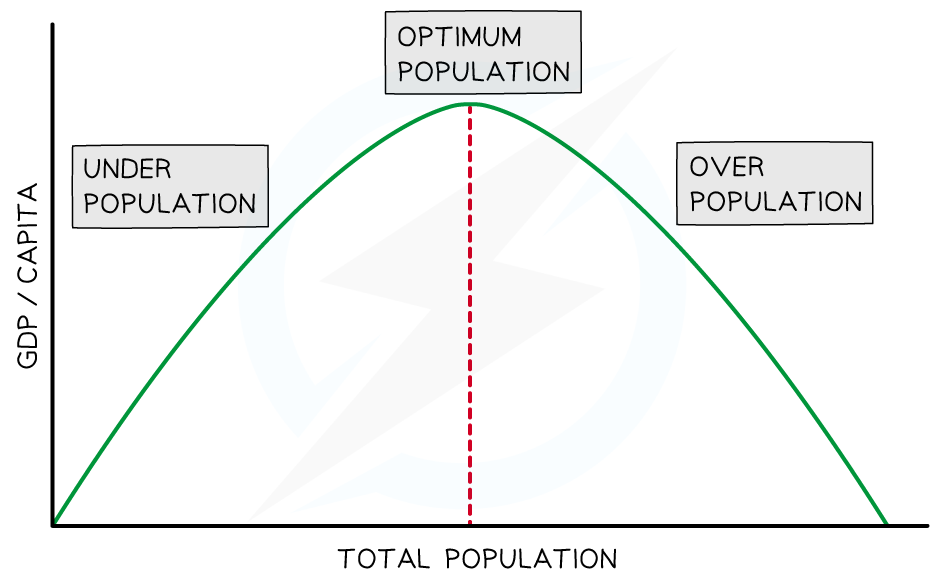
Each country/area has carrying capacity
Carrying capacity
The population an area’s resources can sustain
Optimum population
Results in highest standard of living
Not so many people or so few resources that standard of living falls
Enough people to develop resources of country
Underpopulation
Population too small to develop resources effectively
Overpopulation
Too many people / too few resources to ensure high standard of living
Population pressure
Occurs when population > carrying capacity
Malthus theory
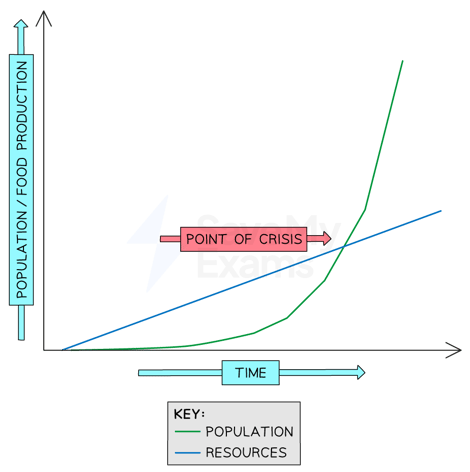
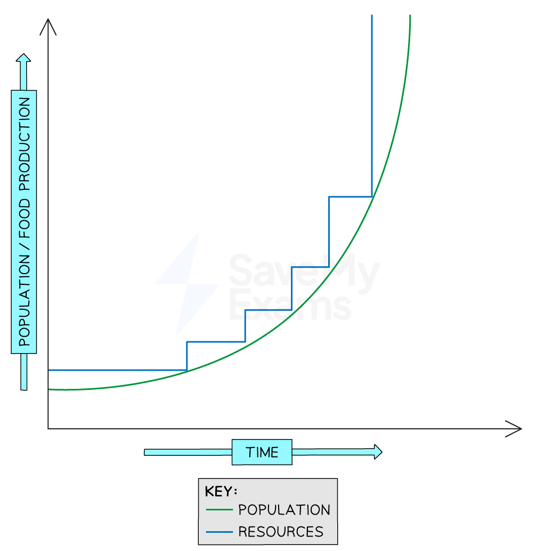
Pessimistic view on relationship between pop. & resources, stating:
Pop. growth increasing at faster rate than food supply
There will be time when there’s insufficient food to sustain population
As a result, pop. growth will stop as result of Malthusian catastrophe - famine, disease, war
Known as positive checks as they increase death rate
Preventative checks are factors decreasing birth rate
Limiting factors maintain balance between pop. & resources
Were Malthus’s predictions correct?
Incorrect as they came before tech developments that enable increased food supply
Neo-Malthusians
Argue that:
We have now used most of available agricultural land
Amount of fertile land declining
Food prices increasing
Pop. continues increasing
They suggest that famines are one example of how Malthusian theory was correct
Argue that pop. control is essential to avoid Malthusian catastrophe
Boserup theory
Optimistic view of relationship between pop. & resources, stating:
Pop. growth will stimulate tech developments to increase food production
More efficient resources will be discovered/used
Renewable resources will replace non-renewable
How pop. growth + development cause increased energy demand
Higher demand for food → more intensive farming which requires more energy for machines, light, heat
Increasing industry → requires energy for heating, lighting, machinery
More transport → requires energy in form of petrol, diesel, electricity
Urbanisation increases with development → increases domestic appliances, heating, lighting
Increased wealth → people buy more appliances and tech which require energy
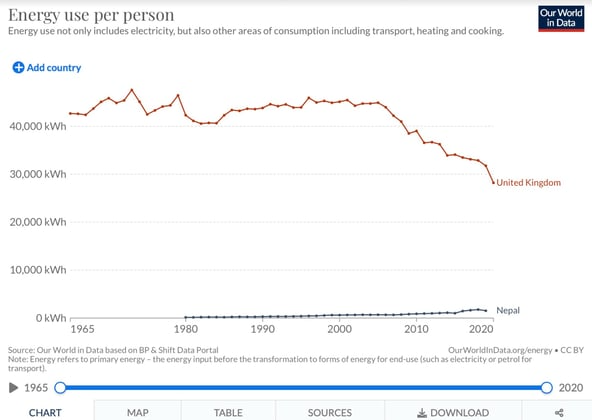
Countries with highest energy consumption (per person)
Usually developed countries
Canada
Norway
Saudi Arabia
Countries with lowest energy consumption (per person)
Developing countries, all in Africa
Niger
Chad
Tanzania
Energy mix
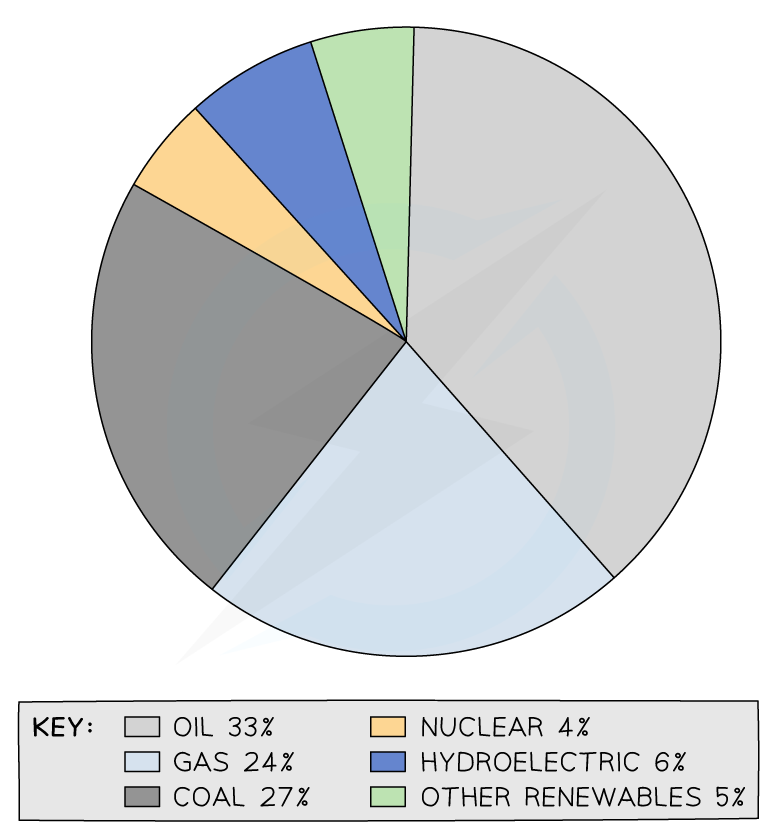
Percentage contribution of each energy source to total energy consumption
Global energy mix
Main energy sources are fossil fuels - supply 84% of world’s primary energy
Renewables increasing - only 11% of energy mix
Nuclear - 4% of primary energy
Energy production
Energy sources not evenly distributed across world
Some areas produce very little energy due to lack of natural resources / don’t have money to exploit resources
Fossil fuels are main energy sources
World’s largest producers are often largest consumers
Countries producing most fossil fuels
USA
Canada
Norway
Russia
Australia
Middle East
Energy gap
When country can’t meet demand for energy using its own resources
When countries have energy gap, have to import energy to meet demand
Energy security
Having energy gap means country isn’t energy secure
To be eneergy secure, country must have:
Uninterrupted energy supply
Affordable supply
Accessible supply
UK energy security
Has widening energy gap, not energy secure because:
Renewable energy not as efficient and so can’t fully replace energy from fossil fuels
Cheaper to import fossil fuels than exploiting UK resources
Factors affecting energy security
Commitment to tackling climate change and reducing fossil fuel use
Energy sources running out
War/conflict
Natural hazards
Political disputes
Advantages of gas
Efficient
Least polluting of fossil fuels
Easy transport - pipes
Easy to produce energy
Reliable
Disadvantages of gas
Risk of explosions
Releases CO₂ (GHG)
Air pollution
Price fluctuates
Advantages of oil
Efficient
Less polluting than coal
Quite easy transport - pipes/barrels
Easy to produce energy
Reliable
Disadvantages of oil
Risk of oil spills
Risk of fire/explosions
Low world reserves
Releases CO₂ (GHG)
Air pollution
Price fluctuates
Advantages of coal
Large world reserves
Mechanisation + tech made coal more accessible
Cheap
Efficient
Easy to produce energy
Reliable
Disadvantages of coal
Releases CO₂ (GHG)
Releases SO₂ (causes acid rain)
Opencast mines destroy habitats
Heavy + bulky to transport
Mining accidents
Air pollution
Advantages of nuclear
No GHG emissions
Efficient
Small amount of uranium needed
Disadvantages of nuclear
Radioactive + expensive to dispose of
Power stations expensive
Risk of nuclear accidents
Possible health impacts near power stations
Advantages of hydroelectric
No GHG emissions
Controls flooding downstream
Often in sparsely populated areas
May provide water storage for irrigation + domestic use
Disadvantages of hydroelectric
Large areas of land flooded behind dam
Dam traps sediment - can affect ecosystems downstream
Visual pollution
Can prevent fish movement upstream
People + settlements may have to relocate
Expensive to build + maintain
Advantages of wave/tidal
No GHG emissions
No air pollution
Potentially produce large amounts of energy
Reliable
Disadvantages of wave/tidal
Expensive to build + maintain
Can affect marine ecosystems
Few suitable sites
Advantages of wind
No GHG emissions
No air pollution
Can be large / small scale
Cheap to run
Can be on land / offshore
Disadvantages of wind
Unreliable - only works when wind is strong enough but not too strong
Visual pollution
Noise pollution
Many turbines needed to produce same energy as avg. coal power station
May affect bird migration patterns / kill birds who fly into blades
Advantages of solar
No GHG emissions
No air pollution
Can be large / small scale
Can be used in most locations
Can be incorporated into building design
Disadvantages of solar
Expensive
Unreliable - only works when sunny
Large numbers needed to produce energy
Uses large areas of land
Advantages of geothermal
No CO₂
Lots of potential sites
Reliable
Can produce large amounts of energy
Disadvantages of geothermal
Expensive
Emits sulfuric gases
High temp causes maintenance issues
Advantages of biomass
Uses waste/biofuels which regrow
Available in most locations
Disadvantages of biomass
Air pollution
Produces GHGs
Expensive
Sustainable
Meeting the needs of today’s population while ensuring that future generations are able to meet their needs
Sustainable energy management
Essential if future generations are to have necessary energy resources
Non-renewable sources will run out eventually so need to be used carefully
As supplies run out, prices will increase, meaning:
Economic development harder as profits decrease
Countries with energy surplus become more powerful
Countries with energy gap pay more to import energy
Fossil fuels create pollution + emit GHGs - need to reduce amount used
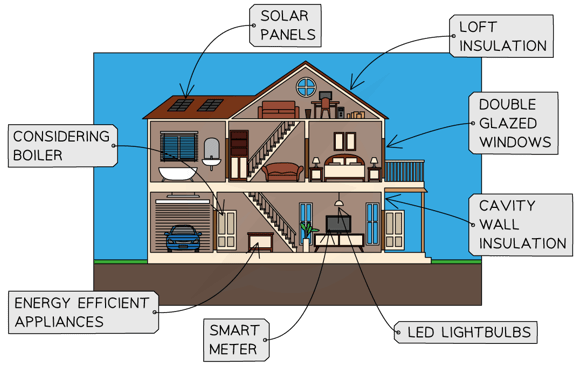
Individual actions to improve energy efficiency
Reduce car use by using public transport, walking, cycling
Insulating walls + roof spaces
Buy energy efficient appliances, e.g. washing machines
Don’t leave electrical items on standby
Install double/triple glazing
Install heat exchange
Turn thermostat down
Install solar panels
National actions to improve energy efficiency
Invest in renewable tech, e.g. wind, solar
Encourage switch to electric cars
Invest in public transport
Provide grants + loans for homeowners to install solar panels/insulation
Building regs to ensure new homes are energy efficient
Energy use in developing country (Nepal)
Mountainous landscape, includes most of Himalayas
Rural population - only 16% living in towns/cities
Low energy demand but growing as country develops
Energy mix in developing country (Nepal)
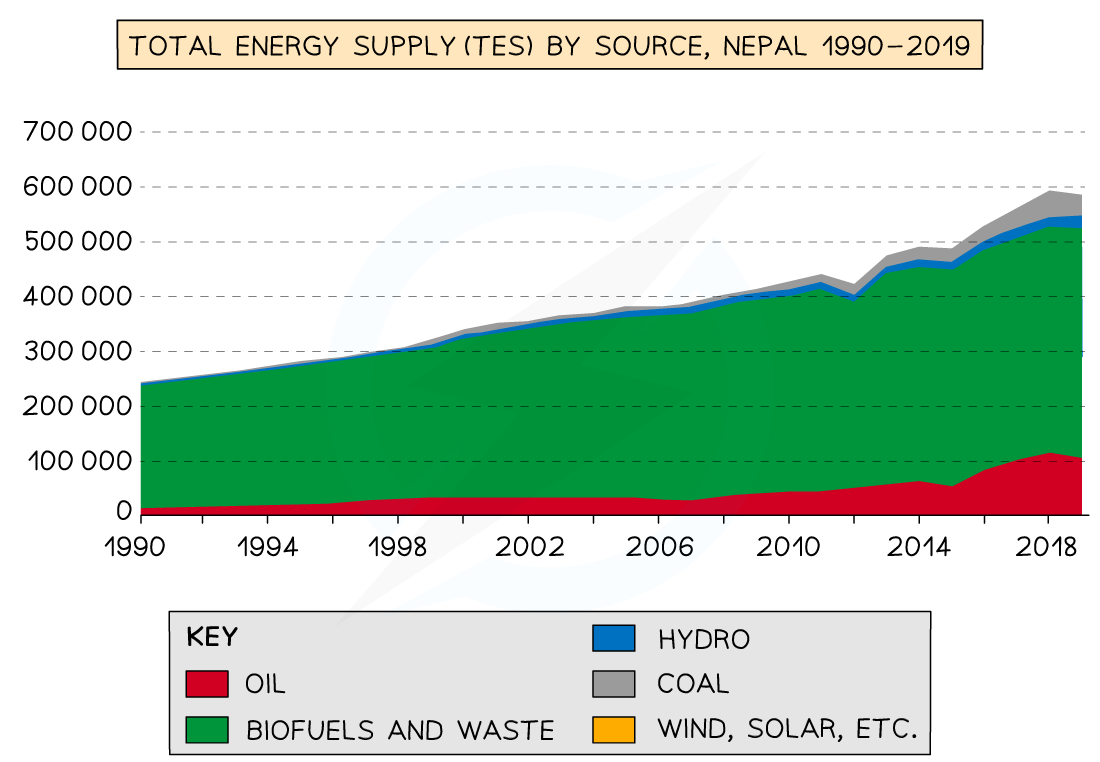
Main energy source for 82% of rural population is fuelwood
In urban areas, use of fuelwood is 36%
Nepal has no suitable coal, oil, gas reserves so these have to be imported
98% of all electricity in Nepal generated through hydropower
Sustainable future in developing country (Nepal)
Electricity access has increased rapidly over past 15yrs - 88% of population now have electricity access
Support from World Bank led to more investment in hydropower
Over 3000 micro-hydro plants in Nepal
Example of HEP plant in Nepal
Ruma Khola Micro-Hydro
Completed in 2009
Provides electricity for town of Darbang + 5 neighbouring villages
Supplies energy for 22 industries, including:
Metal workshop
Furniture manufacturers
Cement block manufacturer
Noodle factory
Funded with govt. grants with support from World Bank
Built + operated by community
Loans paid back using money that community pay for electricity supply
Has improved living standard in communities
Reduced reliance on kerosene + fuelwood, less emissions
Decreased deforestation
Energy use in developed country (Norway)
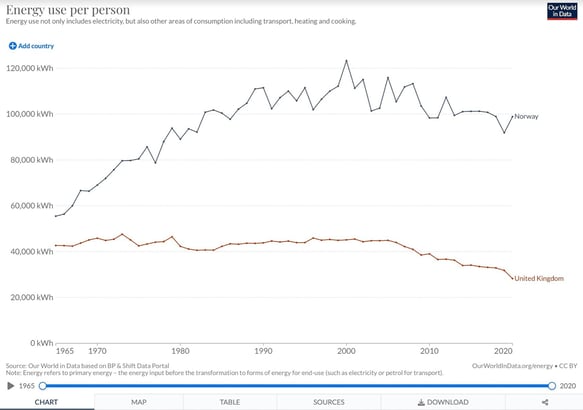
One of world’s highest energy demand
Mainly urban population - 83% living in towns/cities
Energy mix in developed country (Norway)
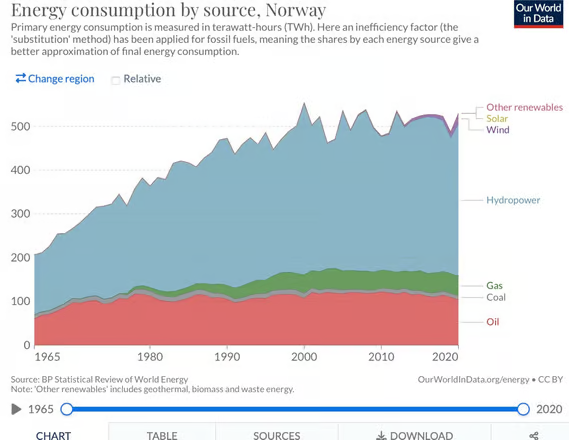
Has signficant energy resources:
1% of world’s gas reserves (17th in world)
0.3% of world’s oil reserves (22nd in world)
Some coal reserves
One of world’s largest energy exporters
Hydropower generates 90% of electricity and accounts of 65% of energy use
Sustainable future in developed country (Norway)
Over 1500 hydropower plants
Expanding other renewable sources due to issue of reliance on hydropower during dry season + environmental impact of large hydropower plants
Demand continues increasing
Expanding number of wind farms:
Currently 53 wind farms
36 additional onshore + offshore planned and due to be started/completed by 2030
Includes world’s first floating wind farm
Investing in solar energy:
Oslo homeowners get 30% subsidy for installing solar panels
Encouraging population to move to electric cars to reduce oil consumption:
2021 - 66% of all new car sales were electric
Urbanisation
Growth in % of people living in urban areas
Suburbanisation
Outward growth of town/city, increasing the size of built-up area
Counter-urbanisation
Relocation of people (and economic activities) from larger towns/cities to smaller settlements in rural locations beyond suburbs
How does urbanisation rate vary?
Faster in developing countries, because:
Most new economic development in these countries is concentrated in big cities
Push-pull factors lead to high rates of rural-urban migration
Cities experience high rates of natural increase in population
Slower in developed countries, because:
Large proportion of population already lives in towns and cities
But, built-up areas of towns and cities continue to grow
Factors that can affect rate of urbanisation
Speed of economic development
Economic growth drives urbanisation
Faster growth of secondary + tertiary employment sectors = faster growth of urbanisation
Rate of pop. growth
Economic growth needs supply of labour
Demand can be met in 2 ways:
Natural increase in population - slow way of meeting demand
Rural-urban migration - more important source of labour as it attracts wider pool of people into urban region
Megacity
City with population of 10m+