Macroeconomics ECON0016
1/148
There's no tags or description
Looks like no tags are added yet.
Name | Mastery | Learn | Test | Matching | Spaced | Call with Kai |
|---|
No analytics yet
Send a link to your students to track their progress
149 Terms
NIIP
Net international investment position: International assets minus international liabilities
Bt = The amount of assets your country owns abroad, minus the assets in your country owned by foreigners
Balance of payments
Records the distributions of debits and credits between countries. Is composed of current account and financial account
CA (Formula from definition)
CA = TB + NII + Net unilateral transfers
CA (Definition)
A measure to identify whether a country is accumulating (+) or decumulating (-) foreign assets
NIIP-NII Paradox explanations, and definition
Dark matter
Return differentials
Definition: When NII is positive but NIIP is negative. How can a country be a net debtor but receive interest payments?
Dark matter (Definition and how to calculate)
True NIIP = NIIP + Dark Matter
Dark Matter: Underestimation of NIIP foreign asset holdings
Since TNIIP*r = NII
Then Dark Matter = NII/r - NIIP
Return differentials
The rate on assets and liabilities is different.
NII = L*rL + A*rA
CA (Formula for savings)
CA = S - I
CA (Formula from B)
CA = Bt - Bt-1
CA (Formula from TB)
CA = TB + rt-1Bt-1
IBC assumptions (2 general ones, and then one under uncertainty?)
Transversality (B2 = 0)
Free capital mobility (r = r*)
Under uncertainty: need to assume either incomplete or complete asset markets
Terms of trade
Price of export goods relative to import goods (exports over imports)
TT1 = PQ1 / PC1
Represents how many units of import goods can be consumed by exporting one unit of export goods.
Interest rate effect on c (substitution and income). How does this affect CA?
Substitution: Discourages spending, incentivises saving, because rates are higher. CA improves.
Income: Depends on whether person is a debtor or creditor. Debtors’ income will deteriorate, CA improves. Creditors’ income will increase, CA decreases.
Import tax effect on IBC?
If T1 and T2 increase proportionally, no effect
If T1 > T2, C1 falls C2 rises. CA1 increases
If T1 < T2, C1 rises C2 falls. CA1 decreases
Firms’ impact on HH IBC?
Profit enters on the RHS

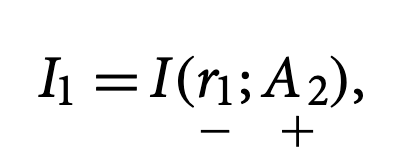
The investment schedule
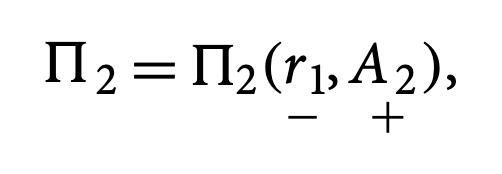
The profit schedule
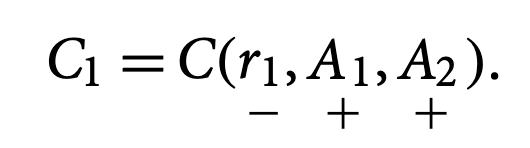
The consumption schedule
n.b. notice C1’s consumption schedule contains r1 and A2 which are the factors that influence I, and hence profits, and hence consumption.
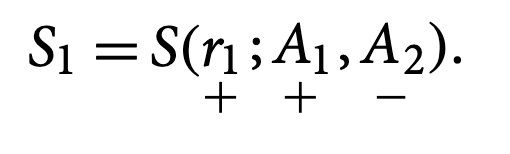
National saving schedule
National saving identity
S = Y - C
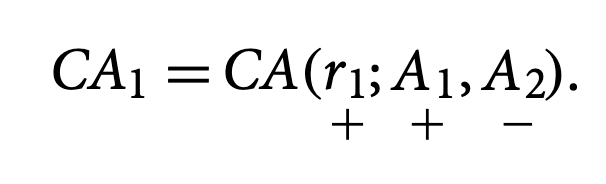
Current account schedule
In an open economy, what happens to S, I, and CA when…
r* increases?
A1 increases?
A2 increases?
n.b. A1 increases S1 because: Larger productivity in period 1 leads to the period 1 endowment to grow. S1 = Y(A1) - C(A1) where Y is larger than C. The HH does not consume the entire newly endowed. Therefore S unambiguously goes up.
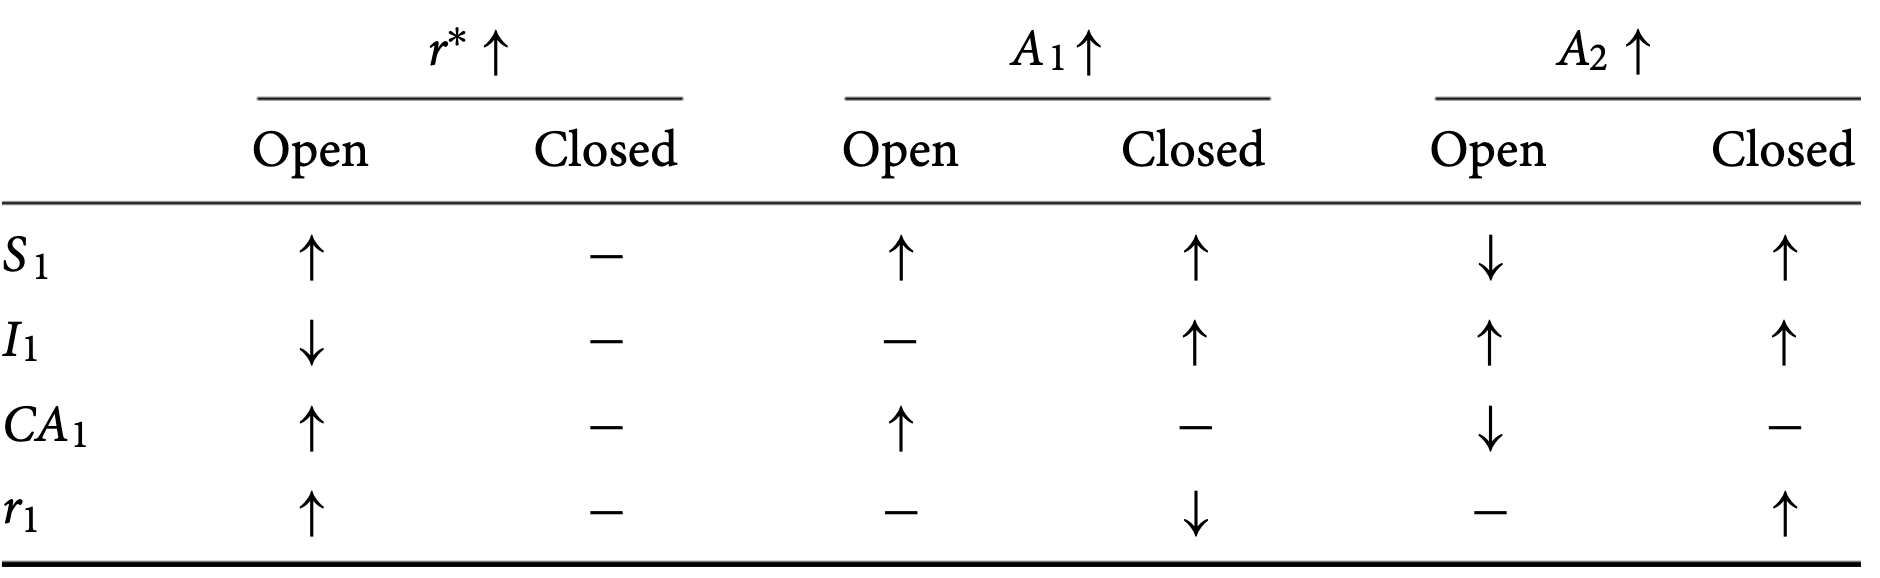
In a closed economy, what happens to S, I, CA, and r when A1 increases? A2 increases?
Use CASI relation
NOTE: For closed economy, S and I need not necessarily increase for A1 and A2.
When A1 increases → S1 increases but I1 stays the same… S1 increasing causes domestic r to fall. This causes I1 to increase.
When A2 increases → I1 increases and so domestic r increases to match funds demand. This incentivises saving so S1 increases too

Draw the CA-S-I relation. Comment on the trends.
Graph 1: S/I on the x-axis, r on the y-axis
As r increases, S increases, so S is upward sloping
As r increases, I decreases, so I is downward sloping
Graph 2: CA on the x-axis, r on the y-axis
CA depends on both saving and investment. Saving increases as r increases. Investment decreases as r increases. CA unambiguously increases as r increases.
Since CA = Savings - Investment
Closed economy and CA-S-I relation? Draw it out.
CA must always remain at zero for a closed economy. Hence, any shift in productivity must be counteracted by adjusting the interest rate to maintain CA=0
(Refer to drawing too)
Terms of trade shocks - How does it affect the investment schedule? Saving schedule? CA schedule?
TT1 multiplied onto A1
e.g. I depends on r1 and A2. → with TT shocks: I depends on r1 and TT1A2
How does uncertainty affect the current account? Trade balance?
An increase in uncertainty leads to precautionary saving, increasing the CA.
The trade balance improves because consumption falls. TB = Q-C so TB increases.
What are state-contingent claims?
Reflects full asset market in an environment w/ uncertainty. Agents can buy state-contingent claims that guarantees a certain payoff regardless of whether the economy ends up in the good or bad state.
State-contingent claim example:
product “good” pays only when economy is in good state in t=1
product “bad” does the opposite
How can a risk-free bond be emulated with state-contingent claims? (Derive/show mathematically)
The value of my portfolio is Lambda = (pG+pB)(1+r1)
This must equal 1, the price of a risk-free bond. Or else there would be opportunity for arbitrage. This emulates the risk-free bond.
What is the price of state-contingent assets?
pG/B = (price of risk-free bond)σG/B
Where σ is the probability of being in that state of the world.
What are the assumptions for the Ricardian equivalence?
No credit-constrained households (all HHs are able to freely borrow and perfectly smooth their consumption)
No proportional taxation (Lump-sum)
HHs have perfect foresight of what will happen
HHs continue to exist in the next period (counterexample: If I know I will die before the next period, I have no incentive to respond to any changes to G or T in this period)
Main conjecture of the Ricardian equivalence
Influence on c? On CA?
All tax cuts in the current period will eventually need to be remedied in the next period with a tax hike. Therefore, a tax cut/decrease in G should signal HHs to precautionarily save for the next period. Therefore, the change in G is exactly offset by the change in S. CA therefore does not change.
Government’s intertemporal budget constraint?
G1 + G2/1+r1 = T1 + T2/1+r1 + B0(1+r0)
Firms’ profit function and firms’ profit maximisation
pi2 = A2F(I1) - (1+r1)I1
dpi2/dI1 = 0
thus, F’(I1) = 1+r1
Households’ intertemporal budget constraint
C1 + C2/1+r1 = Q1 + pi2/1+r1 - T1 - T2/1+r1 + (1+r0)B0
When there exists a lumpsum tax, what is HH’s optimal value for c1? (Note: Assume we are using the ln(c1) + ln(c2) utility fxn, and that B0 = 0)
c1 = ½(Q1 - T1 - T2/1+r1 + pi2/1+r1)
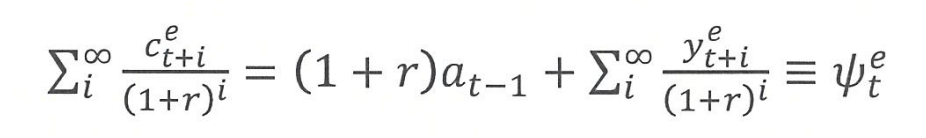
PIH formula
(What does phiet equal? Write the logical definition AND the mathematical equation)
(r/1+r)(phiet)
Where phiet is the present value of all expected lifetime income
phiet should also equal the present value of all future consumption
Because you want to end your lifetime spending all you earned.
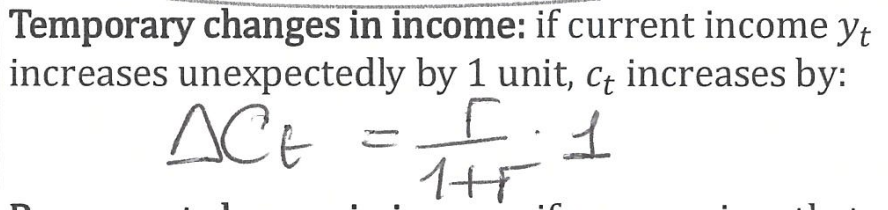
How do temporary surprises/shocks change consumption by PIH?
(r/1+r)(shock amount)
How do we treat permanent surprises/shocks to income? What are the steps to adjusting consumption?
Identify when the shock is happening (DISCOUNT the shock to present day value if it is in the future)
Identify if the shock is applied to one-off or yearly income
If the latter, we change by full shock amount. If the former, note that (r/1+r)(1+r)(shock amount) = shock
Present value of k
k/1+r
Assumptions of the PIH model used in class
log utility model is used: ln(c1) + ln(c2) = u
infinite lifetime
no myopia
Secondary fiscal surplus/deficit formula?
How does this differ from the primary formula?
SG = r0B0 + T1 - G1
It’s different from the primary formula because it includes interest receipts/payments (Primary fiscal formula is just T-G)
Ricardian equivalence: how does national savings change when the government increases tax?
Nothing. it does not change.
National savings = private savings + government savings
change in private savings = - change in tax
change in government savings = change in tax
These exactly offset each other
How does changing G1 affect TB1, and CA1 (Under assumption of NO RICARDIAN)? How is it different if it’s G2
Same essentially as changing Q, endowments.
Increasing G allows C1 to increase so savings go down. deltaTB = deltaCA = -1/2(deltaG)
If it’s G2, then need to divide by 1+r as in the original budget constraint (to ge the present value)
What happens to a permanent increase in G? How does it affect CA? (Mathematically derive and then explain)
The crux of this problem is getting you to solve the economy-wide budget constraint when there are firms, HHs, and the government present.
Assume dG1 = dG2 = dG > 0
Noting CA = TB+NII = Q-C-I-G+NII,
Replace in the original optimality condition for c1*
(Attached image)
Taking the derivative of CA wrt G yields -r/2(1+r) *deltaG
Provided r is small, CA does not change by much.
HTM households and a tax cut? How does this affect the current account? And how does this affect public saving?
If HHs cannot perfectly borrow to smooth consumption, then a tax cut does indeed increase consumption. They will not save the full amount.
→ delta Private savings is therefore not equal to delta T. Instead, deltaC is equal to deltaT!
→ Causes CA to go negative (private savings + is less than public savings -)
→ Causes public saving to go negative (due to tax cut)
How do distortionary taxes affect the twin deficits? Derive.

How do distortionary taxes affect twin deficits?
tau1 decreases → consumption increases → private savings decreases → CA deficit
tax cut → fiscal deficit
therefore negative on twin deficits
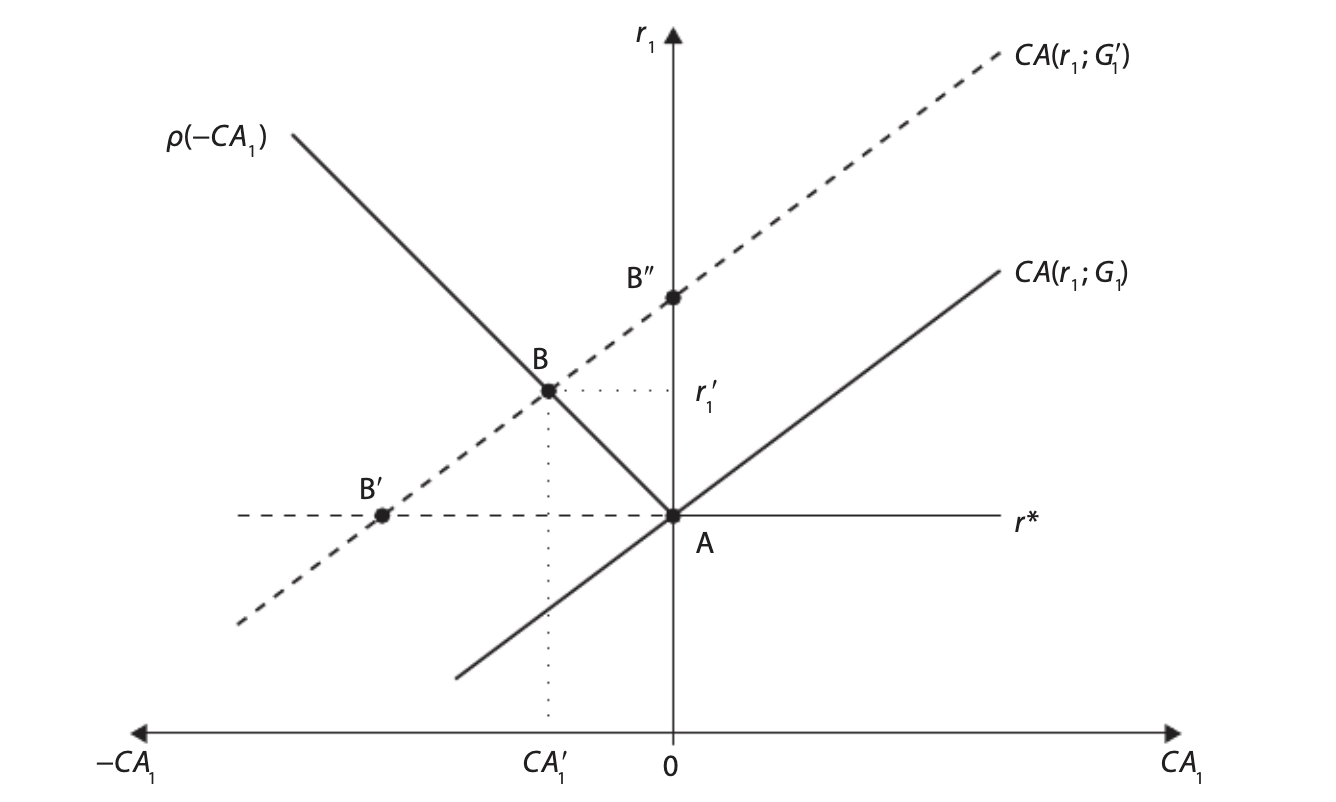
Draw the graph of fiscal policy under imperfect capital mobility.
Effect of increasing government spending?
CA on the x-axis and r on the y-axis.
CA<0 means debtor and pays a higher r as the debt grows.
CA>0 means creditor and pays a fixed r=r*
As G increases, we shift left (CA decreases, as the debt grows)
B” = autarky
B = imperfect capital mobility
B’ = perfect capital mobility
Law of One Price (eqn? intuition?)
LOOP: P = εP*
Where P is the price per good in own country
ε is the exchange rate
P** is the price per good in foreign country
Intuition: A good should cost the same, in real terms, in all countries. Or else there exists opportunities for arbitrage.
HTM HH general definition
Consumption of entire after-tax income
MPC for HTM households
1
MPC for PIH households
r/1+r
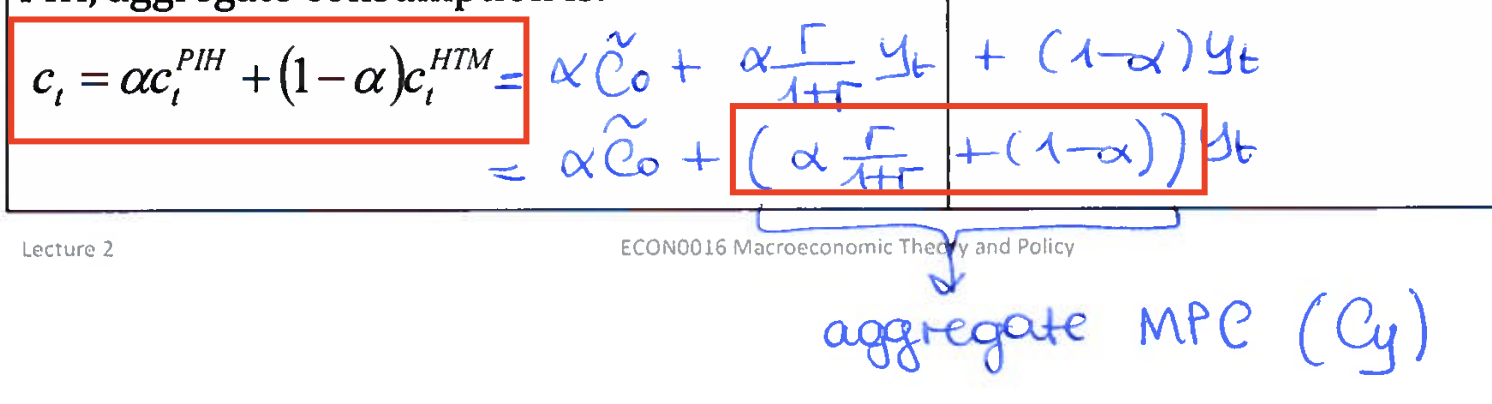
Aggregate consumption function?
Aggregate MPC?
Depends on alpha - the fraction of households that are PIH
1-alpha = fraction of households that are HTM
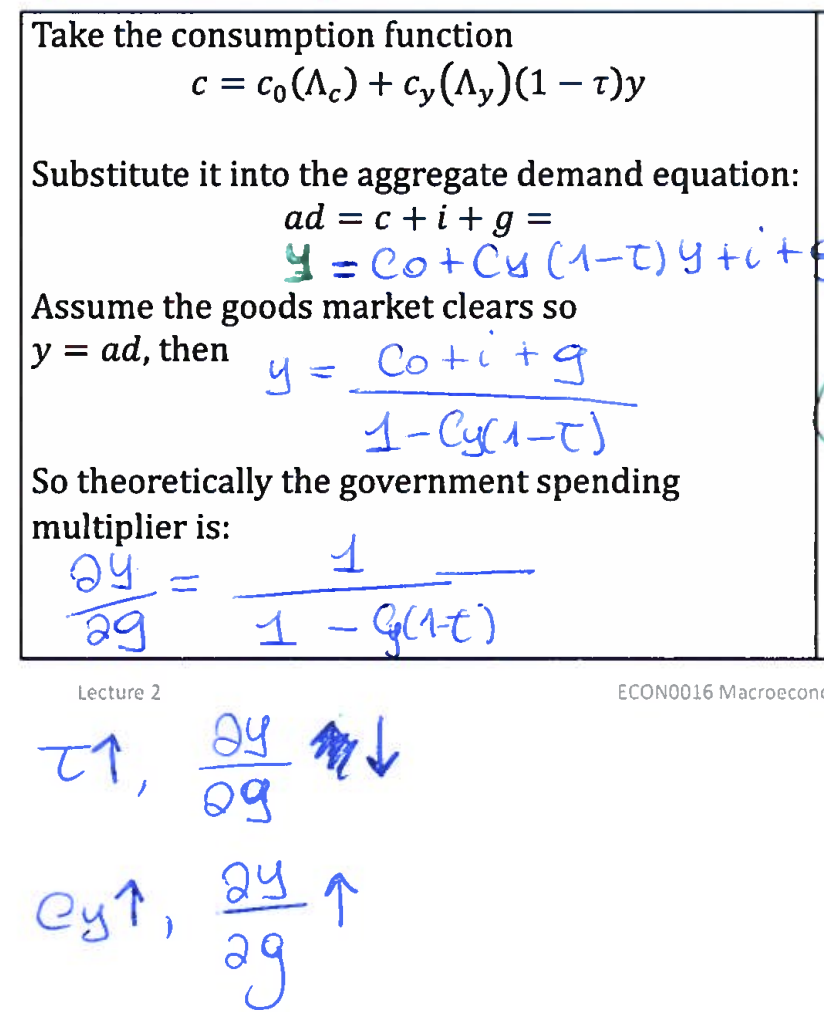
Keynesian after-tax consumption function
C = c0 + cy(1-t)y
Where cy = MPC and y is the before-tax income
Derive the government spending multiplier from the consumption function
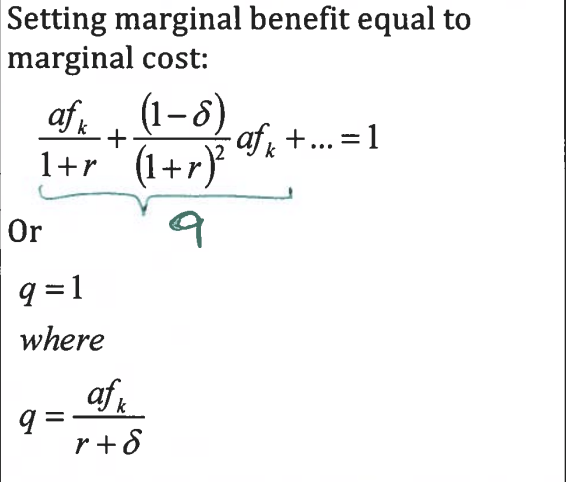
Explain Tobin’s q theory of investment. Write the formula for Tobin’s q.
Firms face a production function af(k) where they choose K to maximise PV of future shareholders’ dividends. If K depreciates with a rate δ then the MB of each year is af(k)*(1-δ)t
This leads to the infinite sum in the image equating MB=MC
Using the sum of infinite geometric series, q = afk / r+δ
What is the average of q (Q) in Tobin’s q theory?
Q = Stock market value of firm / Replacement cost of capital
Q>1 means stock market is overvaluing the firm, or irrationality
Draw the IS curve.
How is it derived? OK dont derive it but just write it out.
x-axis is aggregate income, Y
y-axis is the real interest rate, r
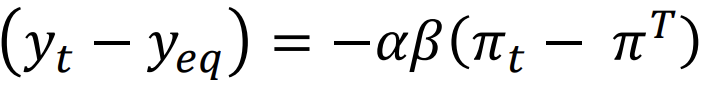
The IS curve is: y1 - ye = -a(r0 - rs)
Derive it using the GME eqn Y=AD, AD = C+I+G. Replace C and I accordingly with C=c0 + cy(1-t)y and I=a0 + a1r Re-arrange and solve for r.
What shifts the IS curve?
What changes its slope?
A higher MPC causes…?
Shifters: Things not directly multiplied by income in the GME. E.g. government spending, c0, a0
Slope-changers: Things directly multiplied by income e.g. tax, cy (MPC)
A higher MPC causes the IS slope to become flatter.
What does the steepness of the IS curve tell?
Steeper = More difficult to stimulate economy, a larger drop in r is needed to have the same effect on y. (
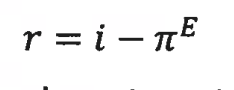
Fischer Equation
Labour market under perfect competition. How does the market clear and what are the implications for unemployment?
Not a realistic depiction. Under this scenario, adjusting policies has no effect on labour.
Perfect clearance of market → no unemployment. But recall that there must exist a equilibrium amount of unemployment in real life. If unemployment was zero then there is no incentive for workers to put in effort
WS/PS Model assumptions
Incomplete contracts
Workers are paid a real wage higher than their reservation wage
Unemployment measures the amount of bargaining power workers have
Wage and price setting are done yearly
Real wages equation (Is it an increasing/decreasing fxn of u?). Derive the simple formula
simple formula: w = W/P
Where W = nominal wage
P = nominal prices
As u increases, w decreases. This is illustrated by the WS curve.
Prices under imperfect competition (foundation for PS curve)
P=(1+µ)MC where µ is markup
Markup and relationship with competition
Higher competition corresponds to lower markup
Less competition (oligopolies/monopolies) → higher markup
Nominal marginal cost of labour
MC = (1+τ)W/λ
λ = MPL
τ = taxes that firm pays, e.g. pension contributions or national insurance contributions
Derive the extensive formula for real wages, and hence obtain the price-setting curve
noting that P=(1+µ)MC and MC=(1+τ)W/λ we can combine the equations to get W/P=w= λ/(1+τ)(1+µ)
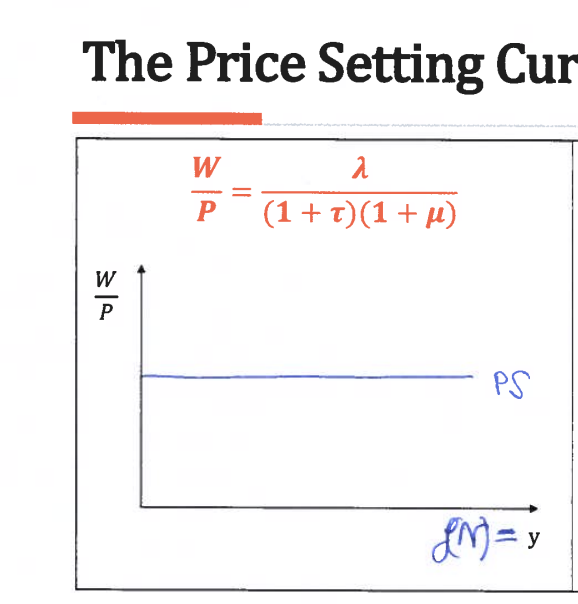
How does an increase in prices of inputs affect PS?
Higher input costs → Lower MPL → Lower lambda → PS shifts down
Write the equation of the WS curve.
W/P = w = 1-αu + z
where u = unemployment and z = other factors
Note - it is the inverse of the workers’ Best Response Function (BRF)
What is the intersection of the WS/PS
The NAIRU - non-accelerating inflation rate of unemployment
Graphically show the effect of increasing markup on unemployment, and hence, inequality.
Unemployment rises and hence inequality rises too as the Gini coefficient becomes larger.
In WS/PS model, what variables are sticky and what variables are not?
W is sticky. It is assumed to change only once a year. So w is sticky too. But P is not sticky.
The economy is always on the PS curve but it will take at least one year to be back on the WS curve.
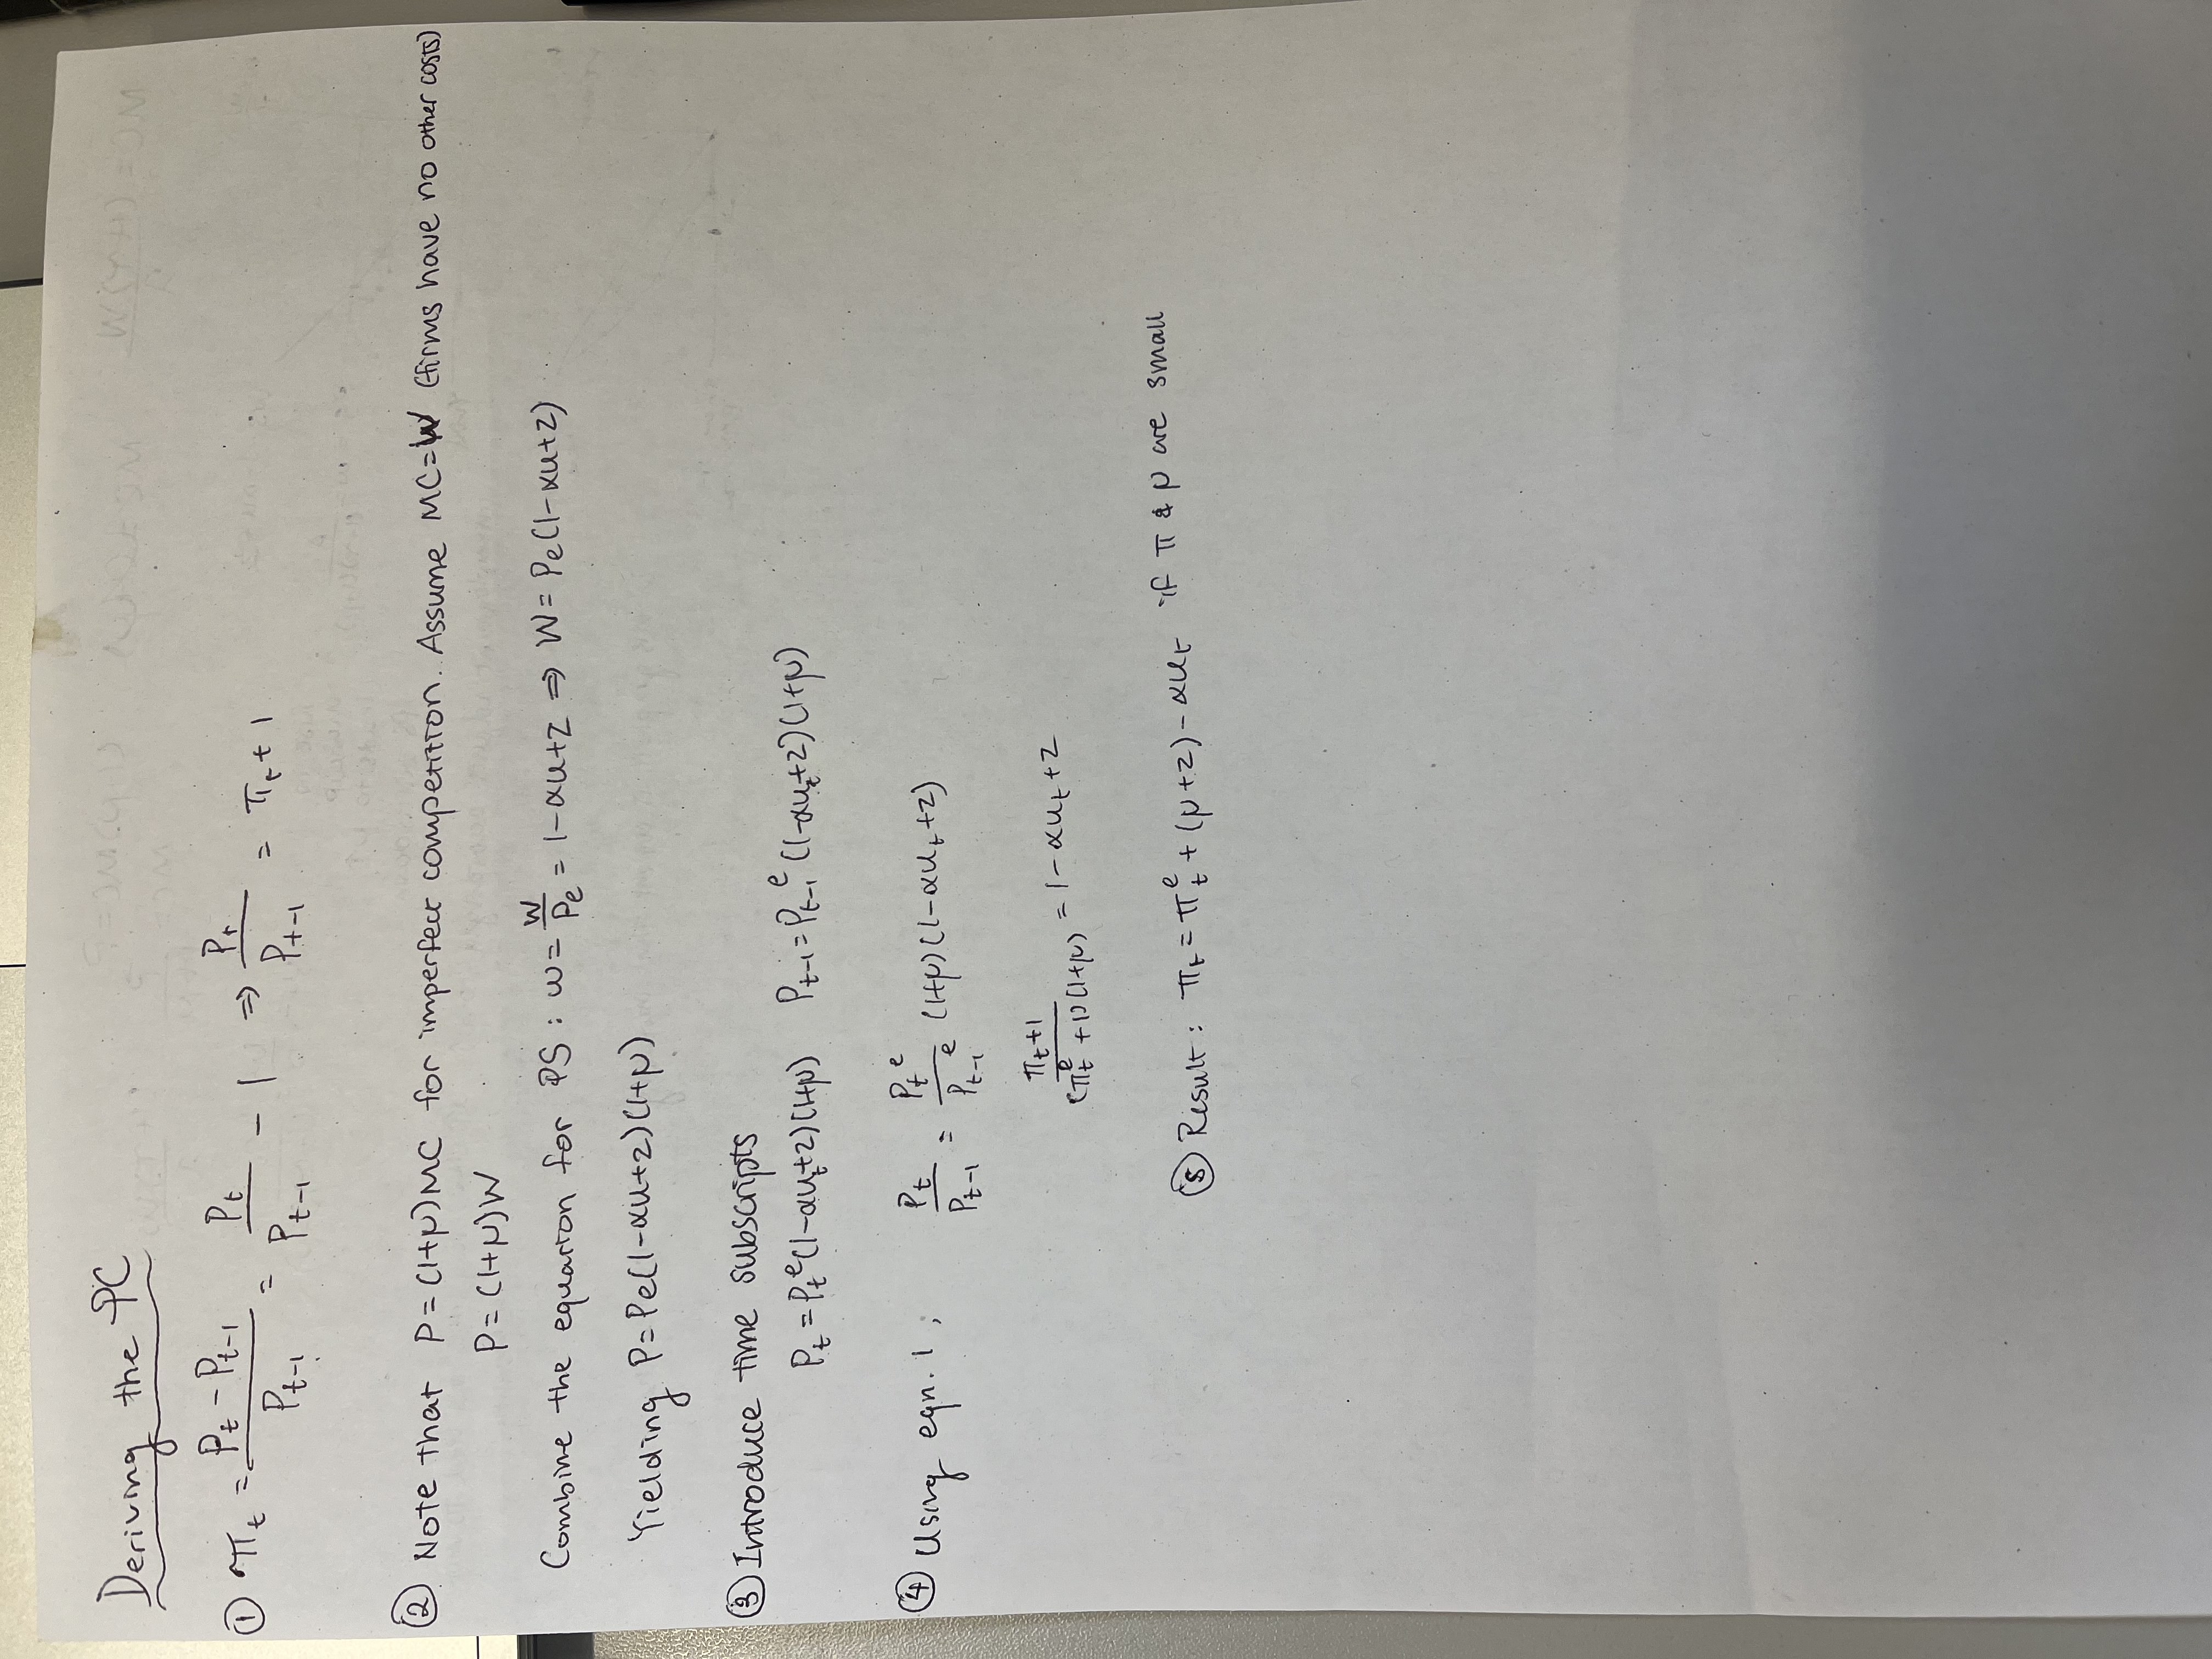
What is the Phillips Curve? (PC)
pi1 = pi0 + a(y1 - ye)
Flowchart for a positive AD shock, and draw it out graphically
Positive AD shock
→ More hiring by firms
→ Positive BG opens up
→ Wage-setters fulfill workers’ request by raising wages by piT + BG
→ Price-setters increase prices by piT + BG
→ piT is updated, and is now higher than the previous period by BG
→ Workers now demand a higher wage in next period equal to BG + new piT
→ Spiraling inflation unless the BG is closed
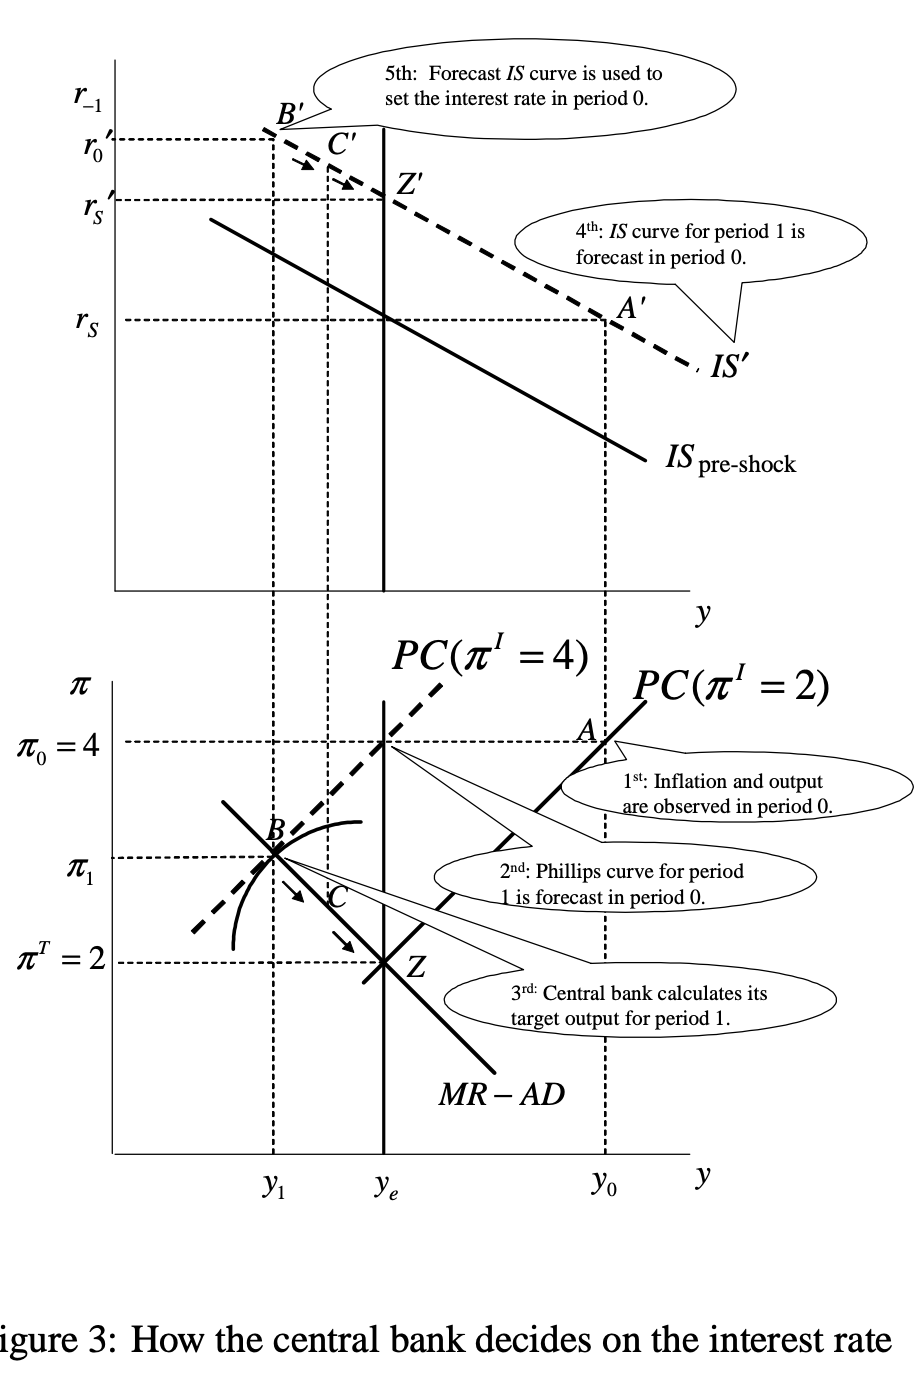
note that the diagram assumes the AD shock is permanent. If the assumption is the AD shock is temporary, the lower IS curve would have been used to se the interest rate.
Slope of Phillips Curve vs. WS curve?
Make the assumption that inflation and wages are calculated with the same frequency → They have the same slope
If inflation is calculated more frequently then the PC is steeper
If wages are calculated more frequently then the WS is steeper
What is quantitative easing? (Name one benefit? And why do we do it?)
A way to influence money supply. By buying bonds, the government pumps money into the economy. By selling bonds, the government sucks out money from the economy.
Benefit: Not subject to the ZLB
Why: pumping money into the economy stimulates the economy, sucking out money has the opposite effect
Central bank’s loss function (write it out, and what is it for? What does a higher beta correspond to?)
L = (y-yT)2 + β(π-πT)2
The central bank tries to minimize this loss function. I.e. minimize the deviation from the target
Higher beta means more emphasis on wanting the inflation to stay close to target (Hawkish CB)
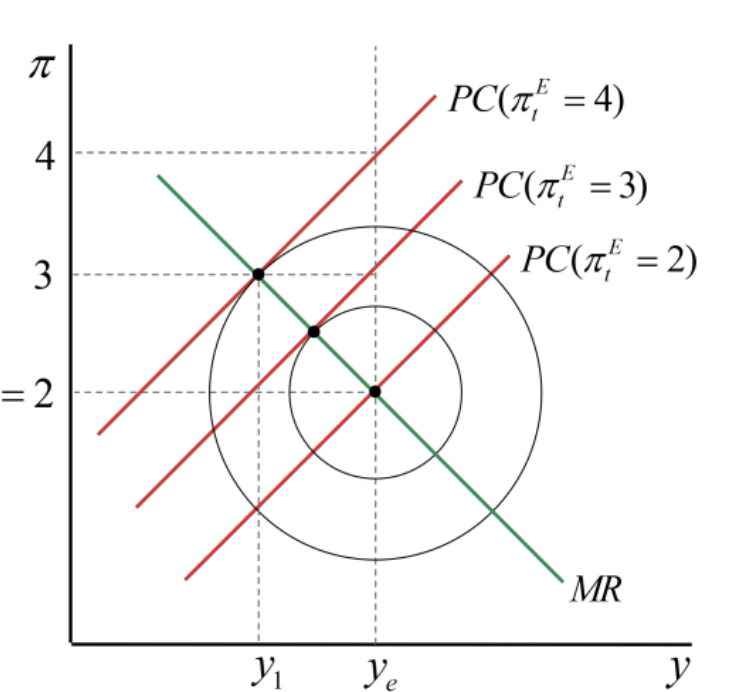
MR curve definition (Effect of a higher beta on the MR curve?)
A line traced out by the loss-function-minimised point on every Phillips curve
Higher beta corresponds to a Hawkish CB. Preference to minimise inflation and hence a flatter MR curve.
What shifts the MR curve?
yT, πT (The inflation or income targets of the central bank)
Increasing either target shifts the MR curve rightward
Draw what happens to the 3-equations model under a inflationary shock
.

Draw what happens to the 3-equations model under a demand shock of one period (temporary)
What is the MR curve equation?
needs to be memorised cold
Draw what happens to the 3-equations model under a demand shock that is permanent
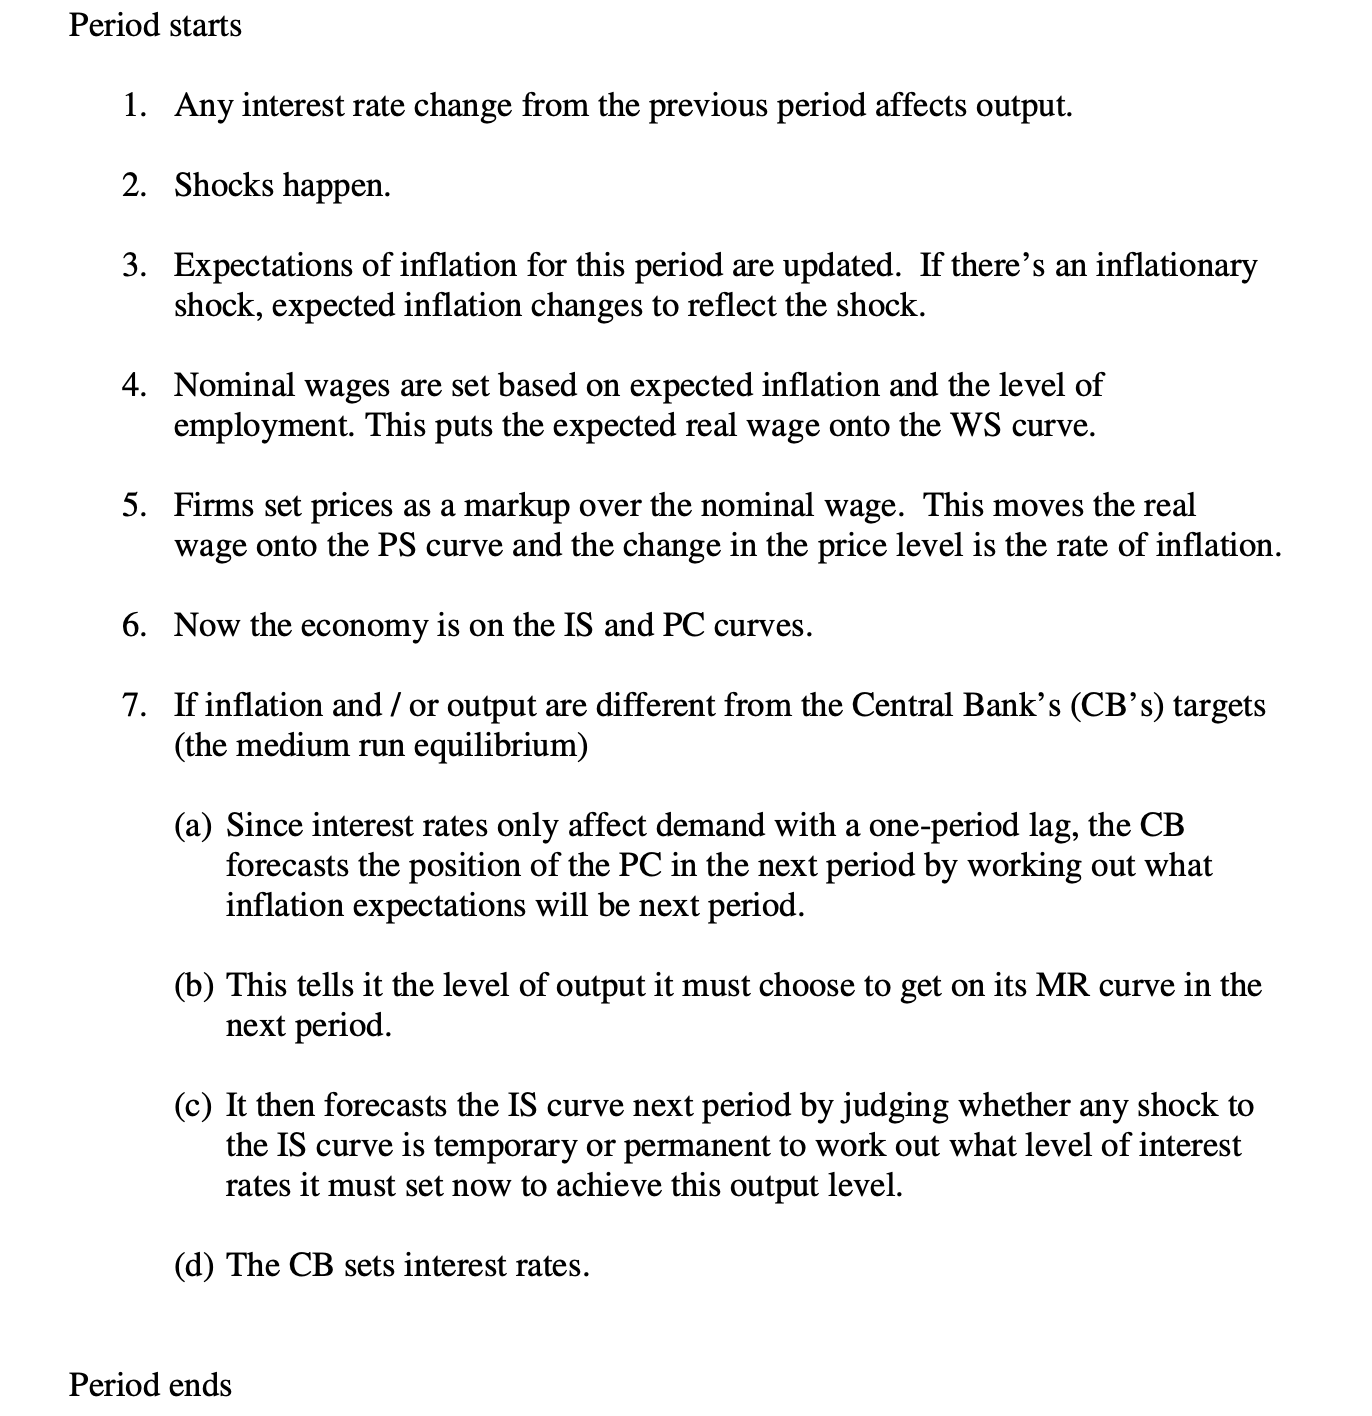
Timeline when using three-equations model?
Period starts
1. Any interest rate change from the previous period affects output.
2. Shocks happen.
3. Expectations of inflation for this period are updated. If there’s an inflationary shock, expected inflation changes to reflect the shock.
4. Nominal wages are set based on expected inflation and the level of employment. This puts the expected real wage onto the WS curve.
5. Firms set prices as a markup over the nominal wage. This moves the real wage onto the PS curve and the change in the price level is the rate of inflation.
6. Now the economy is on the IS and PC curves.
7. If inflation and / or output are different from the Central Bank’s (CB’s) targets (the medium run equilibrium)
(a) Since interest rates only affect demand with a one-period lag, the CB forecasts the position of the PC in the next period by working out what inflation expectations will be next period.
(b) This tells it the level of output it must choose to get on its MR curve in the next period.
(c) It then forecasts the IS curve next period by judging whether any shock to the IS curve is temporary or permanent to work out what level of interest rates it must set now to achieve this output level.
(d) The CB sets interest rates.
Purchasing power parity
The purchasing power of domestic currency buys the same basket of goods at home and abroad
The real exchange rate formula? What is it under absolute PPP?
e = εP* / P
Absolute PPP: e=1= εP* / P
The PPP exchange rate
The exchange rate to be had if absolute PPP were to hold.
εPPP =P / P*
Overvalued currency (Imagine JPY = foreign, HKD = local)
If ε > εPPP then the foreign currency is overvalued
(e.g. ε are measured by JPY/HKD. If ε > εPPP then the Japanese are getting more JPY per HKD than under PPP and so JPY is overvalued → implies HKD is undervalued)
GDPPPP - what is it and what is the formula
The per capita GDP of a foreign country at PPP
GDPPPP = GDPForeign country * εPPP
Recall εPPP = Home prices / Foreign prices
Relative PPP definition
If the real exchange does not change over time.
PPP does not need to hold, but the change in the real exchange rate needs to hold.
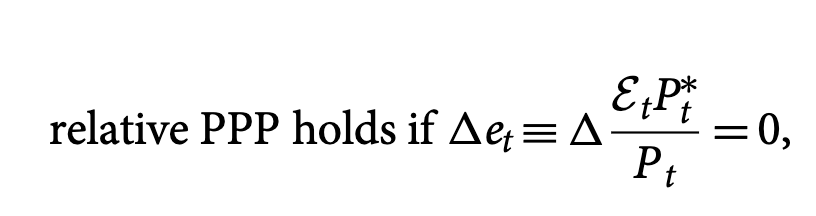
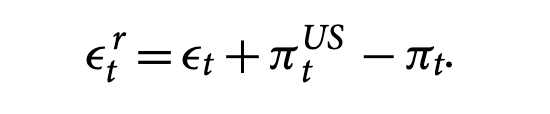
Real depreciation rate formula. (What is it? Derive.) What is the real depreciation rate if relative PPP holds?
Real dep rate is the rate at which the real exchange rate changes.
Real depreciation rate = 0 if relative PPP holds
Relative PPP holds in the ________ but not the ________
Relative PPP holds in the long run but not the short run
Deviation from relative PPP is (increasing/decreasing) in the distance separating two locations
INCREASING
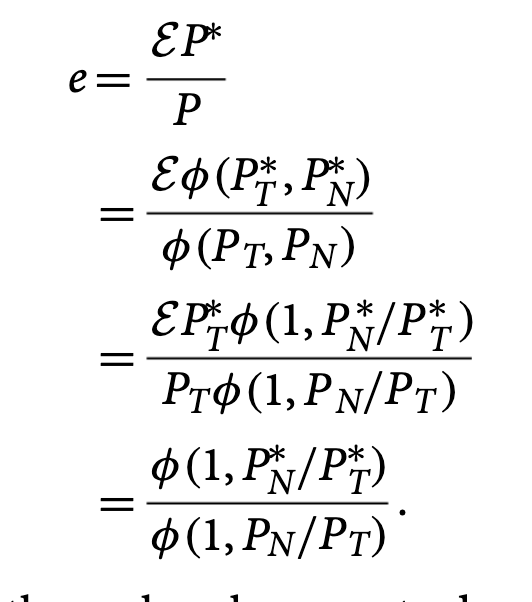
Derive the real exchange rate from the case of distincting between tradable and nontradable goods
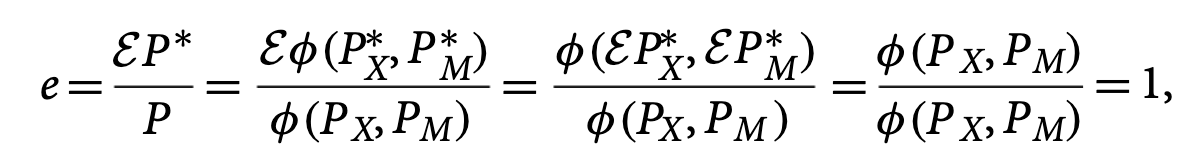
Derive the real exchange rate from the case of distincting between tradable exports vs imports with no tariffs
= 1
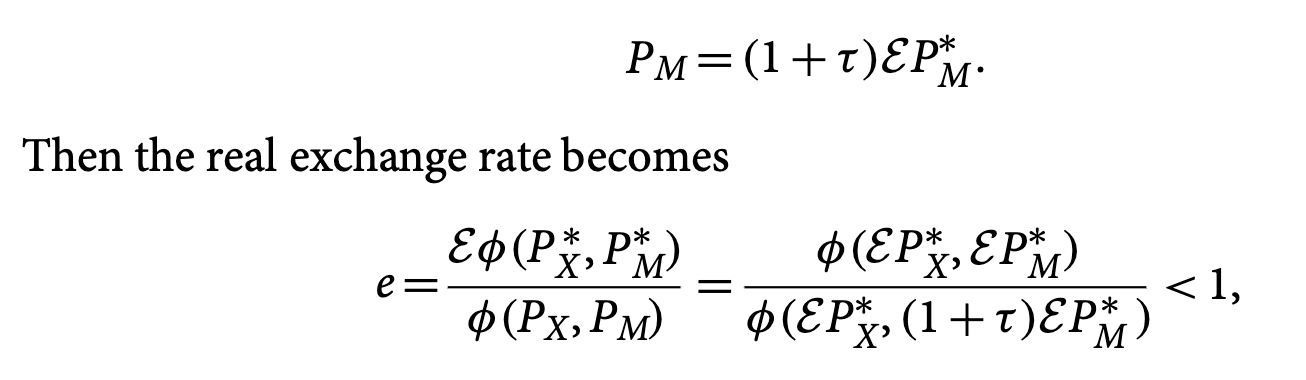
Derive the real exchange rate from the case of distincting between tradable exports vs imports with tariffs
< 1
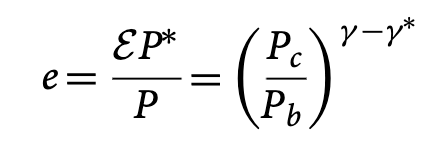
What is the real exchange rate under home bias?
where Pc is the foreign biased good and Pb is the home biased good
gamma is the degree of home bias
gamma* is the degree of foreign home bias
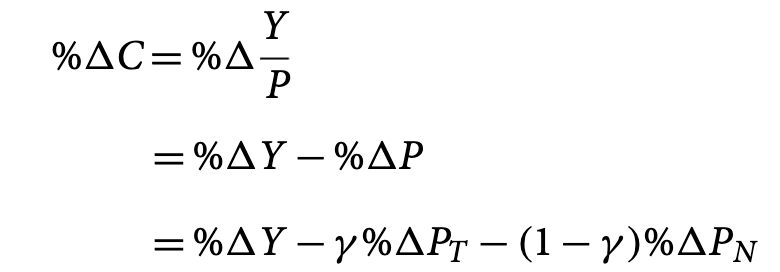
Percent change in consumption formula.
What is gamma?
We know C=Y/P
We also know %dC = %dY / %dP
(%d is percent change)
Gamma is the budget share on tradable goods