Economics WACE Exam Study
1/207
There's no tags or description
Looks like no tags are added yet.
Name | Mastery | Learn | Test | Matching | Spaced |
|---|
No study sessions yet.
208 Terms
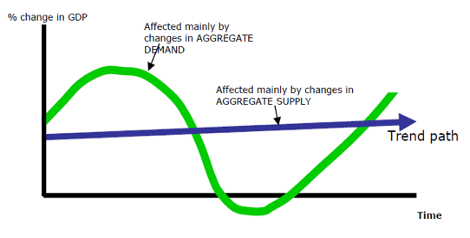
The Business Cycle
The Business Cycle: the short-term fluctuation of total output along a trend path.
Some years countries experience higher than average rates of growth i.e. boom and in others lower than average growth i.e. recession
The cycle will vary in length and amplitude making it highly irregular.
A recession is 2 quarters (6 months) of negative growth (it is possible to go into a trough without going into recession).
What Determines The Trend Path?
· For an economy to achieve sustained growth there must be a sustained increase in capacity or potential output.
· This is essentially a supply side issue involving use of more resources, better resources or using resources in a better, more productive, way.
· In the short term demand will send growth up and down, in the long term aggregate supply will send growth up and down
Business Cycle and Aggregate Demand
· Movements away from this trend line are essentially a demand side issue.
· If demand outstrips the ability of the economy to supply (a boom)
· If demand will fall below the potential level of output (a recession).
Characteristics of the 4 phases of the Business Cycle:
For each phase remember: CE-C-U-I-I
Boom | Downswing |
· High consumer expenditure · High levels of consumer and business confidence · Low unemployment (counter-cyclical) · Import levels are high · Inflation is high
| · Lowering consumer expenditure · Lowering levels of consumer and business confidence · Unemployment starts to rise · Inflation starts to fall · Inventories rise above desired levels |
Peak of the cycle. Rapid economic growth, growth is way above its trend level. | Economic growth rates slow down, growth rates start the period above the trend level but end the period below. |
Economic Indicator
refers to any piece of data or information that can be used to help build a picture of where the economy is and where it is going.
· Most important indicator is Gross Domestic Product (GDP). Provides key summary of economic trends.
Leading Indicators
predict economic activity
eg.
· building approvals
· share market
· levels of inventory by firms
· new employment vacancies
· business confidence
consumer sentiment
Coincident Indicators
(move in line with economic activity)
e.g.
· growth of real GDP
· interest rates
· sales of consumer durables
· retail sales
· manufacturing output
production of building materials
Lagging Indicators
change after the trends have been set.
e.g.
· unemployment levels
· savings bank deposit levels
· consumer debt levels
Causes of Economic cycles
· Shocks: exogenous changes to the components of aggregate demand.
o Positive examples: rise in terms of trade, demand for exports.
o Negative examples: Covid, drought, floods, rise in oil and food prices.
· Floors and Ceilings:
o Floors: create a minimum level of aggregate demand. Includes survival’ consumption, replacement investment and government transfers.
o Ceilings: constrain economic growth. Includes insufficient transport infrastructure, shortages of skilled labour and rising inflation.
· Government Policies:
o Automatic stabilisers: As aggregate demand rises, tax collection automatically rises and social security transfers fall automatically which reduces aggregate demand and vice versa.
o Discretionary: deliberate policy changes by the Reserve Bank (cash rate changes) and by the Government (changes to tax or spending) to control the level of aggregate demand.
Aggregate Expenditure
The total amount that firms and households plan to spend on goods and services at each level of income.
AE = C + Ip + G1 + G2 + (X-M)
· C = Consumption
· Ip = Planned investment expenditure
· G1 = Current Government expenditure
· G2 = Capital Government expenditure
· X = Exports
· M = Imports
Components of AE - Consumption
Expenditure on non-durable goods – food and clothing.
Expenditure on services – doctors, plumbers, mechanics.
Expenditure on consumer durables – white goods, furniture vehicles.
Approx. 60% - least volatile component of AE.
(Consumption is not very volatile because consumption is necessary to survival.)
Components of AE - Investment
Planned business expenditure on new capital equipment which will produce final goods and services for the future – machines, factories, aircraft, tools etc.
Also includes expenditure on new building and housing.
Approx. 15-20% – most volatile component of AE.
(Planned investment is the most volatile because of risk assessment and the business cycle (following trends), also profit is a large factor.)
Components of AE - Government
G1 – Current expenditure that provides for the day to day functions of governments such as government employee wages.
G2 – Capital expenditure to provide for future needs such as schools, roads, power, communication, dams.
Approx. 25%
(Government is fairly non-volatile because these programs are built in and they are not subject to a lot of change.)
Components of AE - Net Exports
The value of goods and services sold to overseas, minus the value of goods or services bought from overseas.
Approx. negative 1-2%
(Net Exports are fairly volatile as it relates to our economic growth and overseas’ economic growth.)
Factors affecting consumption
LE PIG
· Level of Disposable Income: the more money households have available to spend, the higher the consumption. E.g. higher income families have higher consumption rates as they have more money to spend on goods and services.
· Expectations: positive or negative expectations about the economy in the future will determine the level of consumption. E.g. a positive expectation will increase consumption of durable goods as the money spent can be justified.
· Personal Wealth: the wealthier a household feels, the more they will consume. E.g. holders of property and shares feel more wealthy so they will consume more.
· Interest / Cost of Credit: the increase or decrease of interest rates (therefore the cost of credit) will determine consumption. E.g. high interest = low consumption, low interest = high consumption.
· Government Policies: Fiscal Policy (taxation and govt spending through budget) affects disposable income levels which affects consumption. Monetary policies (RBA) affects interest rates and therefore cost of credit and money. E.g. taxation rates rise so consumption of taxed goods drops, unless they are inelastic.
Factors affecting Investment
GRIPE
· Government policies: fiscal and monetary policy affect business costs, government investment and subsidies can influence a business’ incentive to invest. E.g. taxation rates rise so business costs go up and investment opportunities decrease.
· Risk: investment rises and falls depending on perceived risk. Higher the risk the less likely the investment. Political decisions, international events, changes in consumer tastes all affect risk. E.g. Russia’s war with Ukraine has increased the risk of investing in oil and gas, therefore investment will fall.
· Interest rates: interest rates represent the opportunity cost of money so as they rise and fall the opportunity cost of investment does. E.g. interest rates fall so investment increases as the payments on loans and mortgages are smaller.
· Profitability: a firm won’t invest if the profit return is going to be low, so as profitability rises and falls so does investment. E.g. when profits are low a business will run old capital equipment into the ground instead of investing in new equipment.
· Expectations of businesses: what businesses think about current and future economic activity will affect their choice to invest. E.g. if consumption is high then firms will invest in more capital equipment to produce more.
Factors affecting government spending
BB
· Tend to be stable from year to year. Basic programs i.e. health and education cannot be changed much in real terms.
· Changes in the business cycle cause government as a macroeconomic managers to make discretionary changes in taxation and expenditure i.e. $42B Stimulus package in 2008-9.
· Some government vary in line with economic conditions. For example, in a trough welfare payments rise.
Factors affecting net exports
TEC DO
Terms of Trade: the value of the trade in terms of the ratio price of imports to exports will determine the export opportunities. E.g. if one unit of export can receive two units of import with the ratio, then net export will increase.
Exchange Rates: the value of the Australian dollar in comparison to other countries will impact net exports. E.g. the AUD and USD dollars are almost to the one so exchange is efficient and exports are high.
Commodity Prices: the price of the commodity being bought or sold will affect net exports. E.g. the price of oil is rising to import levels will drop.
Domestic Business Cycle: our stage in the business cycle will affect net exports as the amount of money in circulation is directly related. E.g. during a boom net export levels will be extremely high.
Overseas Business Cycle: net exports will be affected by international incentive to trade depending on their stage in their business cycle. E.g. if China enters a recession Australian imports will drop as their exports slow down.
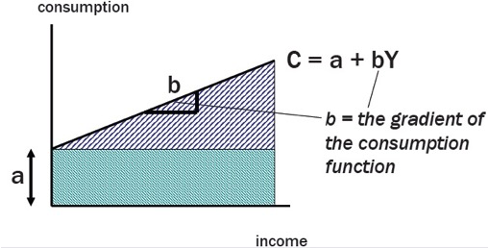
Consumption function
an economic formula that measures the relationship between income and total consumption of goods and services in the economy
· Consumption = a + bY
· a = autonomous consumption
· b = extra induced consumption that results from each extra dollar of income
MPC and MPS definition
Marginal Propensity to Consume (MPC): the proportion of each extra dollar of income spent on consumption
Marginal Propensity to Save (MPS): the proportion of each extra dollar of income that is saved
· MPC + MPS = 1
· Determines the gradient of the AE line
Multiplier (K): the final change in Real GDP will be bigger than the size of the spending change that caused it to happen.
· K = ____1____ = 1
1 – mpc (mps)
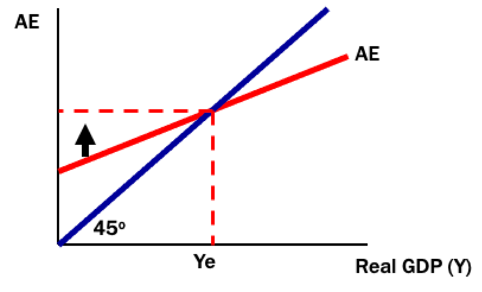
Equilibrium: where aggregate expenditure equals income
· Slope of AE determined by MPC, flat means MPC = 0, vertical means MPC = 1
· 45˚ line shows equilibrium points
AE will move up and down due to increases or decreases in the components of AE
AE will change slope due to a change in MPC
Aggregate Demand
the total amount of demand for final goods and services in an economy at any point in time.
Aggregate Supply
the total supply of goods and services available to a particular market from producers.
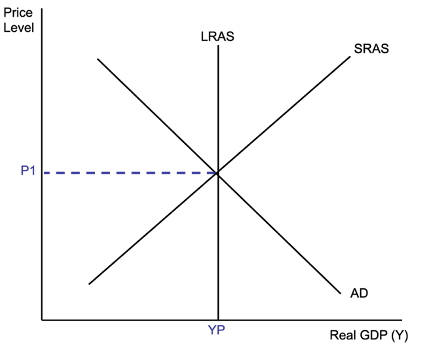
AD/AS Model
tells us about the economy’s internal balance, which focuses on:
· Level of GDP
· Inflation levels
· Unemployment levels
The model is made up of the AD curve and the SRAS curve, it also incorporates the LRAS curve.
If AD shifts to the right, then AD has increased and so has inflation and economic growth, unemployment has fallen.
If AD shifts to the left, then AD has decreased and so has inflation and economic growth, unemployment has risen.
If SRAS shifts to the right, then AS has increased and so has real GDP, inflation and unemployment rates have fallen.
If SRAS shifts to the left, then AS has decreased and so has real GDP, inflation and unemployment rates have risen.
Factors that affect aggregate demand and supply
Factors that affect demand: components of AE
Factors that affect supply: more resources, better quality resources and increased productivity
LRAS curve
The LRAS curve represents the maximum capacity of the economy, it is potential GDP, independent of prices.
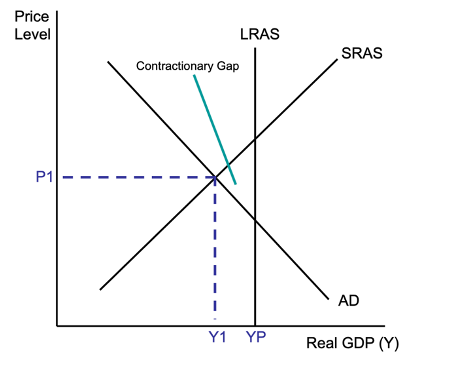
contractionary gap
Demonstrates short run equilibrium below potential output.
o AD intersects SRAS to the left of the LRAS curve.
o The contractionary gap is the distance between Y1 and Yp.
o In this situation, the economy is operating under capacity and unemployment will rise, investment falls, inventories rise, and inflation pressures are reduced.
Characteristics:
o Lower inflation rates.
§ Due to spare capacity in the economy.
o Higher levels of cyclical unemployment.
o A fall in the labour force participation rate.
§ Unemployed workers may feel they have less chance of finding a job.
o Lower company profits.
o Slower growth of consumer expenditure (especially on durables).
o Increased need for social security (Jobseeker allowance).
o Lower interest rates.
o A decrease in the current account balance.
Will decrease investment relative to savings.
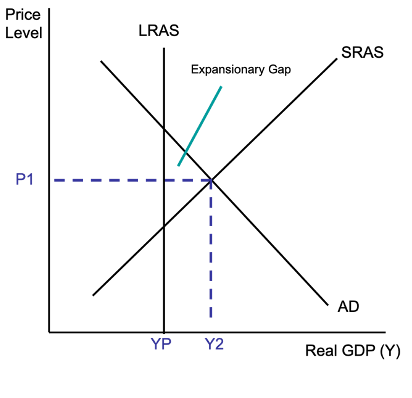
expansionary gap
Demonstrates short run equilibrium above potential output
o AD intersects SRAS to the right of the LSAS curve.
o The expansionary gap is the distance between Yp and Y2.
o In this situation, the economy is operating over capacity and unemployment will be low, wages will rise, and there may be production bottlenecks that increase prices.
Characteristics:
o Wage inflation if there is a tight labour market (competition for workers).
o An increase in the participation rate.
§ People expect they will be able to find a job if they seek work.
o Lower levels of cyclical unemployment.
§ Consumer demand for goods and services is high, so firms needs to employ labour to produce those goods and services.
o An increase in company profits and business confidence.
o Increased consumer confidence and sales of consumer durables and luxury items.
o Reduced need for cyclical welfare payments such as unemployment benefits (Jobseeker).
o The current account balance will increase.
§ Investment increases relative to savings.
Economic growth
the increase in capacity for an economy to satisfy the wants and needs of its members.
Economic Objectives of the Government
Sustainable Economic Growth, Price Stability, Full Employment (low unemployment), Equitable Resource Distribution, Efficient Resource Allocation
Objective - Sustainable Economic Growth
Objective: sustainable economic growth – economic growth that doesn’t compromise future generations.
Indicator: Real GDP.
Target: 3-3.5% real GDP per annum.
GDP: the total amount of final goods and services produced in an economy over a period of time (usually 1 year).
Real GDP: GDP taking out inflation.
Problems when objective is not met:
Too high: high rates are unsustainable as they put pressure on factor markets and risk driving up prices (demand-pull inflation).
Too low: slow growth means there is insufficient demand to fully employ resources.
Objective - Price Stability
Objective: price stability – low levels of inflation.
Indicator: CPI (Consumer Price Index).
Target: 2-3% CPI per annum on average over the course of the business cycle.
Problems when objective is not met:
Too high: decreases purchasing power of household incomes, feeds into higher interest rates (decreases investment), decreases confidence, decreases international competitiveness (if domestic inflation rates exceed overseas rates), causes structural change in the economy (switch to machines which are more cost effective), and increases taxation and government revenue.
Inflation - Headline, Underlying, Demand-pull, Cost-push
Inflation: the persistent and appreciable rise in the general level of prices
Headline inflation: inflation that includes all items in the CPI.
Underlying inflation: inflation with volatile items removed (e.g., fresh food and petrol).
Demand-pull inflation: when there is too much demand chasing too few goods.
Cost-push inflation: when rising input prices are passed through to consumer prices.
Objective - Full Employment (Low unemployment)
Objective: low unemployment – when everyone who is willing and able to work can find a job.
Indicator: Unemployment rate.
Target: 4.5% unemployment rate.
Unemployment: when a person is willing and able to work but cannot find a job.
Cyclical unemployment: follows the phases of the business cycle.
Structural unemployment: occurs when there is a mismatch of available and required skills in a sector of the economy.
Frictional unemployment: occurs when workers are transitioning between jobs and have a temporary period of unemployed.
Unemployment rate: the % of the labour force not employed.
Full employment: when there is no cyclical unemployment.
Underemployment: people who hold a paid job but would like more hours.
Natural rate of unemployment: the lowest rate of unemployment that can be achieved without inflationary pressure developing.
Problems when objective is not met:
Too high: a direct monetary cost arises because high unemployment results in lower levels of aggregate consumption, investment and business confidence, and increases the welfare payments paid to the unemployed.
Over the long term, persistent unemployment reduces economic growth because the capacity of the economy to satisfy future wants is reduced.
Also has personal and social costs.
Economic cost of unemployment is modelled by the ‘GDP gap’.
Objective - Equitable Income Distribution
Objective: a more equitable distribution of income – increased equitable income distribution without reducing the incentive to work.
Indicator: Gini coefficient.
Target: by-product of achieving other objectives.
Equity: fairness of the distribution of income and wealth.
Equitable distribution of income: a fair (not always equal) final distribution of personal income, so that all can access basic goods and services.
Problems when objective is not met:
Only problems are social (big gaps between poor and wealthy etc).
Objective - Efficient Resource Allocation
Objective: efficient resource allocation – using resources as productively and efficiently as possible.
Indicator: multi-factor productivity.
Target: as high as possible.
Productivity: the quantity of goods and services the economy can produce with a given amount of inputs such as capital and labour.
Efficiency: the ability of an economy to achieve the maximum level of output for a given quantity of inputs.
Multi-factor productivity: refers to the quantity of output produced in a production process per combined input of labour and capital per unit of time.
Problems when objective is not met:
Will decrease productivity which can then decrease the LRAS (in the long term).
Complimentary Objectives Examples
Economic growth and full employment.
Growth creates more demand for goods and services- more demand for resources used in production (derived demand).
Economic growth also improves material welfare, so AD will rise- expand output and employment.
Policies to achieve lower unemployment also promote growth- higher levels of unemployment reduce the ‘GDP gap’- economy is operating near full capacity.
Full employment and equitable income distribution.
Policies designed to lower unemployment should lead to a more equitable income distribution because work provides households with the income to consume, save, and built wealth.
Price stability and economic growth.
Keeping inflation low is important for promoting sustainable growth.
Low inflation reduces uncertainty, encourages investment in productive activities and assists international competitiveness.
Efficient resource allocation and economic growth.
Efficiency and productivity are the driving force in increasing LRAS.
Improved efficiency lowers supply costs and reduces inflationary pressures.
Conflicting Objectives
Price stability and full employment.
Policies to reduce demand pull inflation generally aim to reduce the level of economic activity- reduces business activity and investment- less demand for labour- decreases unemployment.
Reducing unemployment by expanding economic activity puts pressure on available resources and prices- increases inflation.
Economic growth and price stability.
A booming economy places demand pressure on resources (especially if there is no excess capacity)- this is inflationary because competition for resources pushes up their prices in factor markets.
Economic growth and structural unemployment.
Growth is associated with structural change- involves the rise of some sectors of the economy and the decline of others- structural change impacts the labour market and long-term unemployment.
Economic growth and equitable income distribution.
Although economic growth increases incomes, it doesn’t increase them equally.
People employed in the expanding sectors and owners of appreciating assets (e.g., property and shares) tend to gain more.
Policy objectives of RBA
1) The stability of the currency of Australia.
o ‘Currency stability’ refers to price stability (not exchange rate stability).
o The RBA follows the objective of 2-3% CPI over the course of the business cycle.
2) The maintenance of full employment in Australia.
o Achieving the natural rate of unemployment (cyclical unemployment = 0).
3) The economic prosperity and welfare of the people of Australia.
o This means the achievement of rising living standards in the long term (economic growth), along with the management of the business cycle through monetary policy (interest rates or ‘cash rates’).
Types of Time Lags effecting economic objectives
Time lag: the period from the time a macroeconomic problem is recognised, and the time policy action is taken and has effect.
Recognition lag: the time taken for change to show in economic indicators.
Decision (implementation) lag: the time taken for policy settings or stance to change.
Effect (impact) lag: the time taken for the economy to actually change.
Policy | Institution Responsible | Instrument | Impact |
Monetary policy
|
RBA |
Cash rate |
Aggregate demand |
Fiscal policy |
Treasury
|
Gov spending and taxation (budget) |
Aggregate demand |
Competition and Industry policy | Productivity Commission and Federal Government |
Government laws and regulations |
Aggregate supply |
Exchange rate
the value of one country’s currency expressed in terms of another country’s currency. Can be expressed bilaterally, comparing two currencies to one another, or be measured multilaterally, by means of the trade weighted index.
trade weighted index
The Australian dollar trade-weighted index (TWI) is the price of the Australian dollar in terms of a group (or ‘basket’) of foreign currencies based on their share of trade with Australia. While bilateral exchange rates are the most frequently quoted exchange rates, the TWI provides a broader measure of whether the Australian dollar is appreciating or depreciating against the currencies of its trading partners.
New weights for the Australian dollar TWI will apply from 21 December 2023. The weights are based on the composition of Australia’s merchandise goods and services trade for the 2022/23 financial year. The updated TWI includes a group of 17 foreign currencies. This is the same number of foreign currencies as in the previous TWI; however, the Canadian dollar replaced the Swiss franc. The Chinese renminbi continues to have the largest weight in the TWI. Changes in individual currency weights were within +/– 1¼ percentage points.
Floating exchange rate
A floating exchange rate is a regime where the currency price of a nation is set by the forex market based on supply and demand relative to other currencies. This is contrary to a fixed exchange rate, in which the government or reserve bank entirely or predominantly determines the rate.
Appreciation vs depreciation
Appreciation: rise in the value of one currency in terms of another. Result of an increase in demand for AUD or a decrease in supply in forex market.
Depreciation: fall in the value of one currency in terms of another. Result of a decrease in demand for AUD or an increase in supply in forex market.
Factors that affect demand for AUD
Credit entries in BOP (g/s exports, income flows, transfers in, capital outflows, financial inflows (debt, foreign direct investment)
demand for aus exports
speculation in currency markets
foreigners paying debt to australians
rba intervention
income flows to aus from overseas assets
Factors that affect supply of AUD
Debit entries in the balance of payments: g/s imports, income outflows, transfers out, capital outflows, financial outflows (debt, foreign investment)
level of aus investment overseas
speculation in currency markets
australian foreign debt payments
Why does Australia need foreign debt?
As a resource rich country with a relatively high demand for capital and a small population, foreign investment fills the gap between what Australia saves and invests every year. Australia's national investment and saving gap has been on average about 4 per cent of GDP over the last few decades.
Total investment is usually funded by a combination of domestic savings and foreign investment. Australia has, however, recently flipped from being a net overseas borrower to a net lender.
At the end of 2021, total investment flows stood at $497 billion, comprising $571 billion in domestic savings and -$74 billion in foreign investment (ABS, National Accounts).
Without foreign investment Australia would be unable to build our economy to its full potential and would have less funds available to spend on hospitals, schools, roads and other government services
Foreign investment
the movement of money between countries for the purposes of borrowing and lending, or purchasing and selling assets.
foreign assets
the stock of australian investment in other countries
foreign liabilities
the stock of foreign investment in Australia
Global Interdependence
Linkages between economies through trade, investment, tourism, and immigration. Interdependence refers to two or more countries that impact and rely on each other, while globalisation is the economic, social, and political interaction and integration of people in different areas of the world. Nowadays, most nations are interdependent and related in a globalised world.
Global Trade Patterns
Trends in international trade showcasing the distribution of goods and services
International Competitiveness
the ability of a country to compete successfully against other countries in international trade.
Determinants of International competitiveness
· Changes in labour productivity (due to factors such as technology, education and training).
· Changes in country’s price level (inflation) relative to its trading partners.
· Changes in a country’s wages relative to its trading partners.
· Changes in the exchange rate.
What are the four main channels across which economies are linked?
Trade, Investment, Tourism, Immigration
Discuss the four main channels across which economies are linked: Trade
· Trade:
o International trade simulates economic growth and expands the global economy.
o It creates jobs, raises income and increases living standards.
o It also creates a greater choice of goods and services for consumers and producers at lower prices.
Discuss the four main channels across which economies are linked: Investment
o Foreign investment between countries allows economies to expand especially countries like Australia that have a smaller savings base and require additional funding
When foreign investors start firms in a host nation, they frequently export goods and services to make money elsewhere. This can lead to a more favourable trade balance by offsetting the cost of imports. Access to Global Markets: Businesses in source nations might use FDI to expand their global reach.
Discuss the four main channels across which economies are linked: Tourism
o Movement of people between countries for recreation.
o Tourists spend significant amounts of money in the countries they visit.
o Tourism now accounts for 30% of worlds exports of commercial services.
Discuss the four main channels across which economies are linked: Immigration
o Immigration allows countries to bring in people who can provide specialised skills that can be useful within the economy.
Australia’s place within the global economy
· Exports contribute to 23% of Australia’s GDP
· 24% of Australian workers are directly involved in trade related activities
· Foreign investment supplement domestic savings to help fund economic development
· Around 30% of the Australian population was born overseas
Globalisation Extent
The degree of openness in international borders for trade, investment, and technology flows
Globalisation Facilitators - TTMC
· Trade
· Technology
Advances in transport and communication have decreased the impact of distance between countries
o Transport costs and travel time have fallen helping to boost the volume of merchandise trade and increase tourist travel to record numbers
o Advances in information technology have enabled the growth of trade in services such business services like accounting, marketing and IT support
· Multinational Corporations
o These firms establish production and/or retail and distribution facilities in other countries
o Multinational firms expand into foreign countries to increase their sales, profits, and market shares
o Examples: Facebook, Apple, Nike and Microsoft from the US, Toyota and Sony from Japan, Samsung and Hyundai from South Korea, Volkswagen from Germany and BHP and Rio Tinto from Australia
· Communication and Transport
Globalisation Advantages vs Disadvantages
Advantages | Disadvantages |
Higher living standards | Environmental damage |
More goods and services | Use of child labour |
Greater variety of goods and services | Loss of culture |
Higher employment and incomes | Uneven distribution of gains |
Access to foreign investment | Loss of economic control |
Gains from trade | Spread of pandemics |
Increases cultural awareness |
|
Promotes peace between countries |
|
Trade Benefits
Advantages like job creation, income growth, and increased consumer choice
Composition of Global Trade
· International trade can be trade in goods (merchandise trade) and trade in services.
· Trade in physical goods accounts for 76% of trade.
· Trade in services account for 24% of trade.
· United States, China and Germany are the worlds three largest economies and account for 30% of merchandise exports.
· China is the world’s largest exporter.
· United States is the largest importer.

Tourism Impact
Economic benefits from visitor spending, contributing significantly to global services exports
Immigration Benefits
Bringing skilled individuals to enhance a country's workforce and economy
Global Trade Composition (goods vs services %)
Division of trade into goods and services, with goods dominating at 76% and services at 24%
Manufacturing Exports as a proportion of international trade
53% of global exports, a significant portion of international trade
Fuels and Mining Exports as a % of international trade
12% of global exports, contributing to the energy and resource sectors
Agricultural Exports
10% of global exports, showcasing the importance of food production
Services Exports
24% of global exports, highlighting the growth in service-based economies
Trade Correlation with GDP
Positive relationship between trade and GDP per capita, indicating economic growth
Global Trade Trends
Increase in trade as a percentage of GDP, influenced by global organisations and policies - · World trade (exports plus imports) as percentage of GDP increased from 38% in 1991 to 60% by 2019. Over that time GDP per capita doubled.
International Competitiveness
the ability of a country to compete successfully against other countries in international trade.
International Competitiveness Determinants
· Changes in labour productivity (due to factors such as technology, education and training).
· Changes in country’s price level (inflation) relative to its trading partners.
· Changes in a country’s wages relative to its trading partners.
· Changes in the exchange rate.
Tariff
Tax on imports to increase domestic competitiveness and government revenue
Specialisation and Trade Overview
· Countries specialise in producing goods and services that they are best a producing and then trade the surplus
· Specialisation is possible because resources and quality of resources differ between countries
· Countries benefit from trading the surplus of their specialised good because with that money they can purchase imports of goods and services that they are less efficient in producing, and then have a larger quantity of both
o Absolute advantage: when a country can produce a good or service at a lower absolute cost per unit than another country
o Comparative advantage: when a country can produce a good or service at a lower opportunity cost than another country
Sources of comparative advantage
· Quantity and quality of labour resources
· Quantity and quality of natural resources
· Quantity and quality of capital resources
· Level of technological progress
o Examples include Australia with iron ore and coal, Germany with motor vehicles, US with software and the entertainment industry, and China with clothing and electronics
Australian Sources of Comparative Advantage:
· Australia is a significant exporter of primary commodities (minerals and agricultural products)
· It is also a significant importer of manufactured goods and financial capital (money and other forms of funding)
· Australia’s annual GDP is over $2 trillion which makes Australia a medium sized open economy (is open to the movement of goods, services and capital in and out of the country)
Importance of International Trade to Australia
· Trade equates to 46% of GDP
· Increases real GDP, income and living standards
· 20% of Australian workers are employed in trade related industries
· Australian consumers have access to a wider range of goods and services at a lower price
· Imports reduce production costs
· Overseas competition forces Australian firms to become more competitive
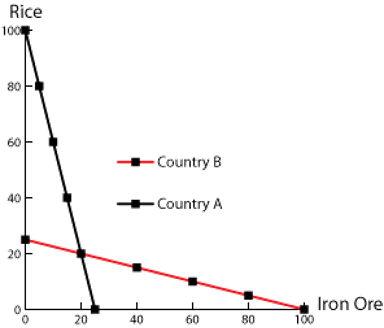
Production Possibility Frontier in terms of trade
· Demonstrates comparative and absolute advantage between two countries producing two products
· Data from these models is what is used to show gains from specialisation through ratios of opportunity cost
· The model has 4 assumptions:
o The world consists of two countries
o Each country produces and consumes two goods
o Resources are perfectly mobile
o Transport costs are not considered
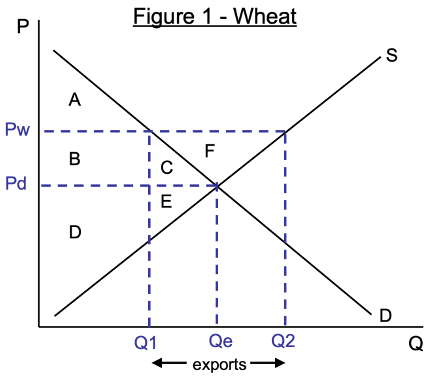
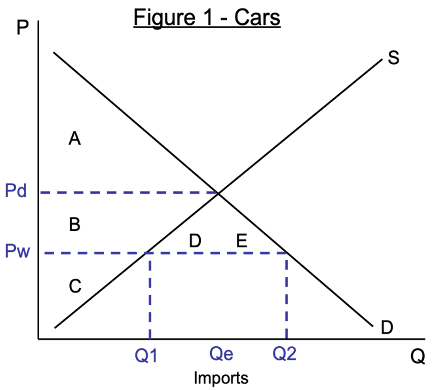
Gains from Trade (Exports)
· Gains from exporting can only occur when the world price (Pw) is above the domestic price (Pd)
· When at equilibrium the quantity being demanded and supplied is Qe and the good or service is being sold at the domestic price (Pd)
· When domestic producers decide to sell their product or service at the world price internationally (for a higher price) then domestic demand decreases from Qe to Q1, but the producer’s supply increases from Qe to Q2 to make more revenue
· The difference between Q1 and Q2 is the quantity of exports that producers with sell overseas
· Domestic producers are the group that gains from exports as their producer surplus increases from D, E to D, E, B, C, F
· Domestic consumers are the group that loses from exports as their consumer surplus decreases from A, B, C to just A
Gains from Trade (Imports)
· Gains from importing can only occur when the world price (Pw) is below the domestic price (Pd)
· When at equilibrium the quantity being demanded and supplied is Qe and the good or service is being sold at the domestic price (Pd)
· When domestic consumers decide to buy the product or service internationally at the world price (lower price) then domestic demand increases from Qe to Q2, but domestic producers lose competitiveness and their supply decreases from Qe to Q1
· The difference between Q1 and Q2 is the quantity of imports bought from overseas
· Domestic consumers are the group that gains from imports as their consumer surplus increases from A to A, B, D, E
· Domestic producers are the group that lose from imports as their producer surplus decreases from B, C to just C
Protection
any action taken by the government designed to give a domestic producer an artificial advantage over an international producer
· This will increase production in protected industries and decrease consumption of imported goods and services
· Owners and workers in protected industries gain whilst other industries and consumers lose as they now have to pay higher prices
· Forms of protection include:
o Tariffs
o Subsidies
o Quotas
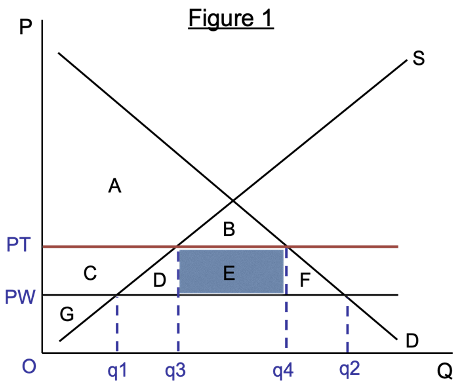
Tariff diagram
· When a good or service is imported at the world price, consumer demand is high at Q2, but domestic producers are not as competitive with international producers so supply is low at Q1
· The government installs a tariff to support these domestic producers and earn revenue themselves, they raise the price from PW to PT which is now the price plus the tax on the selected imports
· With the tariff instated, demand for imports falls due to the higher price and decreases from Q2 to Q4, this means domestic producers gain competitiveness and their supply increases from Q1 to Q3
· Consumer surplus decreases from A, B, C, D, E, F to just A, B and then producer surplus increases from just G to G, C
· E represents the revenue made by the government which is the tariff price x the difference between Q3 and Q4
· D and F are deadweight losses of consumer surplus and are due to underproduction
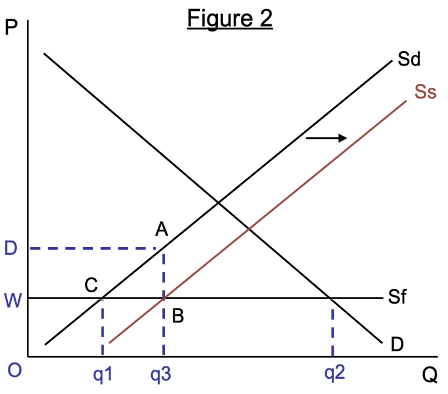
Subsidy Diagram
Subsidy: grants or payments made by the government to domestic producers. A subsidy enables a domestic producer to sell their product at a lower price to compete against imports.
· When a good or service is imported at the world price, consumer demand is high at Q2 and domestic producer supply is low at Q1
· The government grants a subsidy to support these domestic producers so they can sell their products at a cheaper price to be competitive with foreign suppliers (Sf), this moves Sd to the right to Ss
· This increases the supply domestic producers can hold from Q1 to Q3 as demand for the good or service remains high at Q2 just some of it now turns to domestic producers because of convenience.
· D, A, C, W is the producer surplus that has been granted as a result of the subsidy
· D, A, B, W is the cost of the subsidy to the government which is the cost of increasing Sd to Ss
· The cost of the subsidy exceeds the increase in producer surplus by the region of A, B, C which is a deadweight loss of money that the government could have spent elsewhere in the economy
Consumer Surplus
Consumer surplus is the difference between willingness to pay for a good and the price that consumers actually pay for it. Each price along a demand curve also represents a consumer's marginal benefit of each unit of consumption.
Producer Surplus
The benefit producers receive above their cost
Deadweight Loss
Loss of economic efficiency due to underproduction or overproduction
Subsidy
Cash payments by the government to suppliers that reduce their costs. The effect of a subsidy is to increase supply and therefore reduce the market equilibrium price.
Anti-dumping Argument
Protection against foreign firms selling at abnormally low prices.
o Dumping is when an international firm sells large amounts of stock at abnormally low prices to drive out domestic producers and competition
o Protection like tariffs would reduce the effects of this international strategy as domestic consumers don’t receive those abnormally low prices and domestic producers can remain competitive
o In 2015 China dumped steel into the U.S. manufacturing market, reducing the competitiveness of U.S. steel producers drastically, the U.S. government then introduced a 500% tariff on imported Chinese steel
Infant Industry Argument
New industries need protection until they grow competitive
o It is argued that newly developing industries need protection until they can grow to develop their own comparative advantage, this argument was used in the favour of the Australian manufacturing industry
o Protection like subsidies for these new industries would let them become competitive with international producers, like the subsidies the government provided Holden and Ford to manufacture cars in Australia
Diversification Argument
Need to diversify industries to reduce economic vulnerability
o If a country completely applied the idea of comparative advantage and then all resources were employed in the desired industry, fluctuations in prices would greatly affect the country’s economy
o For this reason it benefits a country to diversify their industrial base, and protection will be necessary to increase the competitiveness of these new industries so the level of protection can be reduced
o For example, Australia has a comparative advantage in mineral and agricultural exports and therefore specialises in it, for a long time the Australian government subsidised the car manufacturing industry in Australia so that if something ever happened, there would be other export options (a backup plan)
National Security Argument
Protection for goods crucial to national defense and security
o If importing a good or service could lead to issues surrounding national defence and security, protection policies will be introduced such as a heavy tariff or large subsidy to cause a good or service to be produced domestically.
o An example is the U.S. importing microchips from Taiwan, recently Taiwan is at risk of being invaded by China and since China is an enemy of the U.S., protection policies have been put in place to bring the production of microchips to domestic producers
Increased Employment Argument
Tariffs and subsidies to boost domestic employment
o If tariffs are placed on imported goods or services, and subsidies are given to domestic industries, consumers will shift their interest towards domestic producers, increasing demand for the same goods and services and therefore employment requirements
o An example of this is when Australia had a car manufacturing industry, the Australian government heavily subsidised companies like Holden and Ford so they could continue to produce in Australia with the intention of increasing employment opportunities
Cheap Foreign Labour Argument
Tariffs to protect domestic wages from foreign competition
o If another country can produce a good or service for a cheaper price due to cheaper labour costs and this reduces competitiveness of domestic manufacturers, governments will introduce tariffs on these imported goods and services in an attempt to protect the minimum working wage in their country and a certain standard of living
o For example, China is unrivalled in the manufacturing industry due to its cheap labour costs, countries like Australia cannot remain competitive so they place tariffs on imported Chinese goods and services so that domestic producers do not go under and reduce employment opportunities or reduce wages
Favourable Balance of Trade Argument
Promoting trade surplus by protecting local businesses
o The favourable trade balance is a surplus, meaning that exports outweigh imports and a country makes profit of trade, this would require protection of local businesses so that instead of importing goods and services, consumers can buy domestically and help create a trade surplus
o An example of this is the U.S. government’s $74.6 billion budget deficit, as per this argument, the U.S. government should protect domestic producers and therefore reduce U.S. consumers import quantities
Dumping
Selling large stock at low prices to eliminate competition.
Arguments for Trade Liberalisation: Incomes and Living Standards
o By liberalising trade, demand increases for domestically produced goods and services from international consumers and supply increases for domestic producers as their market has expanded
o This leads to companies being able to pay higher wages and generate more employment opportunities as they have to meet increased demand requirements and they also generate more profit
o This increases living standards as the minimum wage will increase, and so will economic freedom
Arguments for Trade Liberalisation: Increases efficiency through competition
o By liberalising trade, domestic markets begin to compete against other economic markets at the world price, this competition creates incentive for increased efficiency and cheaper production so that consumer purchases are not lost to overseas producers
o For example, Australia is a global leader in mineral exports due to its unrivalled efficiency, this developed due to international competition and threat of a loss of competitiveness due to other mining nations like Africa and South America
Arguments for Trade Liberalisation: Increases productivity via efficient resource allocation
o Trade liberalisation is based on the theory of comparative advantage and countries specialising in the production of specific goods and services, by doing so that country is performing at their highest level of productivity to produce the highest quantity of their specialised good or service, to do this they must allocate their resources efficiently
o For example, Australia’s mining industry is globally unrivalled due to its extreme developments in technology and therefore efficient allocation of their available resources