Module 5: Multiple Regression Assumptions
1/19
Earn XP
Description and Tags
In-person lecture covers 50% of content
Name | Mastery | Learn | Test | Matching | Spaced | Call with Kai |
|---|
No analytics yet
Send a link to your students to track their progress
20 Terms
Explain the underlying assumptions of regression*
Regression assumptions are actually made about the
Residuals
I.e. The e in the regression equation
Why do we test assumptions on the residuals rather than the data?
Because we cannot do anything directly to the residuals (error) as it is what is left over after the line
Think: If there is a lot of error, our model probably sucks. We’re running the assumption tests on the residuals because if the error is too crazy, then we might not be measuring the right population or our model just doesn’t work.
Assumptions not met = model is shit
Regression (linear) will still ‘work’ for nonlinear relationships but….
Interpretations of parameters on face value may be meaningless
Describe the assumption of normality
Residuals (errors) are normally distributed around a mean of 0
Centred around 0, being the mean score
Assumption of regression
Think: If everyone did a stats exam and the error was not normally distributed with a mean of -5, it might suggest that the test itself was too hard and therefore results can’t be interpreted as the knowledge of 3rd year stats students. Maybe the test was for honours students.
Homoscedasticity
Constant variance of residuals across predicted scores
When residuals are correlated with predicted scores
Random error is observed
No important predictors have been left out
Indicated by rectangular shape
Assumption of regression
Independence of errors
The residuals are uncorrelated with Y
If it is correlated with Y then it is not error, and it has tapped into a another construct that was not considered.
Think: Imagine you are trying to predict house prices (criterion) using variables of square footage, number of rooms and year the house was sold (predictors). A factor that has not been considered is inflation, economic state and demand for housing which would influence price and likely cause error stemming from the year the house was sold. If you plotted error/residuals for the year the house was sold, you would see a positive association between error terms and house price, in that as year increased, so the did the price of houses and thus the error margins increased.
Linearity of the relationship
Regression models are linear (think: line of best fit), therefore you can’t interpret data that is not linear.
Assumption of regressions
Assumptions for checking residuals
Normally distributed
Homoscedasticity
Independence of errors
Linearity
The regression equation of Y = Y’ + e states that the actual score from a regression is the sum of the predicted score plus the error.
Explain what the error refers to.
The residual
Variance that is not explained by the model
Not everyone’s scores are going to be the same
The only way this would be possible would be if the data had a perfect correlation (± 1).
Think: Someone with perfect knowledge of the exam content but missed 1 slide in the mini lecture, so they got that one question wrong.
If the regression equation has underestimated the actual score, the residual will be…
Positive
The the regression equation has overestimated the actual score, the residual will be…
Negative
In a multiple regression, should you use residual e or Zresid to run assumptions?
Z scores
Converts them all to the same unit therefore residuals are proportionate to each other
Use SPSS syntax
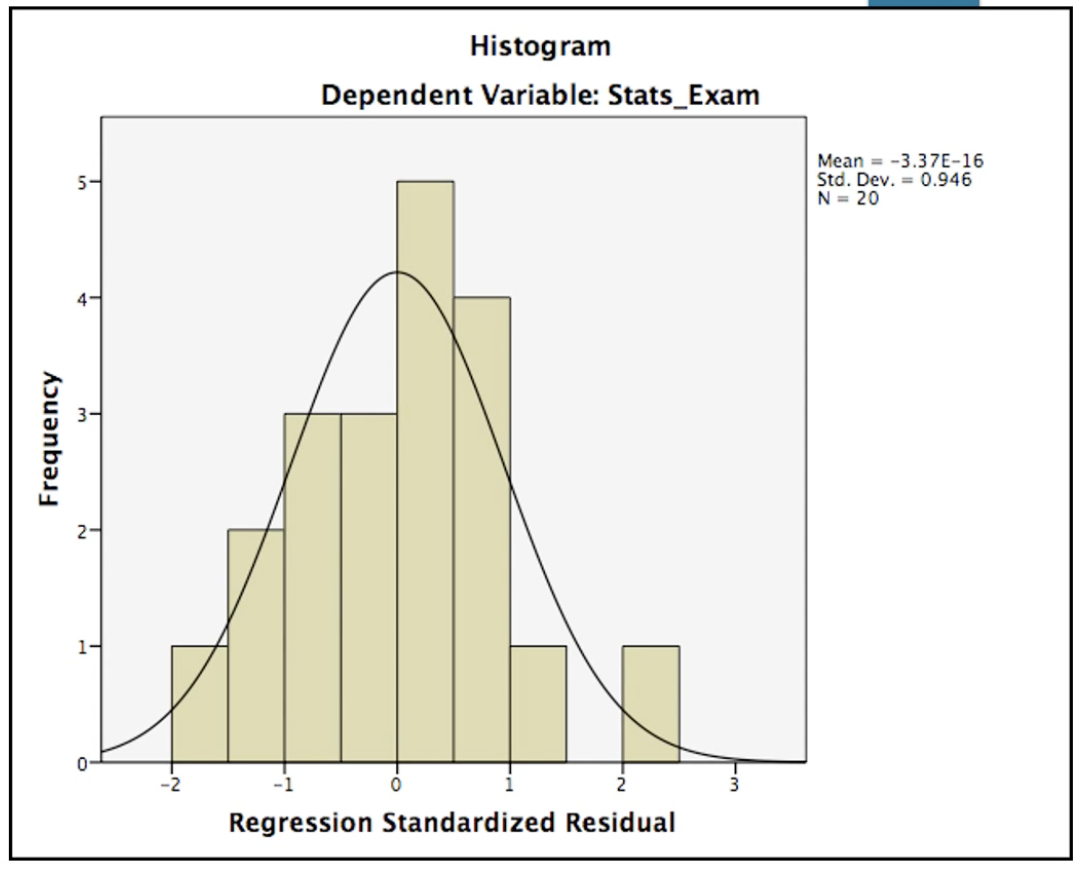
What assumption is being tested here, and has it been met?
Normality
Yes - residual means are centred around 0
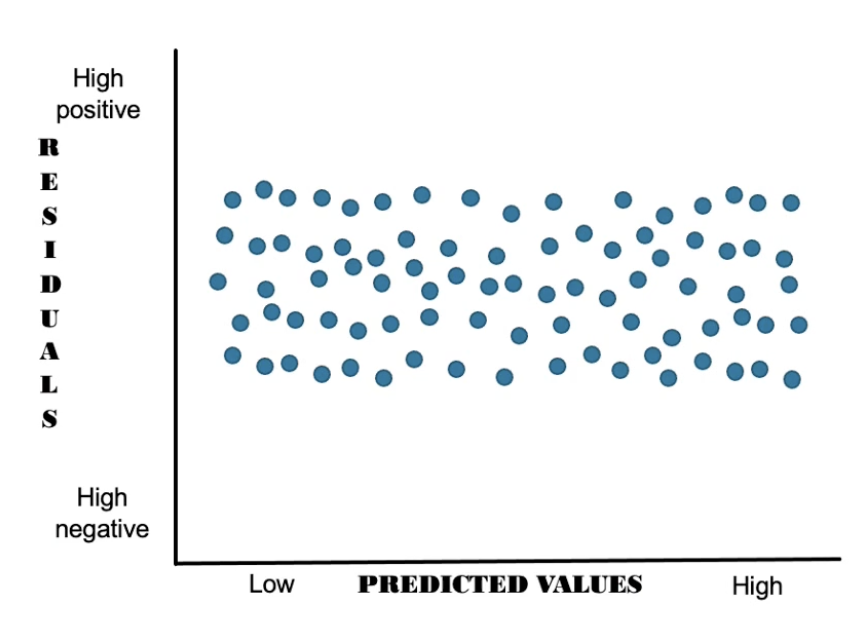
What assumption is being tested here, and has it been met?
Homoscedasticity
Yes - takes on a rectangular shape
Small variance around zero on the Y axis (in the middle) and evenly scattered above and below
Think: Homoscedaddle = skinny rectangle centred at 0
In homoscedastacity, the larger the range on the Y axis…
The worse the prediction
What does a non-significant test of homoscedastacity look like?
A funnel or a fan
Shows the distribution of residuals across the range of predicted values of Y is not even
May suggest there is worse prediction at low/high predicted values of Y
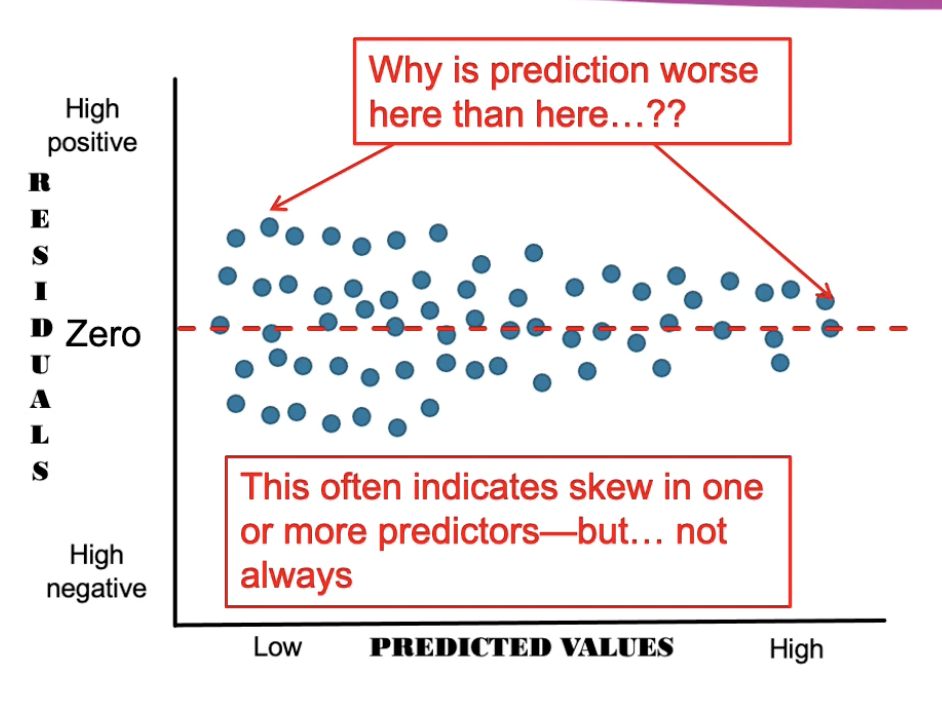
Interpret this
Homoscedastacity is not met
Funnel shaped
The model has greater predictive value at the higher predicted values of Y, as indicated by the lower variability around zero on residuals (Think: narrow rectangle)
The model has less predictive value for lower scores of Y and there is more variability of residuals at this point
If assumptions of regression are not met, what approaches can be taken that don’t involve using a whole different statistical procedure?
Removing outliers
Apply transformations to the data
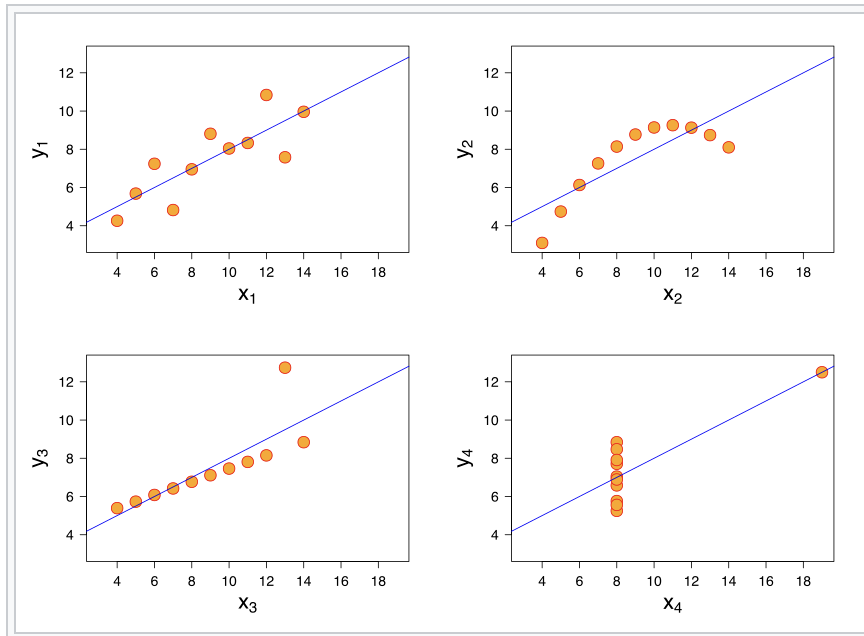
Anscombe’s Quartet
Refers to 4 datasets that illustrate how characteristics such as non-linearity and outliers can seriously distort our interpretations of correlation and regression statistics.
Show that we cannot have confidence in the numerical statistics without examining the visual form of the underlying data
Also shows the importance of looking at the data visually instead of just chasing assumptions as we need to know why a dataset is distributed that way.
The 4 datasets have identical descriptive stats (to 1 dp), though one is linear, one has outliers, curvilinear and one is non-linear with an outlier.