Predation
1/31
There's no tags or description
Looks like no tags are added yet.
Name | Mastery | Learn | Test | Matching | Spaced | Call with Kai |
|---|
No analytics yet
Send a link to your students to track their progress
32 Terms
true predator
true predator (predator) kills its prey immediately upon capture, more or less
exploitation and food webs
exploitation moves energy through food webs
prey evolutionary responses to predation (ANIMAL defenses against predation)
chemical: producing chemicals poisonous to predators
physical: e.g. shells, speed
aposematism: warning colors, sounds, etc. that this prey will not be tasty
crypsis: camoflauged colors, shapes
mimicry: mimicking a species that predators avoid via look, sound, etc.
behavioral: behaving in ways that minimize risk from predation
aposematism
warning colors, sounds, etc. that this prey will not be tasty
Example: monach butterflies, red dart poision frog
crypsis
camoflauged colors, shapes
Example: peppered moth, octopus, stick insect, dead leaf praying mantis
mimicry & types
Looking, sounding, or in other ways mimicking a species that predators avoid
Mullerian Mimicry:
Different species mimic each other’s warning signals.
These species are harmful or don’t taste good, honest warning to predators
All species benefit
teaches predators to avoid species
example: monarch and viceroy butterflies orange and black colors are toxic to birds
Batesian Mimicry:
harmless species mimics harmful species
harmless species benefits
may not benefit harmful species because of predators consume the harmless species and find that the warning signal isn’t accurate, they’ll consume more of the actually harmful species
example: mimic octopus can impersonate many species, like venomous lionfish and seasnakes
example: king snake (mimics venomous coral snake) and coral snake
example: NOT the monach and viceroy butterflies because recently foudn that viceroy butterflies are actually toxic too.
behavioral??
behaving in ways that minimize risk from predation
safety in numbers
example: school of fish, meerkats
crypsis??
camoflauged colors, shapes
disruptive coloration - blurs the outline of an animal with a strongly contrasting pattern
e.g. zebra, Dory fish (blue tang)
Lotka-Volterra predator-prey models
isocline: a curve where all points along the line have the same slope
α: capture efficiency. the larger α means a single predator has a larger effect on prey growth rates
b: conversion effiency. larger b means the good source is more valuable
m: mortality rate
prey isocline
the predator population at which the prey’s population growth rate is zero
assumptions of Lotka-Volterra model
Pretty Sunsets Inspire Everyone (PSIE)
• Growth of the prey population is only limited by the predators
• The predator is a specialist and can only eat that prey species
• Individual predators can consume an infinite number of prey
• Predators and prey encounter each other randomly in a homogenous environment (evenly spread out and well-mixed)
no emigration or immigration for both, predator individual can catch and eat prey instantaneously, no crowding effects (no density dependence)
how predators move
stalk
pursuit
ambush
random encounter
stalk vs. ambush: stalk means hide until can get close enough to pounce, ambush means wait in a spot and hope a prey comes along
lynx and snowshoe hare graph
follow cyclic patterns. both peak and sharply decline about every 10 years at slightly non-overlapping intervals (there’s a delay in response time)
a gap or delay between prey and predator peaks
growth of predator population lags behind growth of the prey population because the abundance of prey stimulates predator population growth
why don’t lynx completely wipe out hares? how do prey population persist in presence of predators?
r
can mean intrinsic growth rate or per capita growth rate
intrinsic growth rate (exponential growth): population growth rate for a population with unlimited resources
per capita growth rate:
idk wtf
exponential growth equation w/o predators
dN/dt = rN (how fast the pouplation size is changing)
less than 0: pouplation is shrinking
prey growth equation w/ all variables (Lotka-Volterra)
variables are:
r: intrinsic growth rate of prey population
encounters between predators and prey
encounter term: NpredatorNprey
as number of predator/prey increase, prey growth decreases, and vice versa
searching efficiency (attack rate) a
how efficient the predator is in finding, attacking, and consuming
larger a means more efficient
prey consumption rate = a x encounter term (rate where predator and prey encounter one another)
dNprey/dt = rpreyNprey - aNpreyNpredator
predator growth equation w/ all variables (Lotka-Volterra)
variables like
conversion factor b: convert the encounter rate into number of new predators produced
only 10% of the energy in a consumed item is transferred between trophic levels
predator death m (mortality)
dNpredator/dt = abNpreyNpredator - mNpredator
cycling in graphs
growth of predator population lags behind growth of the prey population because the abundance of prey stimulates predator population growth
we see predator and prey population cycles because as prey populization drops, predators have less food to eat, causing predator population to drop. drops fast enough that prey pouplation recovers and starts to grow again with fewer predators, cycle repeats
deterministic vs stochastic
Lotka Volterra equations are deterministic: tell you exactly what will happen because of parameter values. cycles are the same, extinction can’t happen
stochastic: models that include randomness. extinction can happen
what would lead to extinction?
high predator efficiency and high prey reproduction because highly unstable and if populations plumment to 0, no recovery
ecology of fear
hare have an easier time finding food when they’re not scared of predation
e.g. behavioral cascades, top-down effect like wolf-elk-aspen
density dependence
effect of density-dependent factors depends on population size
e.g. disease, competition for food, parasitism, predation
metapopulations
spatially distinct subpopulations of the same species that are connected via dispersal
the whole system persists overtime, even though individual populations can go extinct
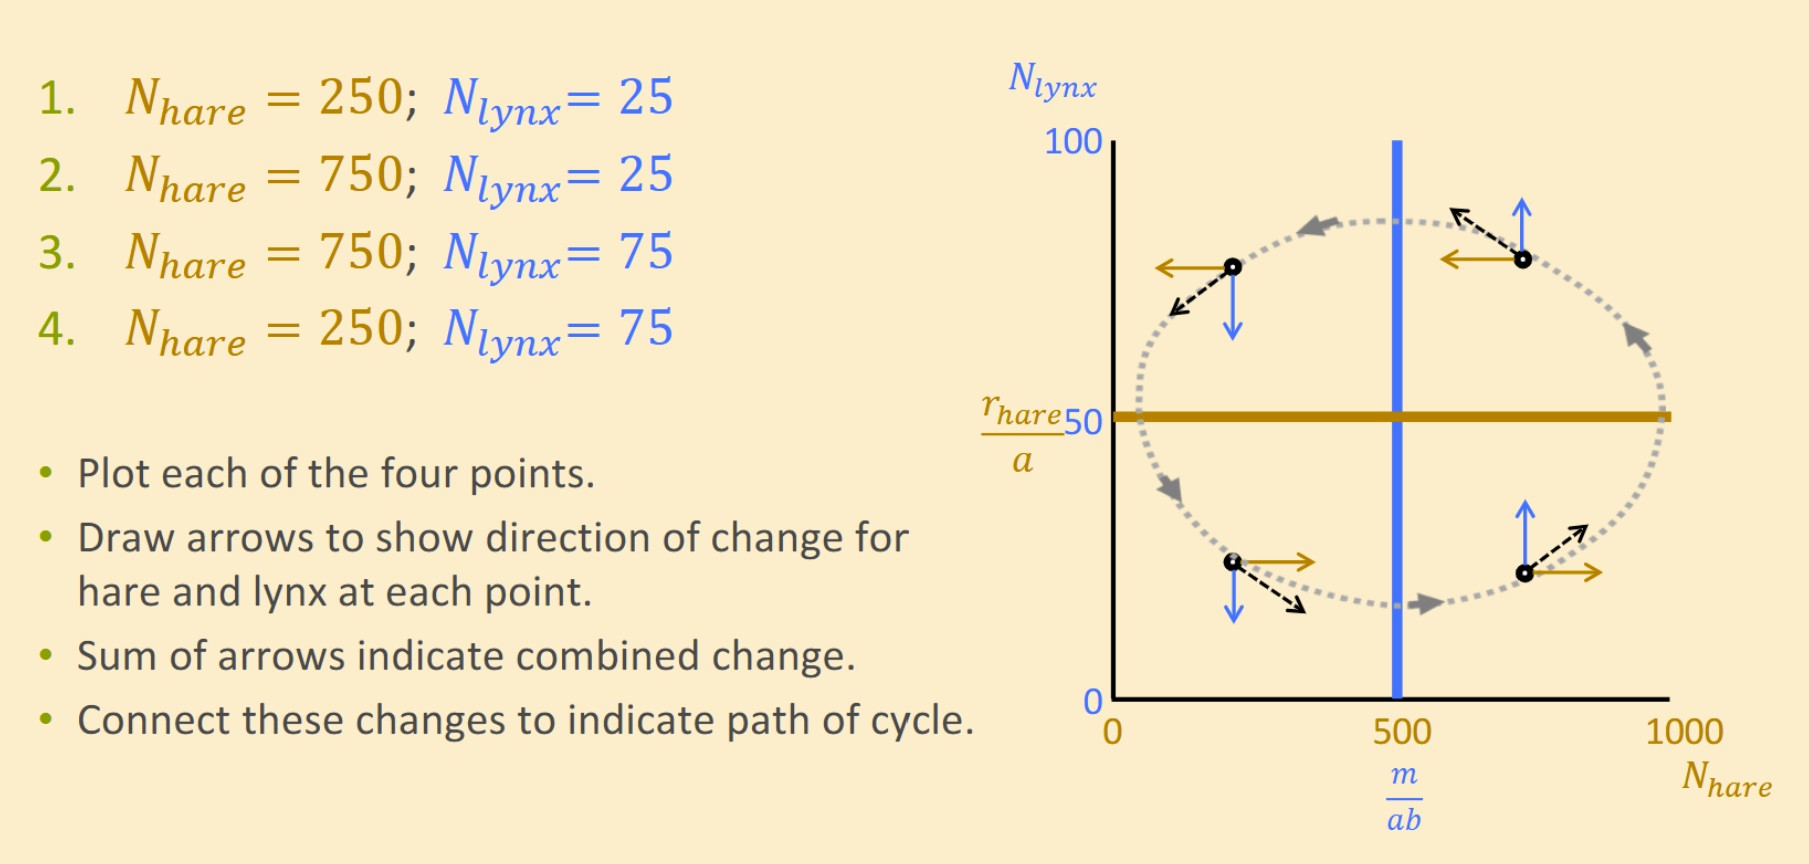
phase plane
The x-axis = prey population (often NNN)
The y-axis = predator population (often PPP)
instead of plotting population vs. time, you plot predator vs. prey. You can “see” how predator and prey populations rise and fall together without explicitly looking at time.
Each point represents a state of the system (a specific prey and predator population at a moment)
as time evolves, for the classic Lotka–Volterra model, these trajectories form closed loops → indicating cyclical population dynamics
zero growth isoclines
lines where the growth rate of one population is zero.
Prey Zero-Growth Isocline
prey population is not changing:
This is a horizontal line in the phase plane.
Below the line: prey population increases ↑
Above the line: prey population decreases ↓
Predator Zero-Growth Isocline
This is where predator population is not changing:
This is a vertical line in the phase plane.
Left of the line: predator population decreases
Right of the line: predator population increases ↑
Last graph shoes combined trajectories of both prey and predator
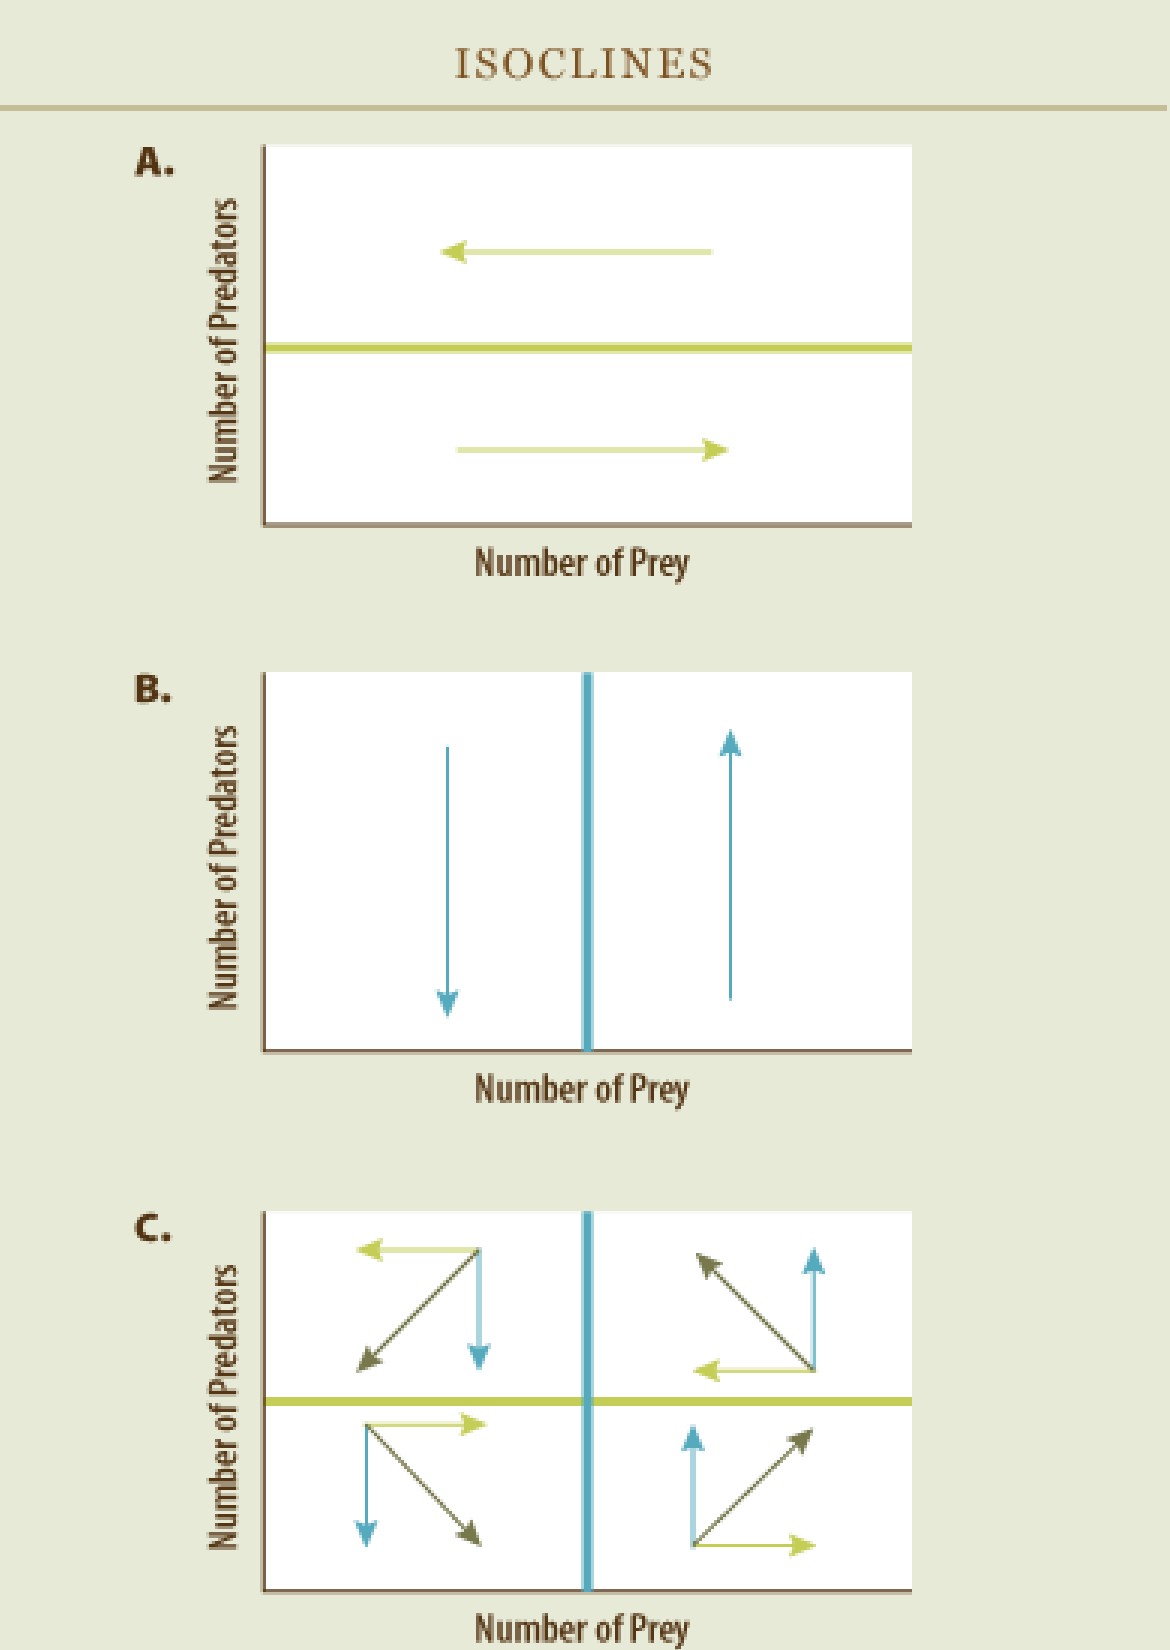
equilibrium point
intersection of both isoclines (the prey and predator isocline)
around this point, the system cycles
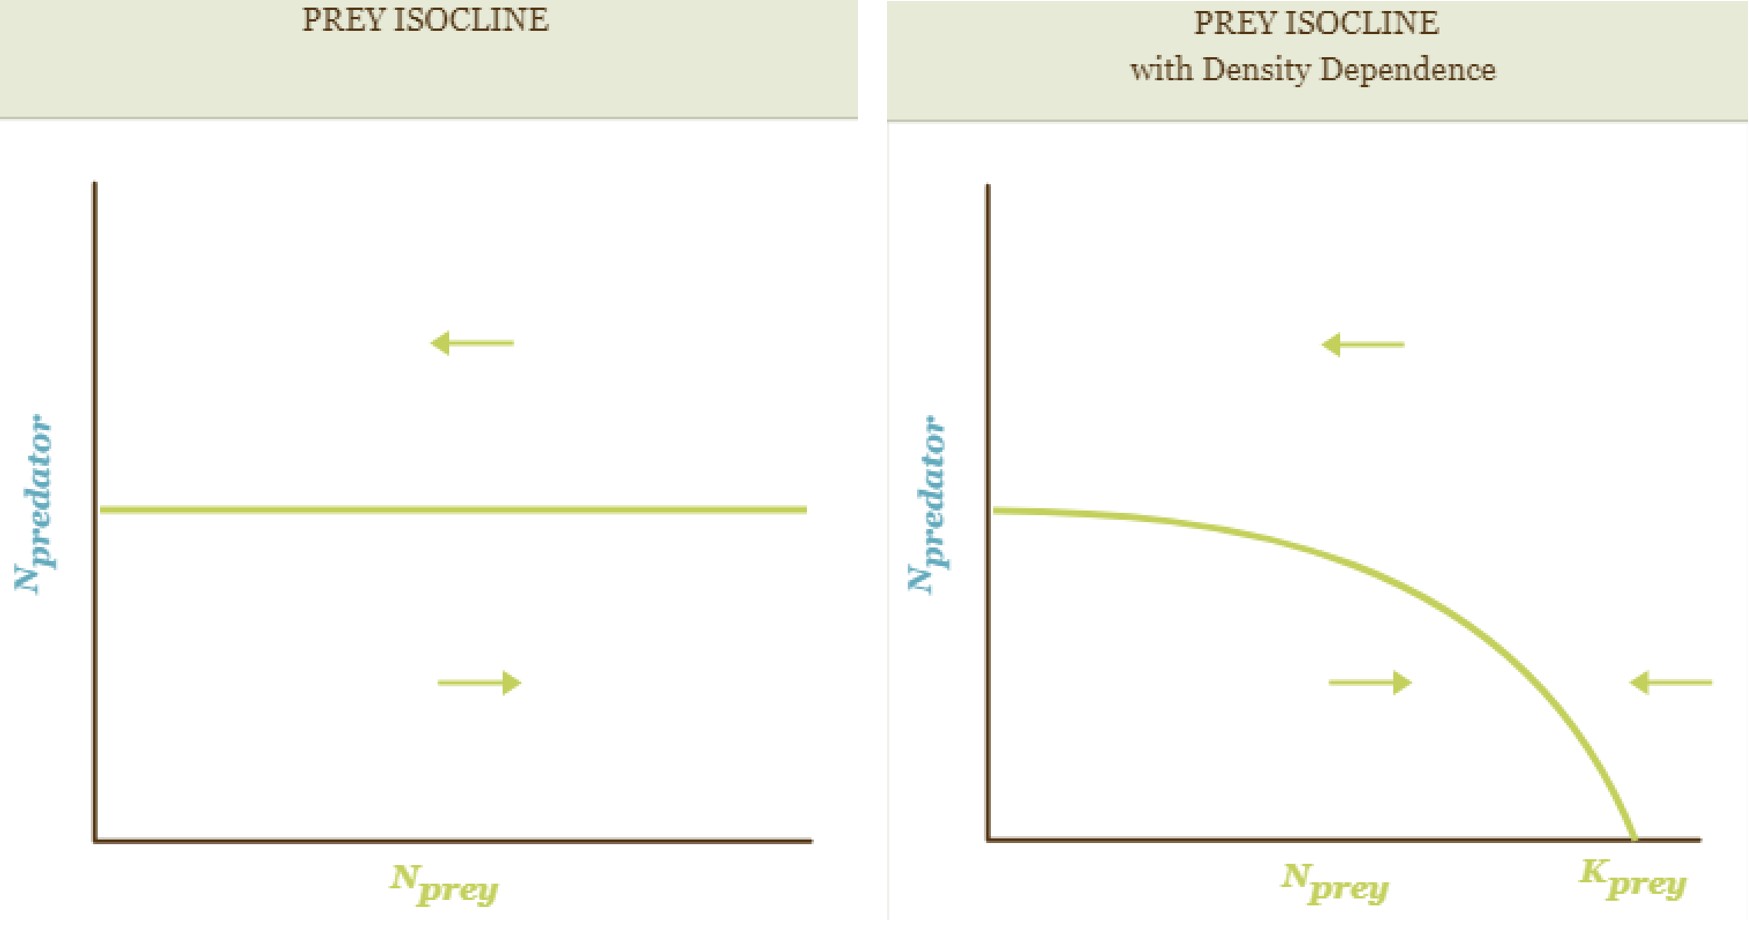
density dependence & prey isoclines
Lotka Volterra assumes that prey has unlimited food. but in real life, there is limited food and prey population would reach carrying capacity. so a prey zero-growth isocline, if accounting for carrying capacity K, would change the line so that it goes down and reaches 0 (intersecting Nprey axis at Kprey)
so accounting for carrying capacity, less predators are needed to restrict further prey population growth because now carrying capacity plays a role
THIS MAKES SENSE because after the carrying capacity, when # of predators decreases, # of prey is also decreasing
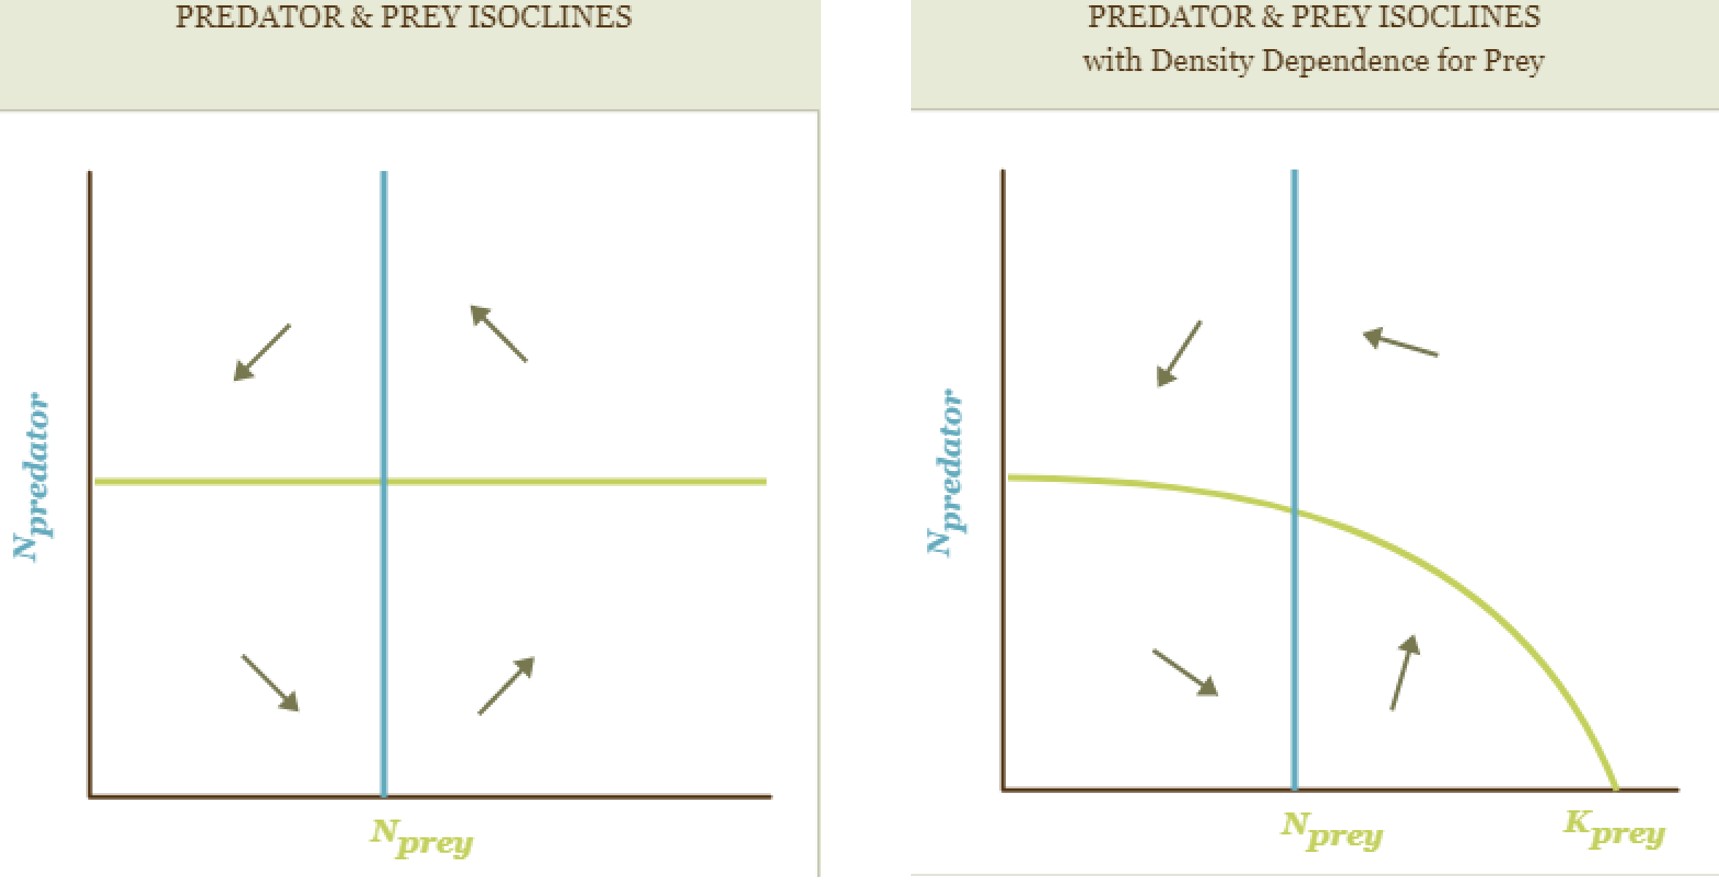
density dependence for combined isocline trajectories
when density dependence is factored in, combined trajectories turn inwards (arrows point counterclockwise)
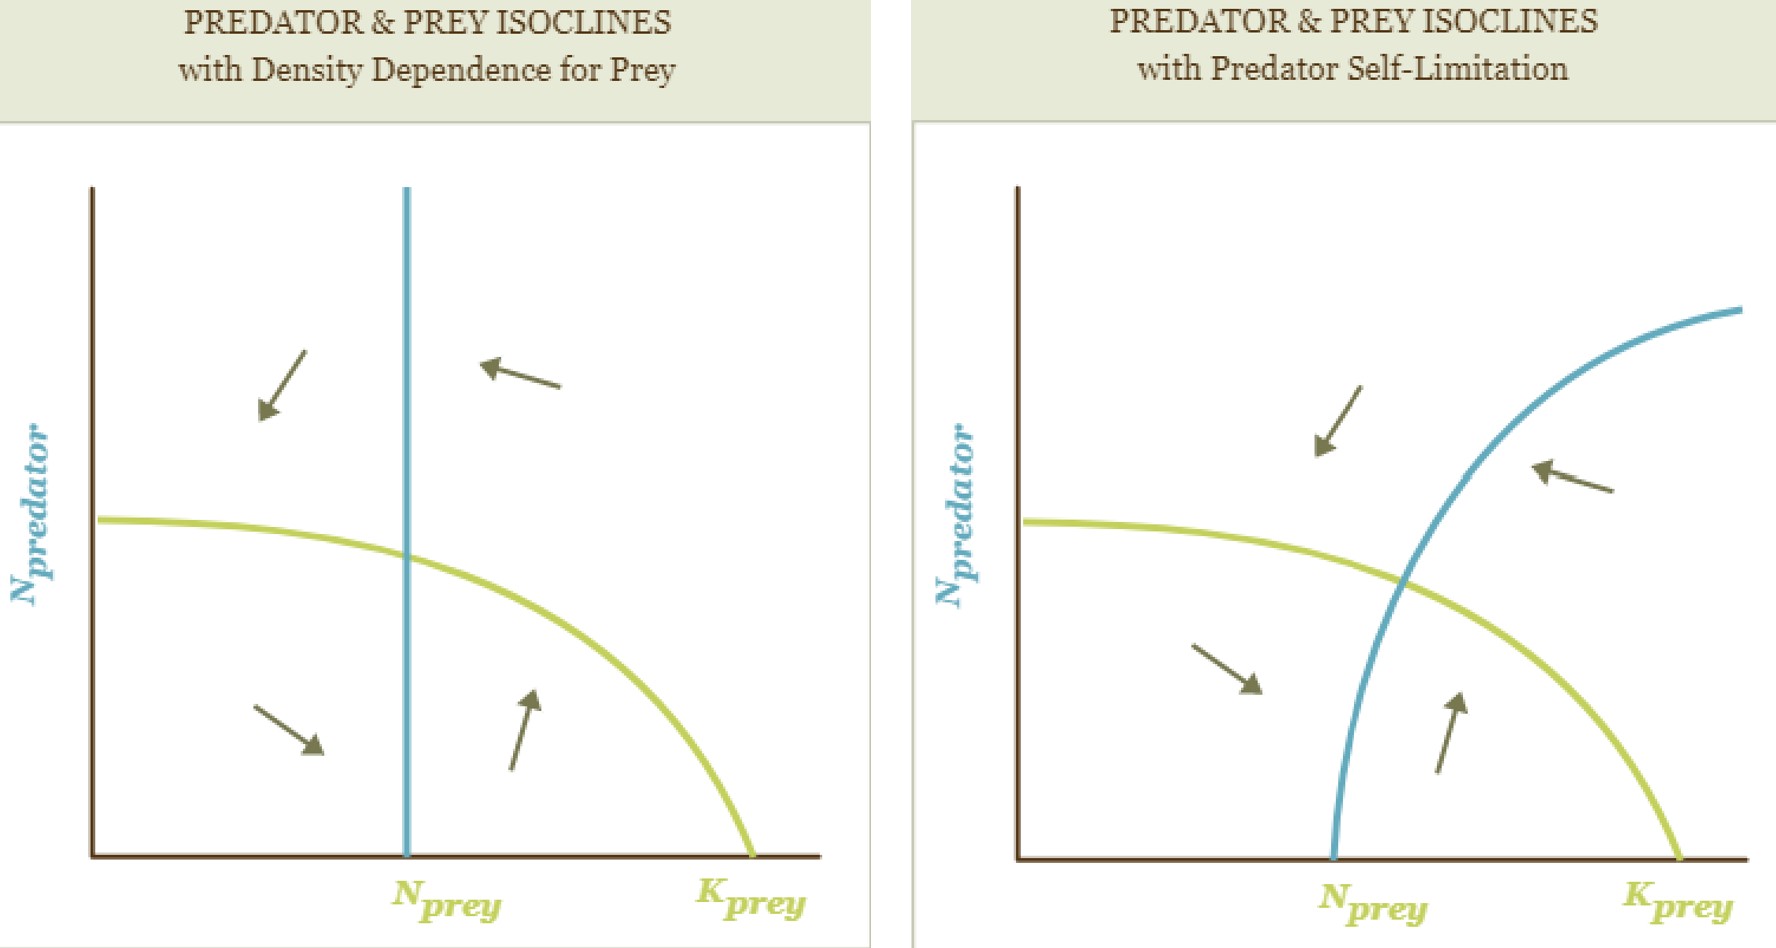
self-limitation and growth isocline
predators experience self-limiting factors like territorality, interference competition, home range size
when accounting for self-limiting factors, the predator isocline bends to the right like the beginning of a rainbow.
this changes the combined trajectories by moving the first 3 arrows closer to the center in terms of both x- and y- direction, arrow shape stays the same angle
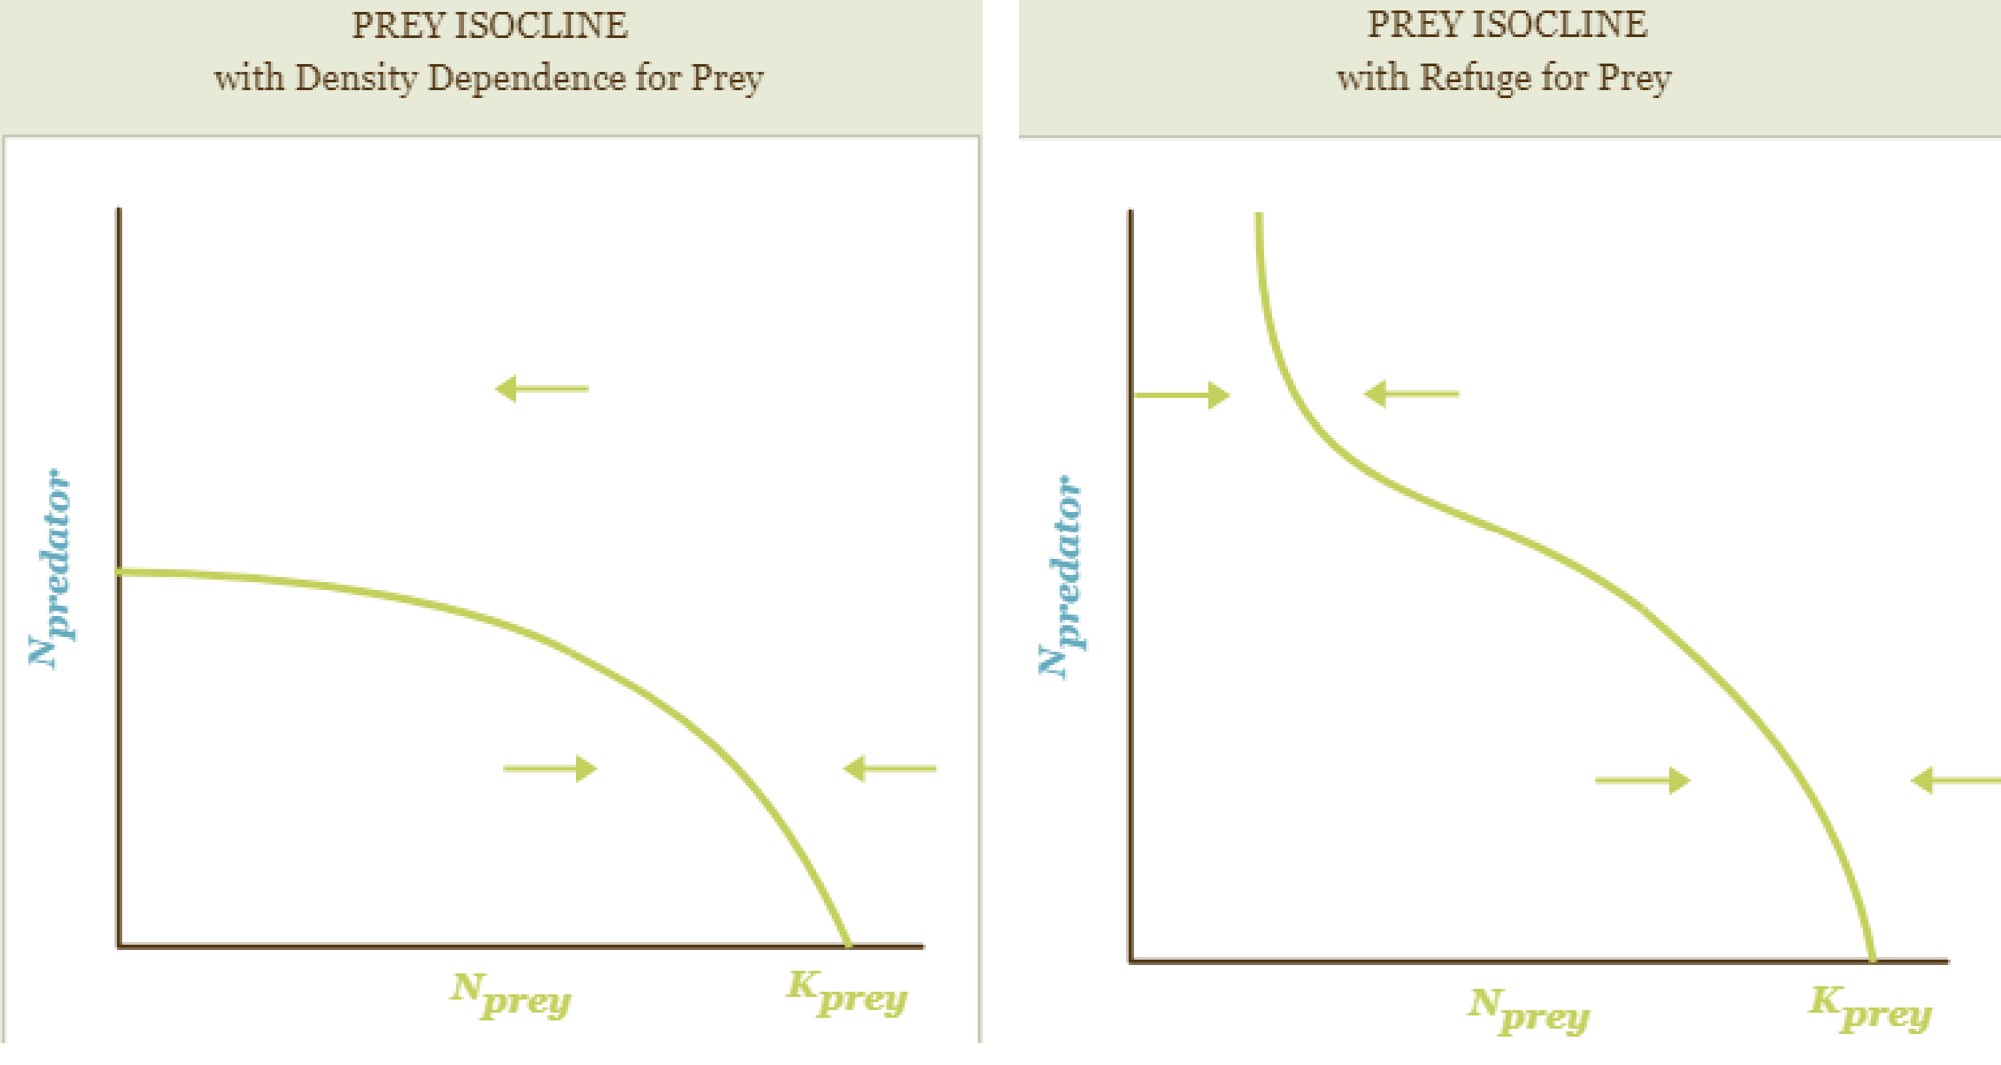
prey isocline with density dependence and refuge
Lotka-Volterra assumes homogenous environment. but there are shrubs hares can hind behind, which affects predator searching efficiency
accounting for refuge creates an S shape
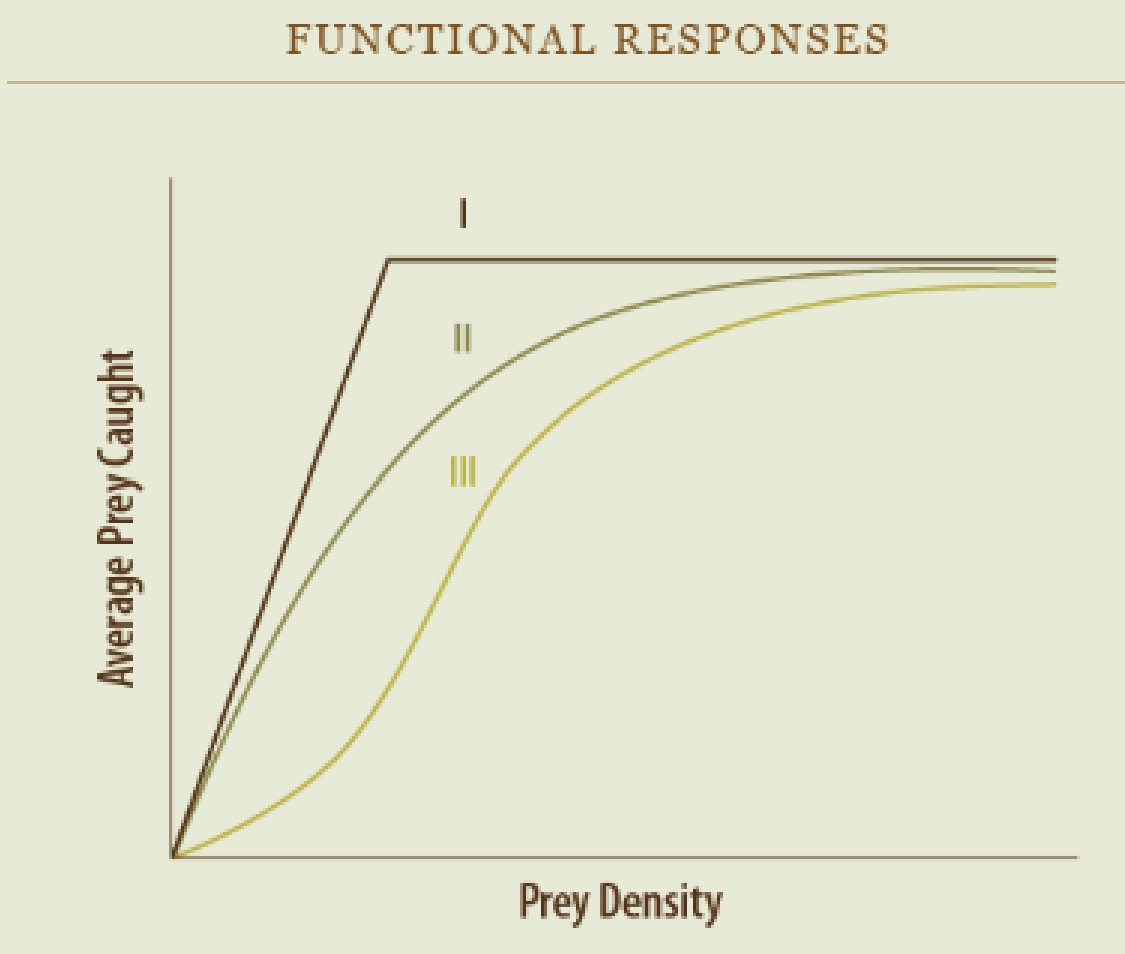
Functional Response Curve
prey density vs. average prey caught
Type I: linear increase until maximum threshold where it levels off because predator is full. handling time is so minimal that a predator can keep up with increasing prey density, always being ready to eat the next prey when it’s found. if prey doubles, consumption doubles. rare, e.g. spiders trap whatever flies into their web
Type II: rate of prey consumption does increase with prey density, but NOT linearly; more like a curve. as prey densities increase, consumption rate gets smaller and levels off. this is because of handling time: the time it takes to kill and consume a prey. most common, e.g. lynx and hare
Type III: S-shape. low prey density, slower increase in predation rate. predators need to learn how to catch or do not switch to this prey until higher density. at higher density, predation rate increases then levels off. e.g. seal and salmon
red queen hypothesis
species that evolve fast enough to keep up with their enemies’ evolution will persist longer. continuously co evolve
e.g. eucalyptus evolved to be toxic and low in nutrition, but koals evolved to diget eucalyptus
sexual reproduction has benefits because even though it’s costly because it allows for recombination and speeeds up evolution. so gives offspring higher chance of having novel combination fo alleles that facilitate success in a changing environment