Chapter 4: The Market Forces of Supply and Demand Practice
1/16
There's no tags or description
Looks like no tags are added yet.
Name | Mastery | Learn | Test | Matching | Spaced | Call with Kai |
|---|
No study sessions yet.
17 Terms

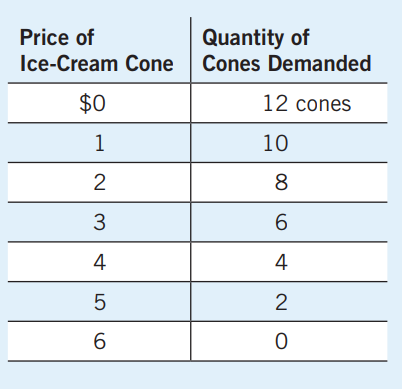
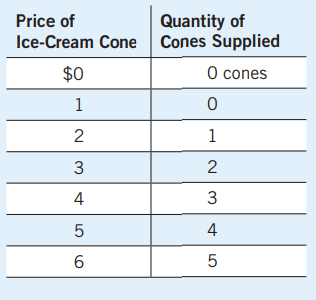
Plot the Demand Schedule Given the Demand Curve

Sketch the Demand Curve Given the Demand Schedule
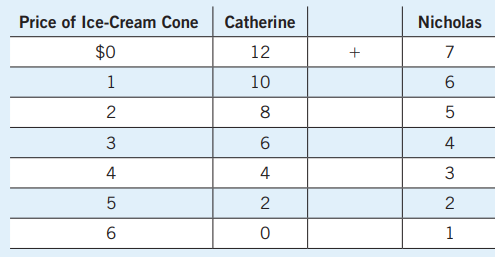
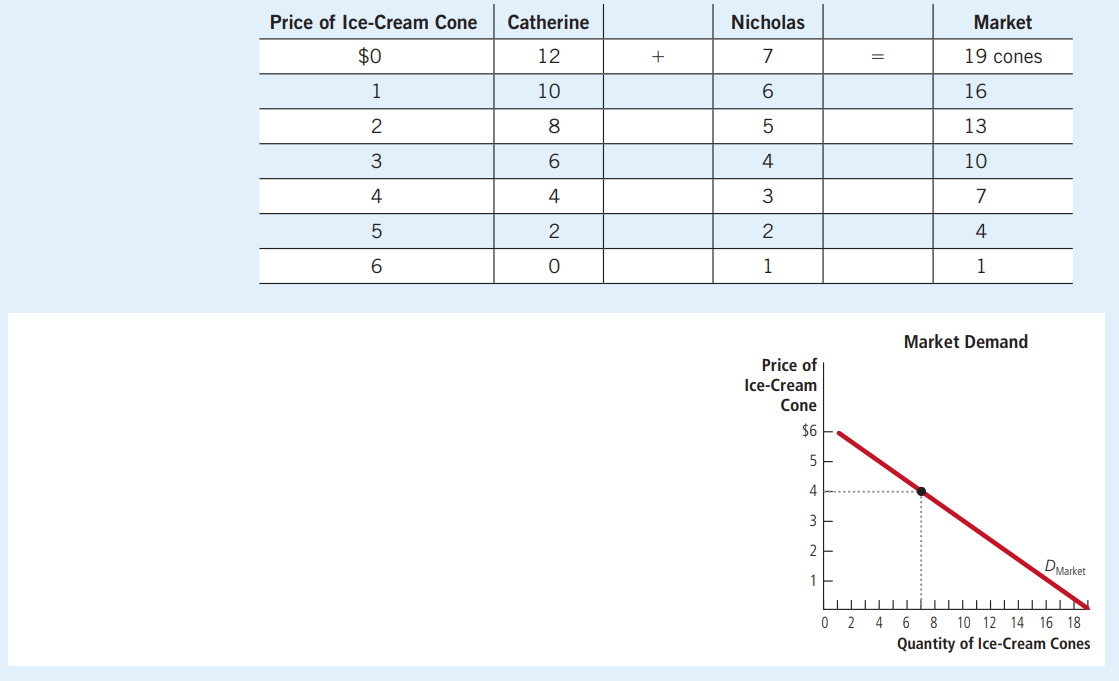
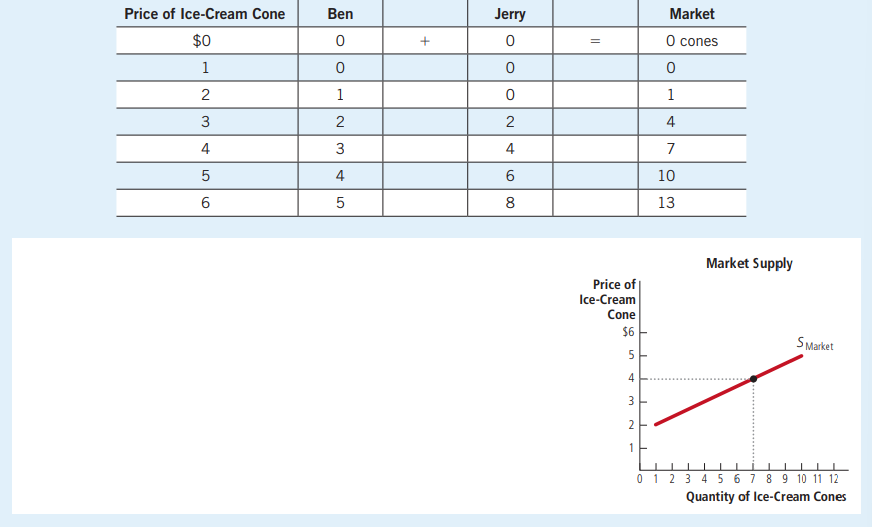
(1) Calculate Market Demand
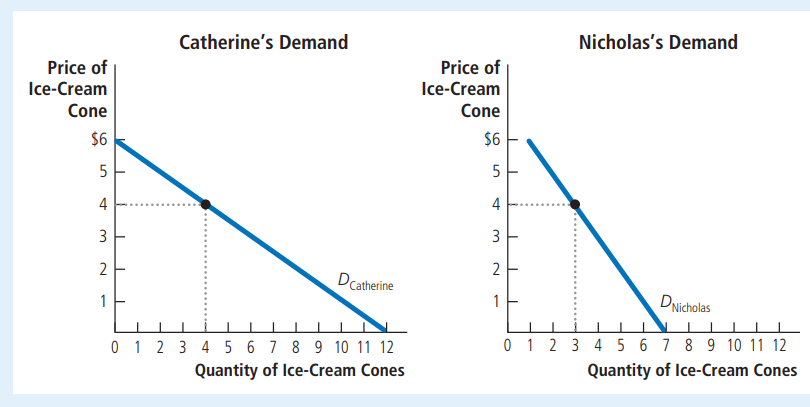
(2) Sketch Catherine’s Demand Curve
(3) Sketch Nicholas’ Demand Curve
(4) Sketch the Market Demand Curve
(1) Set Up Catherine’s Individual Demand Schedule
(2) Set Up Nicholas’ Individual Demand Schedule
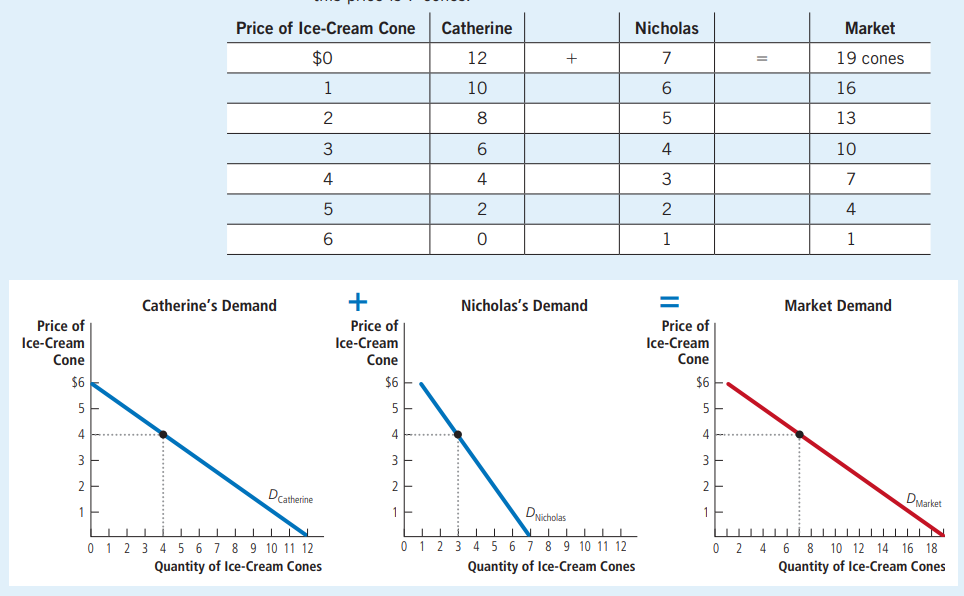
(3) Set Up Market Demand Schedule and Calculate Market Demand
(4) Sketch the Market Demand Curve
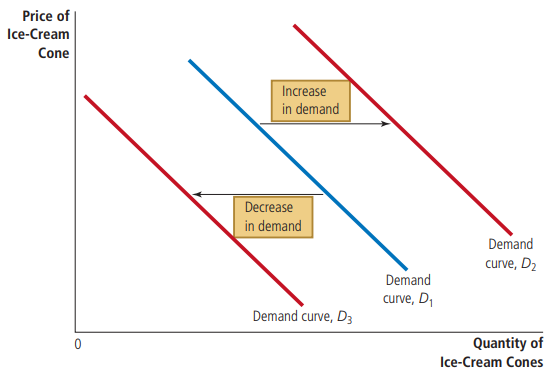
Quickly Sketch an Increase and A Decrease in the Quantity Demanded for the Demand Curve

Plot the Demand Schedule Given the Demand Curve

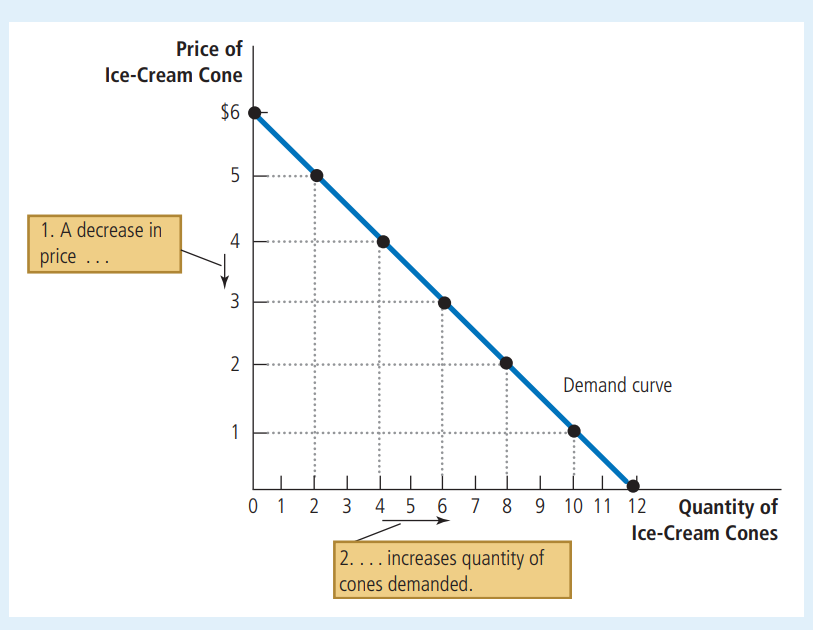
Sketch the Demand Curve Given the Demand Schedule
(1) Calculate Market Demand
(2) Sketch Catherine’s Demand Curve
(3) Sketch Nicholas’ Demand Curve
(4) Sketch the Market Demand Curve
(1) Set Up Catherine’s Individual Demand Schedule
(2) Set Up Nicholas’ Individual Demand Schedule
(3) Set Up Market Demand Schedule and Calculate Market Demand
(4) Sketch the Market Demand Curve
Quickly Sketch an Increase and A Decrease in the Quantity Demanded for the Demand Curve
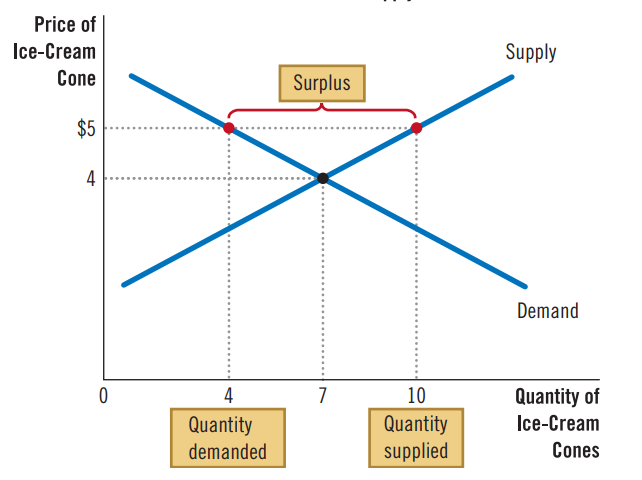
Suppose you have this graph, calculate the excess supply/demand.
Price | Quantity Supplied | Quantity Demanded | Excess Demand/Supply |
$5 | 10 | 4 | 10-4 = 6 (Excess Supply) |
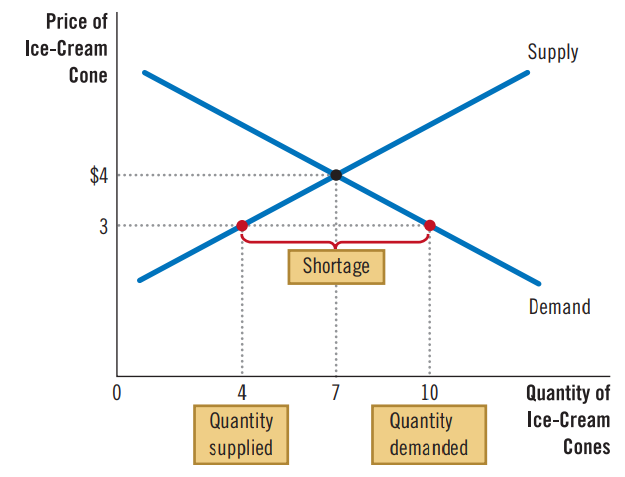
Suppose you have this graph, calculate excess supply/demand.
Price | Quantity Supplied | Quantity Demanded | Excess Demand/Supply |
$3 | 4 | 10 | 4-10 = -6 (Excess Demand) |
Suppose you have this graph, calculate excess supply/demand.
Price | Quantity Supplied | Quantity Demanded | Excess Demand/Supply |
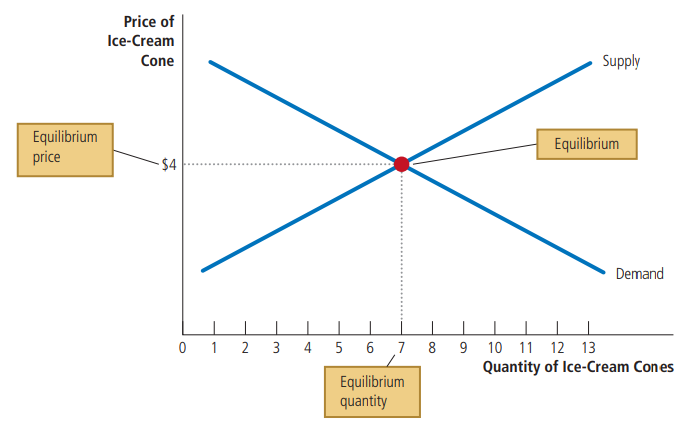
$4 | 7 | 7 | 7-7 = 0 (Equilibrium) |
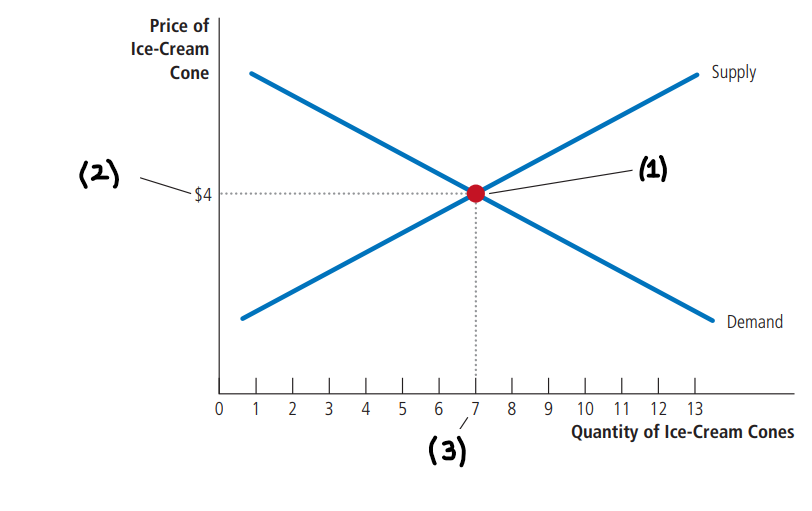
Identify (1), (2), and (3)
Suppose that this summer’s weather is exceptionally hot. How does this affect the ice-cream market?
1. The weather affects the demand curve by changing consumers’ taste for ice cream. That is, it alters the amount that people want to buy at any price. The supply curve remains the same because the weather does not directly affect the firms that sell ice cream.
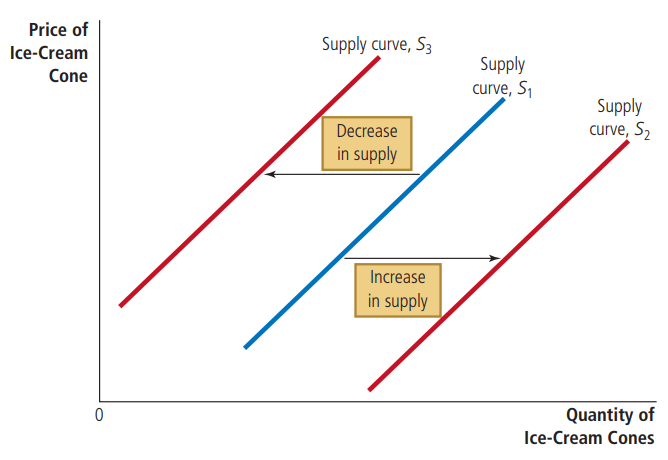
2. Because hot weather makes a cool treat more appealing, people want more ice cream. Figure 10 shows this increase in demand as a rightward shift in the demand curve from D1 to D2 . This shift indicates that the quantity demanded is higher at every price.
3. At the old price of $4, there is now an excess demand for ice cream, and this shortage induces firms to raise the price. As Figure 10 shows, the increase in demand raises the equilibrium price from $4 to $5 and the equilibrium quantity from 7 to 10 cones. In other words, the hot weather increases both the price of ice cream and the quantity sold.
One August, a hurricane destroys part of the sugarcane crop and drives up the price of sugar. How does this affect the market for ice cream?
1. The increase in the price of sugar, an input for ice cream, raises the cost of producing ice cream. It therefore affects the supply curve. The demand curve does not change because the higher cost of inputs does not directly affect the amount of ice cream consumers want to buy.
2. Higher costs reduce the amount of ice cream that producers are willing and able to sell at every price. Figure 11 depicts this decrease in supply as a leftward shift in the supply curve from S1 to S2 .
3. At the old price of $4, there is now an excess demand for ice cream, and this shortage causes firms to raise the price. As Figure 11 shows, the shift in the supply curve raises the equilibrium price from $4 to $5 and lowers the equilibrium quantity from 7 to 4 cones. Because of the sugar price increase, the price of ice cream rises, and the quantity sold falls.
In a series of unfortunate events, a heat wave and a hurricane strike in the same summer. How does this affect the market for ice cream?
1. Both curves must shift. The heat affects the demand curve because it alters the amount of ice cream that consumers want to buy at any price. At the same time, the hurricane alters the supply curve for ice cream: By driving up sugar prices, it changes the amount of ice cream that producers want to sell at any price.
2. The curves shift in the same directions as they did earlier: The demand curve shifts to the right, and the supply curve shifts to the left, as Figure 12 shows.
3. Two outcomes are possible, depending on the relative size of the demand and supply shifts. In both cases, the equilibrium price rises. In panel (a), where demand increases substantially while supply falls just a little, the equilibrium quantity also increases. But in panel (b), where supply falls substantially while demand rises just a little, the equilibrium quantity falls. Thus, these events certainly raise the price of ice cream, but their impact on the amount of ice cream sold is ambiguous (that is, it could go either way).