The Arrhenius Equation
1/8
There's no tags or description
Looks like no tags are added yet.
Name | Mastery | Learn | Test | Matching | Spaced | Call with Kai |
|---|
No study sessions yet.
9 Terms
What is the Arrhenius equation?
An equation that shows how the rate constant (
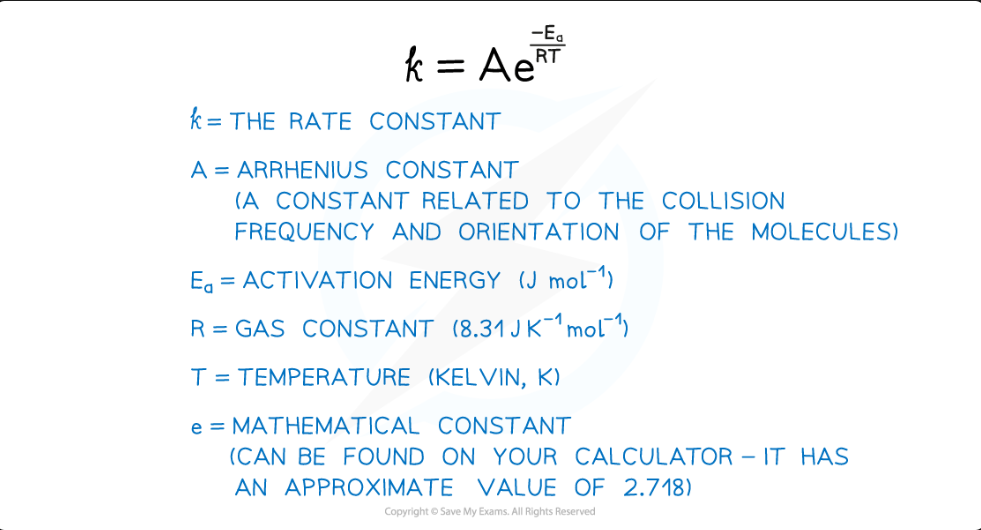
k) varies with temperature (T) and activation energy (Ea).k = Ae⁻ᴱᵃ/ᴿᵀ
Define the terms in the Arrhenius equation: k = Ae⁻ᴱᵃ/ᴿᵀ
k = Rate constant
A = Arrhenius constant (pre-exponential factor)
Ea = Activation energy (in J mol⁻¹)
R = Gas constant (8.31 J K⁻¹ mol⁻¹)
T = Temperature (in Kelvin, K)
What is the logarithmic (straight line) form of the Arrhenius equation?
ln k = -Ea/RT + ln A
This matches the equation for a straight line, y = mx + c:
y =
ln kx =
1/Tm (gradient) =
-Ea/Rc (y-intercept) =
ln A

What are the two crucial unit conversions to remember when using the Arrhenius equation?
emperature (T): Must be in Kelvin (K). To convert:
K = °C + 273Activation Energy (Ea): Must be in Joules per mole (J mol⁻¹), not kJ mol⁻¹. To convert:
J = kJ × 1000
State the logarithmic form of the Arrhenius equation. Identify the variables that would be plotted on the y-axis and x-axis to produce a straight-line graph.
Equation:
ln k = -Ea/RT + ln A[1]y-axis:
ln k[1]x-axis:
1/T[1]
A student plots a graph of ln k against 1/T for a reaction. The gradient of the line of best fit is -6200 K.
Calculate the activation energy (Ea) for this reaction in kJ mol⁻¹. (The gas constant, R = 8.31 J K⁻¹ mol⁻¹) (3 marks)
Formula:
Gradient = -Ea / RSo,Ea = -Gradient × R[1]Calculation (in J mol⁻¹):
Ea = -(-6200) × 8.31Ea = 51502 J mol⁻¹[1]Conversion (in kJ mol⁻¹):
Ea = 51502 / 1000Ea = 51.5 kJ mol⁻¹(to 3 s.f.) [1]
A catalyst is added to a reaction. Explain, in terms of the Arrhenius equation, how this leads to an increase in the value of the rate constant, k. (2 marks)
A catalyst provides an alternative reaction pathway with a lower activation energy (Ea) [1].
In the Arrhenius equation (
k = Ae⁻ᴱᵃ/ᴿᵀ), a smaller value forEamakes the exponential term (-Ea/RT) less negative, which increases the value ofk
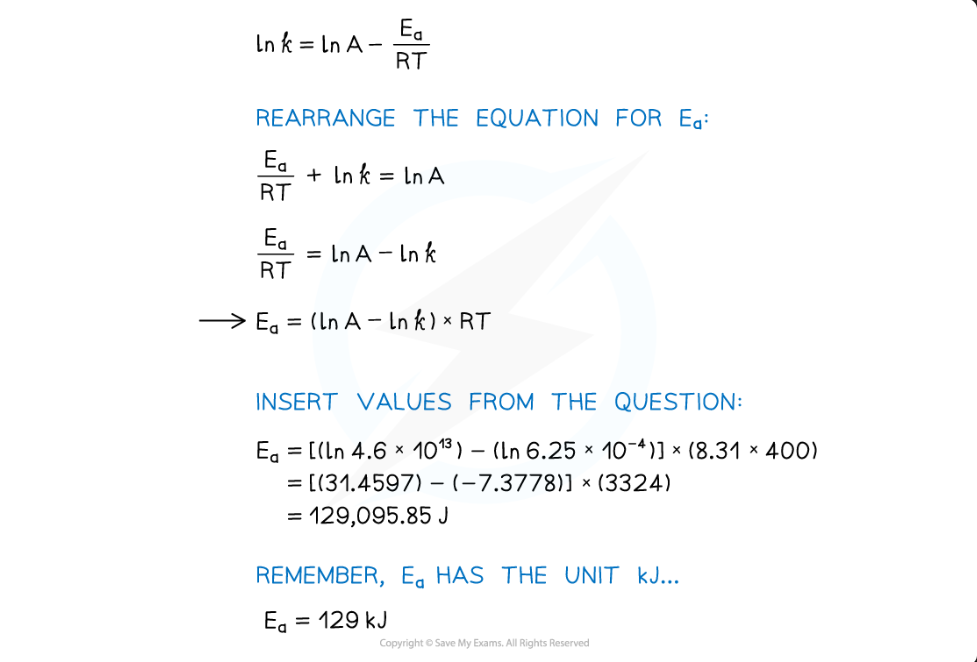
Calculate the activation energy of a reaction which takes place at 400 K, where the rate constant of the reaction is 6.25 x 10⁻⁴ s-1.
A = 4.6 x 10¹³ and R = 8.31 J K-1 mol-1.
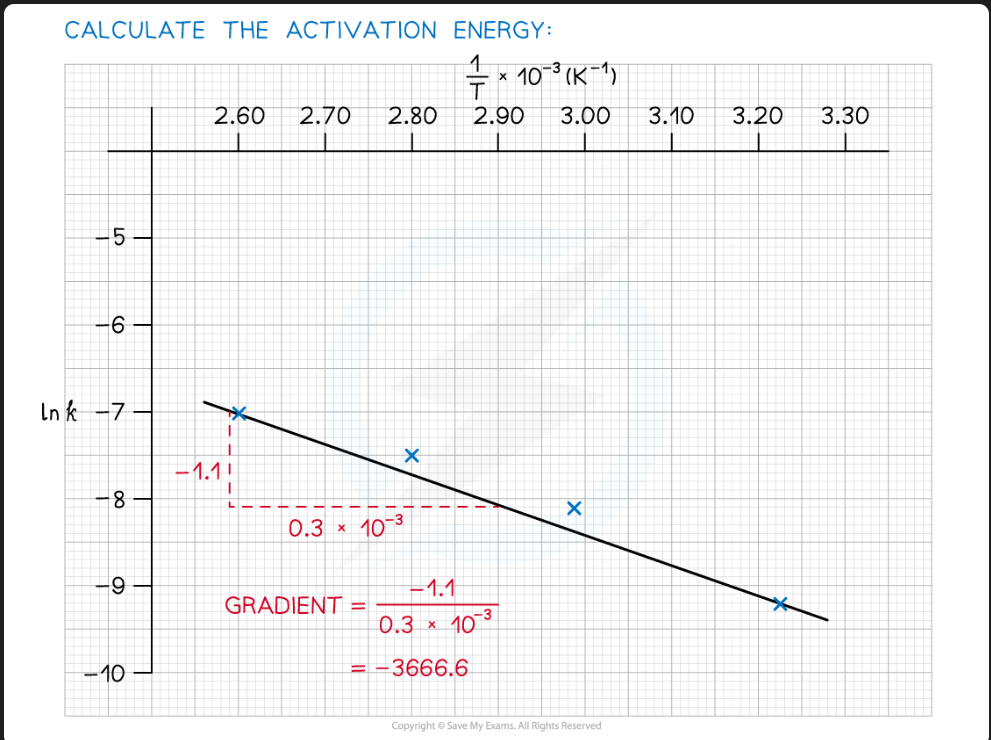
How do you find the activation energy (Ea) experimentally using the Arrhenius equation?
Measure the rate constant (
k) at several different temperatures (T).Calculate
ln kand1/Tfor each data point (remembering to use T in Kelvin).Plot a graph of
ln k(y-axis) against1/T(x-axis).Draw a line of best fit (which will be a straight line).
Measure the gradient (m) of this line.