FINS3616 International Business Finance
1/96
There's no tags or description
Looks like no tags are added yet.
Name | Mastery | Learn | Test | Matching | Spaced | Call with Kai |
|---|
No analytics yet
Send a link to your students to track their progress
97 Terms
Globalised Economy
Financial investments abroad are on the rise as:
Diversification needs
Chasing higher returns in more mature markets
Ease of access (rise of ETFs, app brokers etc)
World economy also becoming more globalised:
MNCs dominate our environment
International production
Import of intermediate goods
Export of the final product
Even domestic firms will have significant international components

Rise of MNCs
The raw material seekers go abroad to explore raw materials
multinational oil and mining companies (BHP, Exxon)
The market seekers go overseas to produce and sell in foreign markets
Unilever, Proctor&Gamble, Nestle, Maccas, Coke
The cost minimisers invest in lower cost production or production technologies overseas to remain cost competitive
Apple, SHEIN, Uniqlo, H&M, Zara (Countries like India, Bangladesh, China, etc)
The knowledge seekers enter foreign markets to gain information
Production processes in terms of technology, foreign innovation
The domestic customer followers try to deliver services to customers abroad
banks, law, consulting firms that set foreign practices following their MNC clients (KPMG, PwC, Deloitte)
Financial market imperfection exploiters reduce taxes and benefit from diversification
American companies relocating their corporate HQ to ireland due to tax benefits
BHP moving HQ to SGP
International Markets
Classified by asset class
Stocks
Bonds
Currencies
Derivatives
Many more but not covered in course
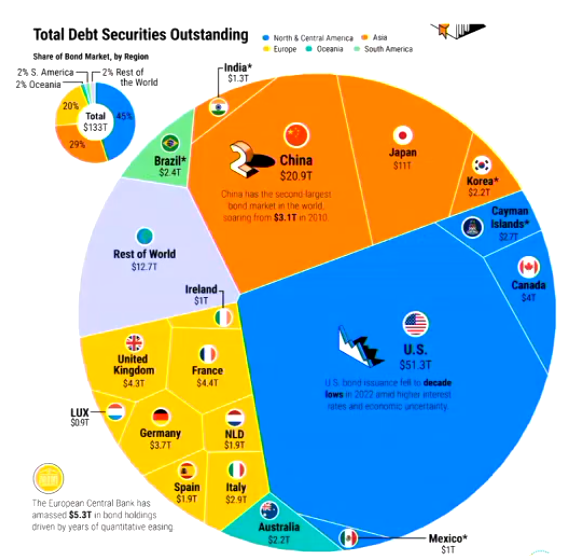
Bond Market
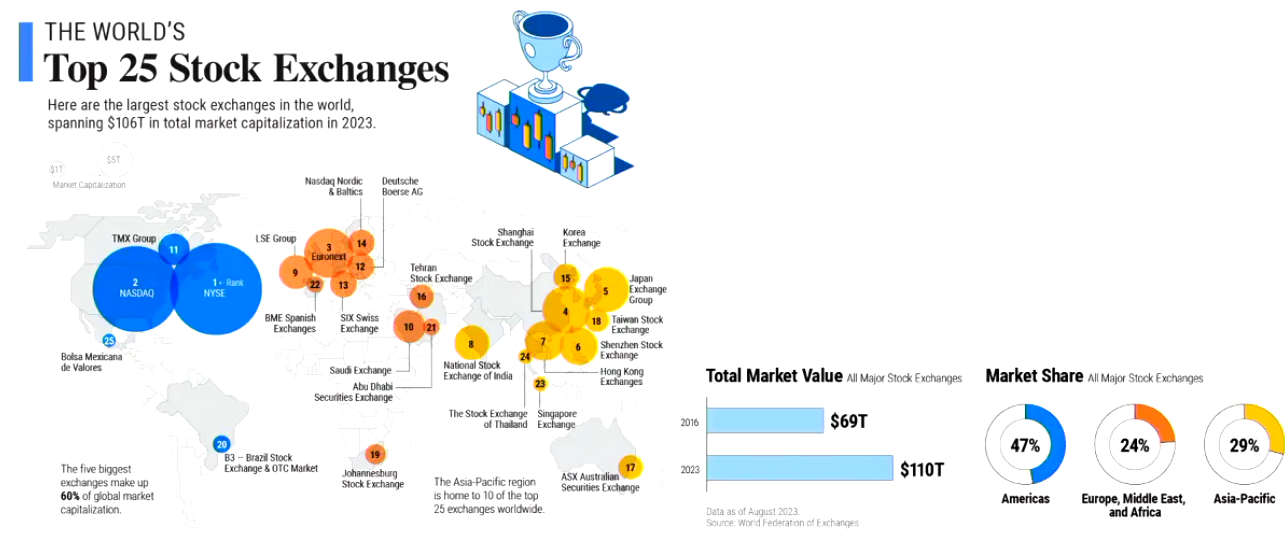
The bond market is as large as the stock market
International bonds: US$32 Trillion
Domestic bonds: US$101 Trillion (US?)
By sector
Governments: US$60 Trillion
Financial institutions: US$42 Trillion
Non-financial corporations: US$17 Trillion
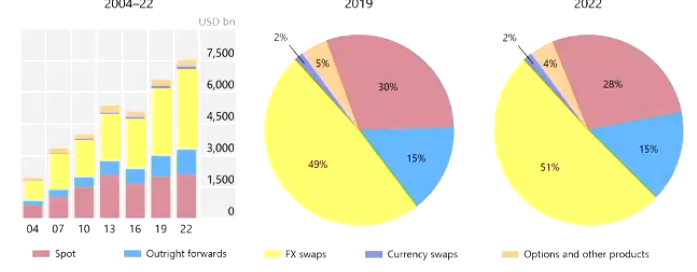
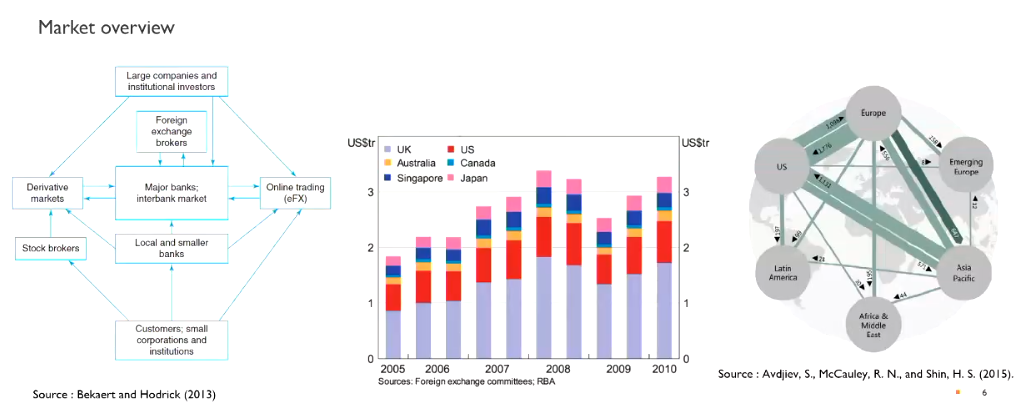
FX Market
largest market in the world in terms of activity
growing exponentionally since the 1980s
daily volume of US$ 7.5 Trillion
Instrument wise:
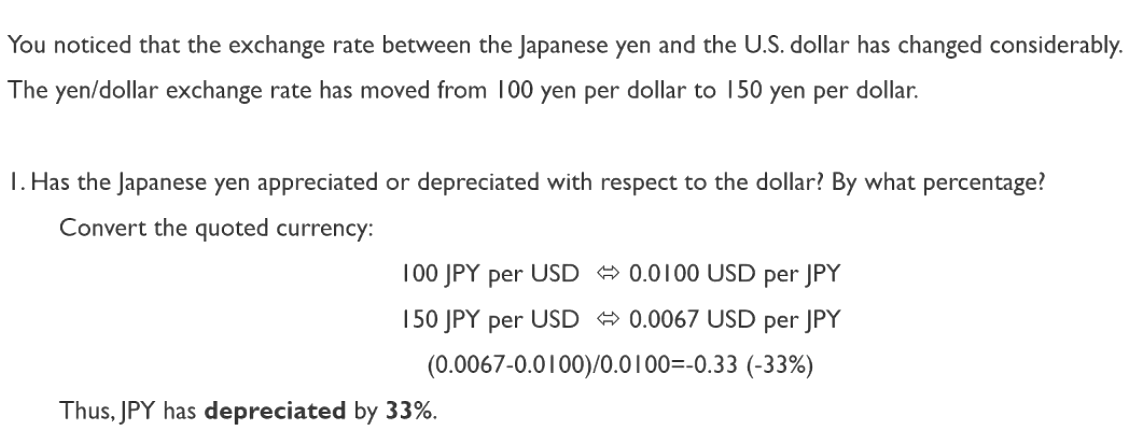
Exchange rate quotations
A/B (in this course)
USD/EUR
EUR is the quoted currency
USD is the base
1 USD to 1.20 Euros
If say 1 USD is now worth 1.3 Euros
we say that the USD has depreciated and that the Euro has appreciated
and vice versa if the other way around
Percentage as a measure of depreciation / appreciationm
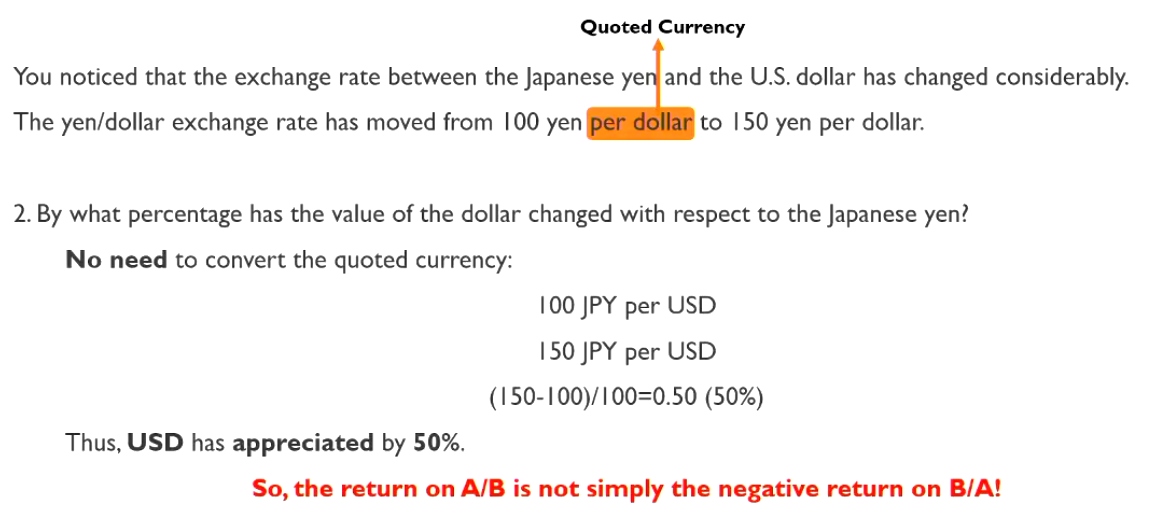
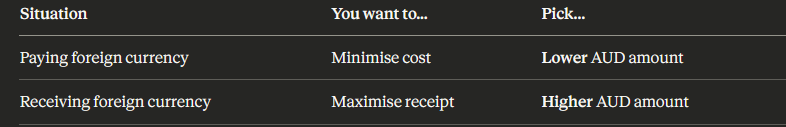
Examples of FX effects for importers vs exporters
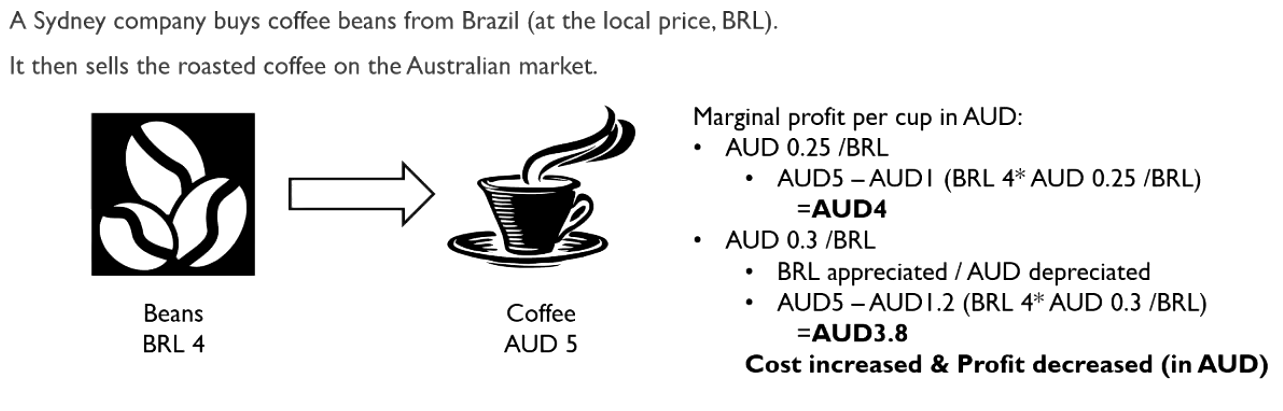
Multiply when the rate is expressed as domestic currency per unit of foreign currency (AUD/BRL) — this converts foreign currency costs into domestic currency terms, where a stronger foreign currency means higher costs and lower profit.
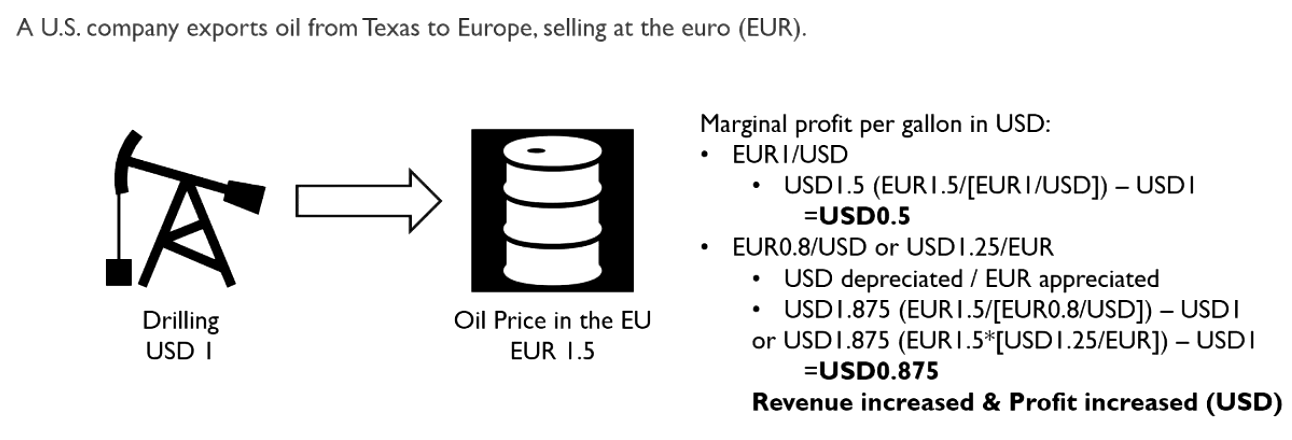
Divide when the rate is expressed as foreign currency per unit of domestic currency (EUR/USD); multiply when the rate is expressed as domestic currency per unit of foreign currency (USD/EUR) — both convert foreign currency revenue into domestic currency terms
Finding the return of an invesment in a foreign currency
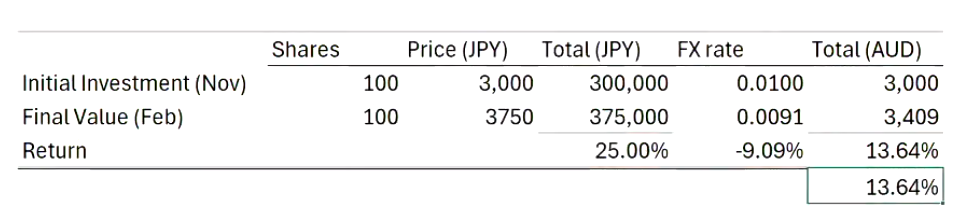
The total return in domestic currency (AUD) reflects both the asset's price return in foreign currency (JPY) and the FX rate change — multiply the foreign currency total by the FX rate (AUD/JPY) to convert to AUD, then calculate the return as (Final AUD Value − Initial AUD Value) / Initial AUD Value
Exchange rate risk
Companies and investors pay risk if they hvae to receive and pay an amount in foreign currency
The future exchange rate is uncertain
And unfavourable exchange rate movements may result in a loss
Important exchange rates in the FX market
Spot rates
quoted for immediate currency transactions
Forward exchange rates
contracted today but with delivery and settlement in the future
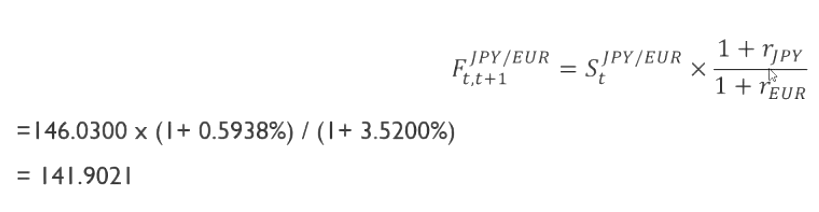
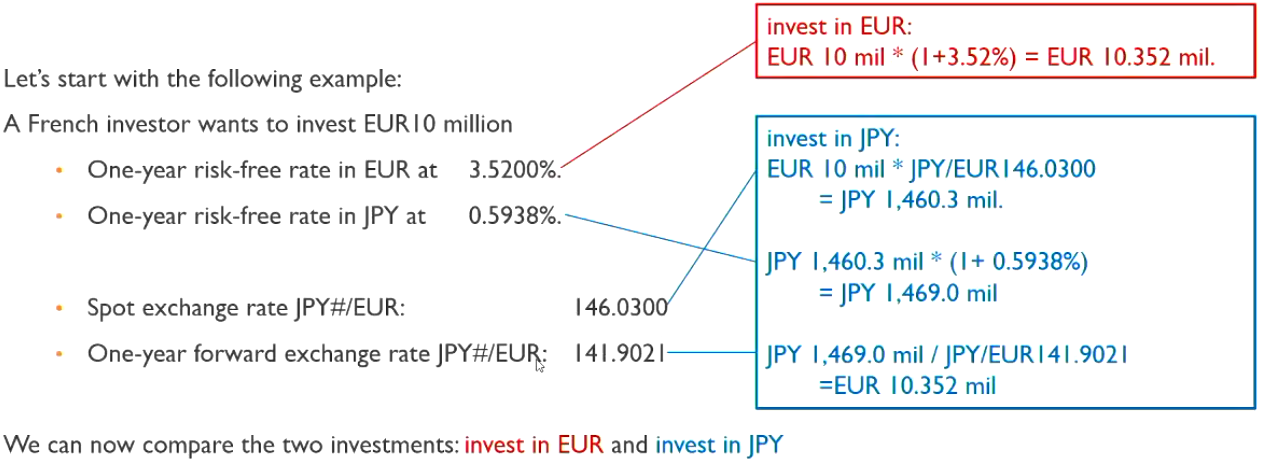
Covered Interest Rate Parity
The forward rate that makes the two investments equal must be given by (F = future.S = spot,r = interest rate)
assumes that there is a non-arbitrage relationship (no difference between investing in two markets)
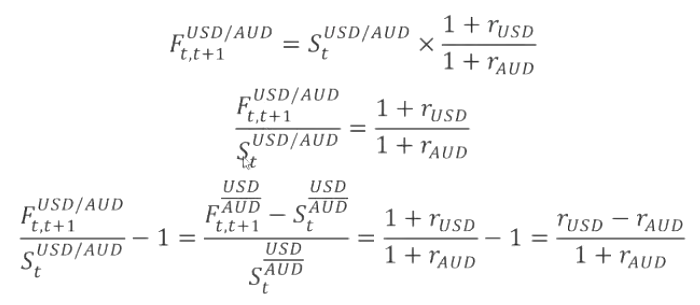
Premium of the forwards contract
Premium is dependant on the interest rate differential (F = future.S = spot,r = interest rate)'
Covered Interest Rate Parity in practice
In practice it is generally empirically verified
However in the GFC it was violated, as trust in financial institutions faltered and the term “risk-free’ was threatened
Factors that may prevent a potential arbitrage
Counterparty default risk on:
the loan leading to higher interest rates as banks want to prevent bank runs (technically not arbitrage but the risk premium)
the forward contracts (people do not have faith in the next year leading to the rates changing)
Exchange rate controls and tax differences
Countries may limit the ability to exchange currencies
Taxes may be higher than expected and erode profits
Transaction costs
Transaction costs which may seem minute can add up
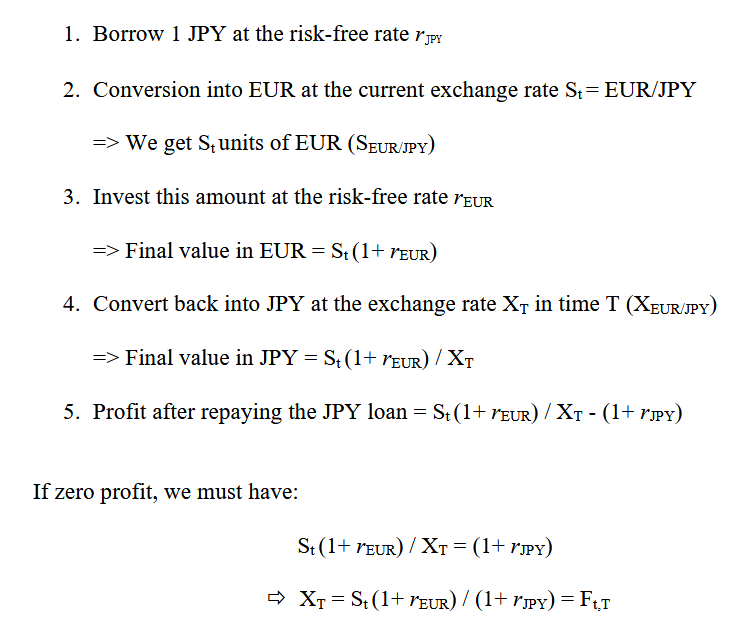
Forward rate replication
Forex (Foreign Exchange, FX) Market
main exchange rate market
OTC market (no one specific exchange during transaction)
Exchanges by phone or an electronic platform
24 hours a day on weekdays
Inter-bank market: 80% of transactions
Daily volume: $6.6 Trillion in 2024
Largest market in the world by volume traded
Daily volume of US stocks for example is only $1 Trillion in 2024
Main participants in the forex market
Commercial and investment banks
Dealer and market makers
Offering liquidity in the market
FX brokers
financial intermediaries (link between buyers and sellers)
Central banks, mutual funds and hedge funds
Growing players
Transactions in the FX market
Interbank spot market, payment / receipt of FX requires 2 business days
One day for admin, another for time zone differences
Exception is USD/CAD (done in one day)
Electronic exchange rate trading platforms
Thomson Retuers
Electronic Brokering Service (EBS)
More than 50% of transactions route through these services
Anonymous transactions
Trading in the FX Market
Trading is done via the Society for Worldwide Interbank Financial Telecommunications (SWIFT) system
SWIFT links 11000 banks and institutions in more than 200 countries
Operates by sending messages containing transaction information and instructions between FIs
Messages are exchanged in a standardised format, ensuring compatibility between different systems and FIs
Quotations
No exchanges for all exchange rates
However all currencies are exchanged against the USD
Use of cross rates
AUD/BRL = AUD/USD * USD/BRL
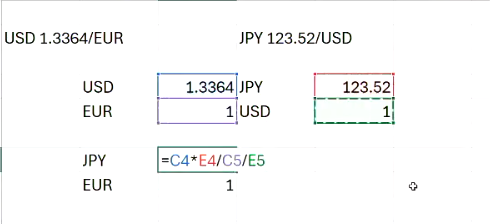
Cross Rates
A cross rate is the exchange rate between two countries inferred from each country’s exchange rate with a third country
For example:
USD 1.3364 / Euro
JPY 123.52 / USD
JPY/EUR = USD/EURO x JPY USD = 1.3364 × 123.52 =165.07
Therefore one euro is worth 165.07 or JPY 165.07/EURO
Order of operations
Cross rate arbitrage
Attempting to leverage mispricing between 2 different FX institutions
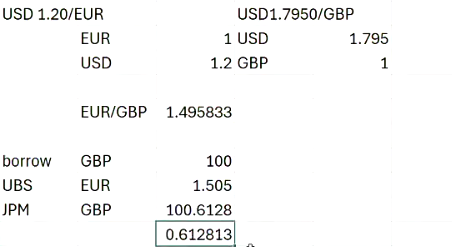
Ideally borrow money Buy EUR using JPM and sell GBP via UBS
Bid-ask spread
Bid price: amount purchased by the bank / seller
Bank buys EUR at USD 1.24969 / EUR
Ask price: amount sold by the bank / seller
Bank sells EUR at USD 1.5 / EUR
Equavilent quotations
USD / EUR: 1.24969-1.25000
EUR / USD: 0.80000-0.80020
EUR/ USD: 0.80000-20
Bid-ask spread size
Bid ask spread rating for USD / EUR: 1.24969-1.25
3.1 pips (price interest point = unit of change)
One pip = one unit to the 4th decimal place (e.g. USD 0.0001 except for JPY where JPY 0.01)
Can be expressed in relative terms
Spread = round-trip transaction costs
Spread size for major international currencies
Spread size for physical currency exchange
The difference is opportunity costs (no interest)
Spread at the airport: 20-30%
Historically bid ask spread for emerging and advanced markets was quite different, not the case anymore as globalisation and the rise of fintech has allowed converence in liquidity for the currencies of AE and EMs
bid-ask spread size
Size varies according to market conditions
Allows traders (dealers) to manage inventory risks
exchange rate volatility as a determinant on the bid-ask spread size
The bid ask spread increases with exchange rate volatility (connected with uncertainty)
An example is the GFC, august 2024 where there was high uncertainty
forward contracts as a determinant of the bid-ask spread size
Bid ask spread increases with the maturity of the forward contracts
A bank’s default risk increases with the horizon
More difficult to find counterparty willing to do such a transaction
Increases the bank’s inventory riosk
Higher bid ask spread for forward contracts than for spot rates
Real world example:
Very significant counterparty risk in 2008-2009
Following bankruptcy of Lehman Brothers in 2008, bid ask spreads for 3 month forwards were double the spread for spot contracts
IF FORWARD BID ASK SPREAD IS NARROWER THAN SPOT IT IS A WRONG CALCULATION
Liquidity as a determinant of bid ask spread size
Forward market less liquid than the spot market
Especially for long-term contacts
Banks often impose an order limit or ask for collateral
If there is high liquidity, there will be pressure narrowing down the bid ask spread
High transaction costs for long term forward contracts encouraged the development of another market
long term currency swap
Intra-day variations of the bid ask spread
Generally higher spread at the beginning of the market and at the end of the day
less news less trading
Economic statistics announcements during the day can significantly move prices
Calculating cross rate calculation with bid ask spreads
As a general rule of thumb, the bid ask spread should be maximised (take the worst)
Bid rate (buying price) should be as small as possible
Ask rate (selling price) should be as high as possible
Formula
(A/B) bid = (A/C) bid / (B/C) ask = (A/C) bid * (C/B) bid; given that (C/B) bid = 1 (B/C) bid
(A/B) ask = (A/C) ask / (B/C) bid = (A/C) ask * (C/B) ask; given that (C/B) ask = 1 (B/C) ask
Examples:
Note to keep the bid as low as possible and ask as high as possible
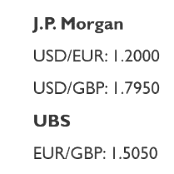
J.P. Morgan
USD/EUR: 1.2000-1.2050
USD/GBP: 1.7950-1.8100
UBS
EUR/GBP: 1.5050-1.5100
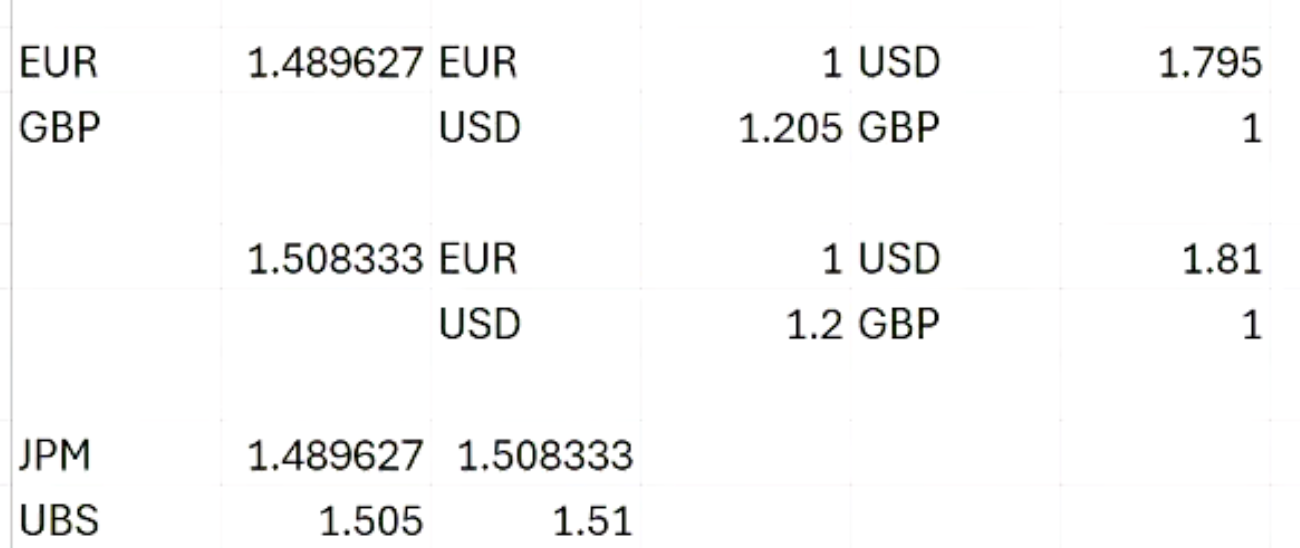
Multiply top with top and bottom with bottom
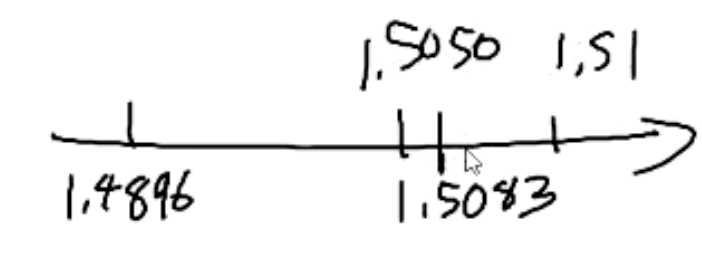
There is no arbitrage in this sense as we buy at 1.5083 from JPM and sell to UBS at a price of 1.505
easy way to determine arbitrage is to construct a diagram showing both bid ask spreads:
Covered Interest Rate Parity in the context of a bid ask spread
Theoretically nothing much changes in regards to the currency that is invested in the home country’s bank, however the only difference is that when converting pay the bid spread (which will be lower than the market value), and when converting back to original currency pay the ask spread (which will be higher than the market value)
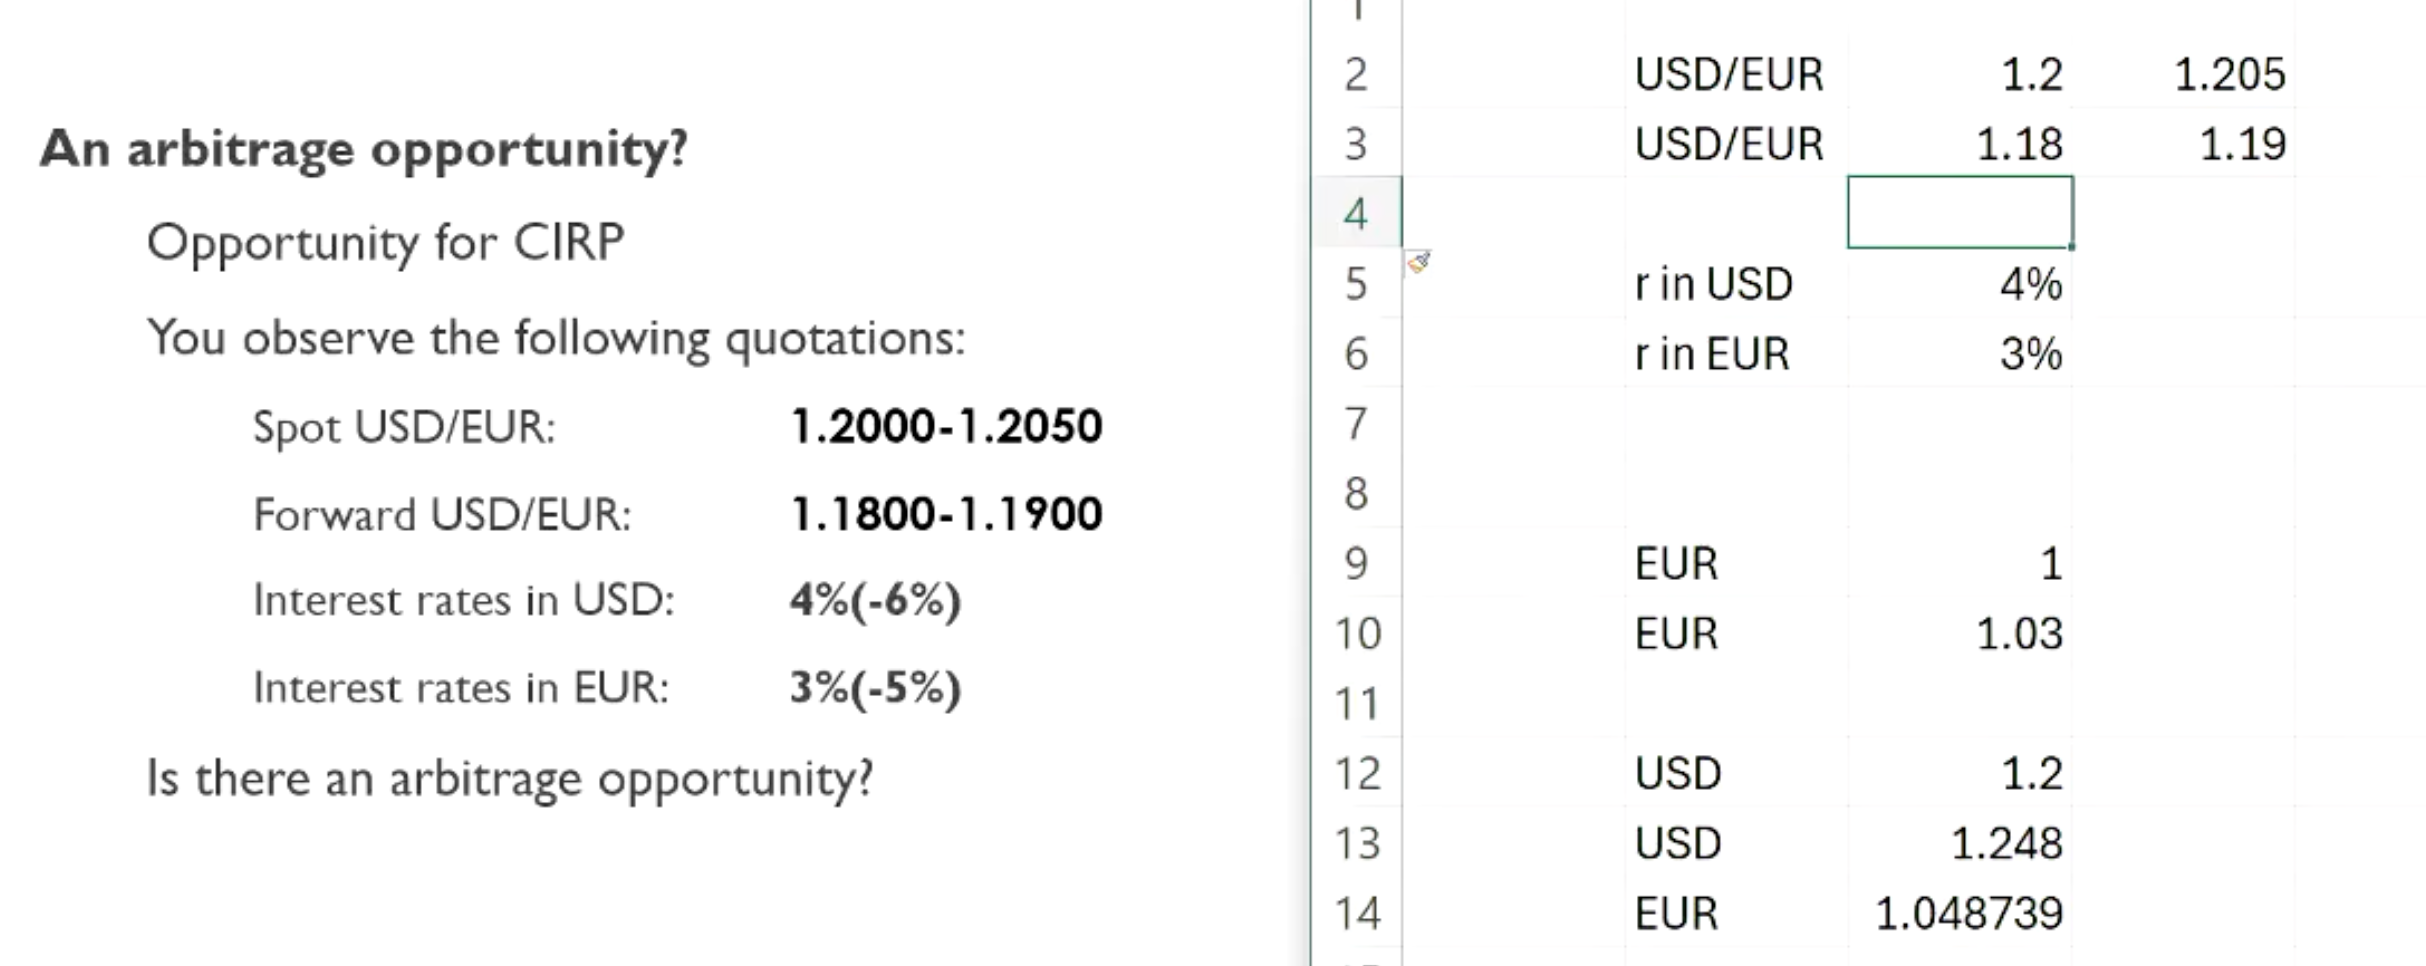
Covered Interest Rate Parity in the context of a bid ask spread with different borrowing rates
Different borrowing rates may exist for each country’s FI, after all banks will charge higher for borrowing money and will often pay less for the guarantee of a riskless investment return
Therefore the rate differences may actually eliminate the ability to conduct an arbitrage
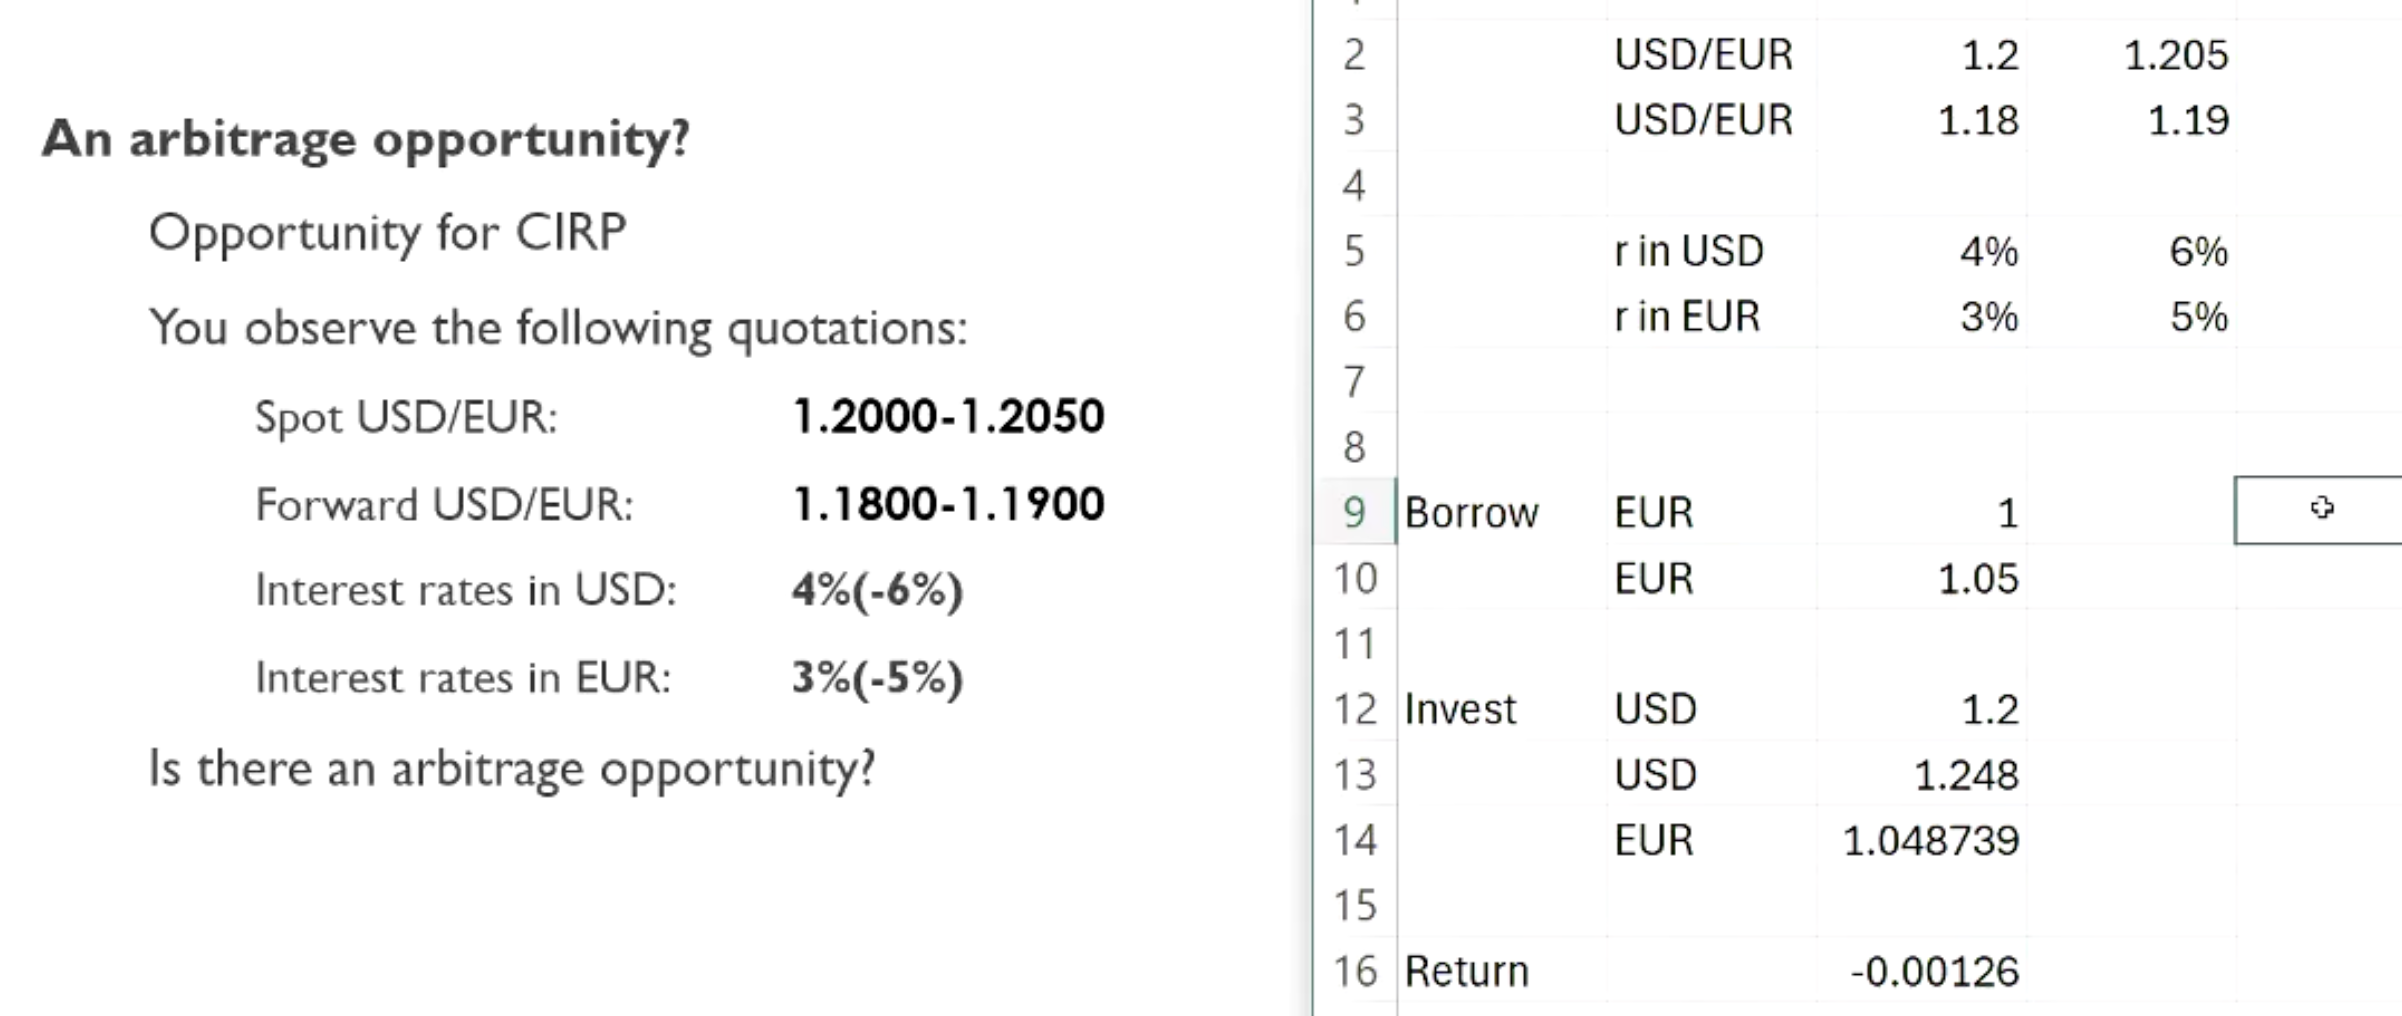
As we see in the example: the borrowing rate for the EURO is 5% making the arbitrage unprofitable as the cost of capital is too high
Exchange rate risk
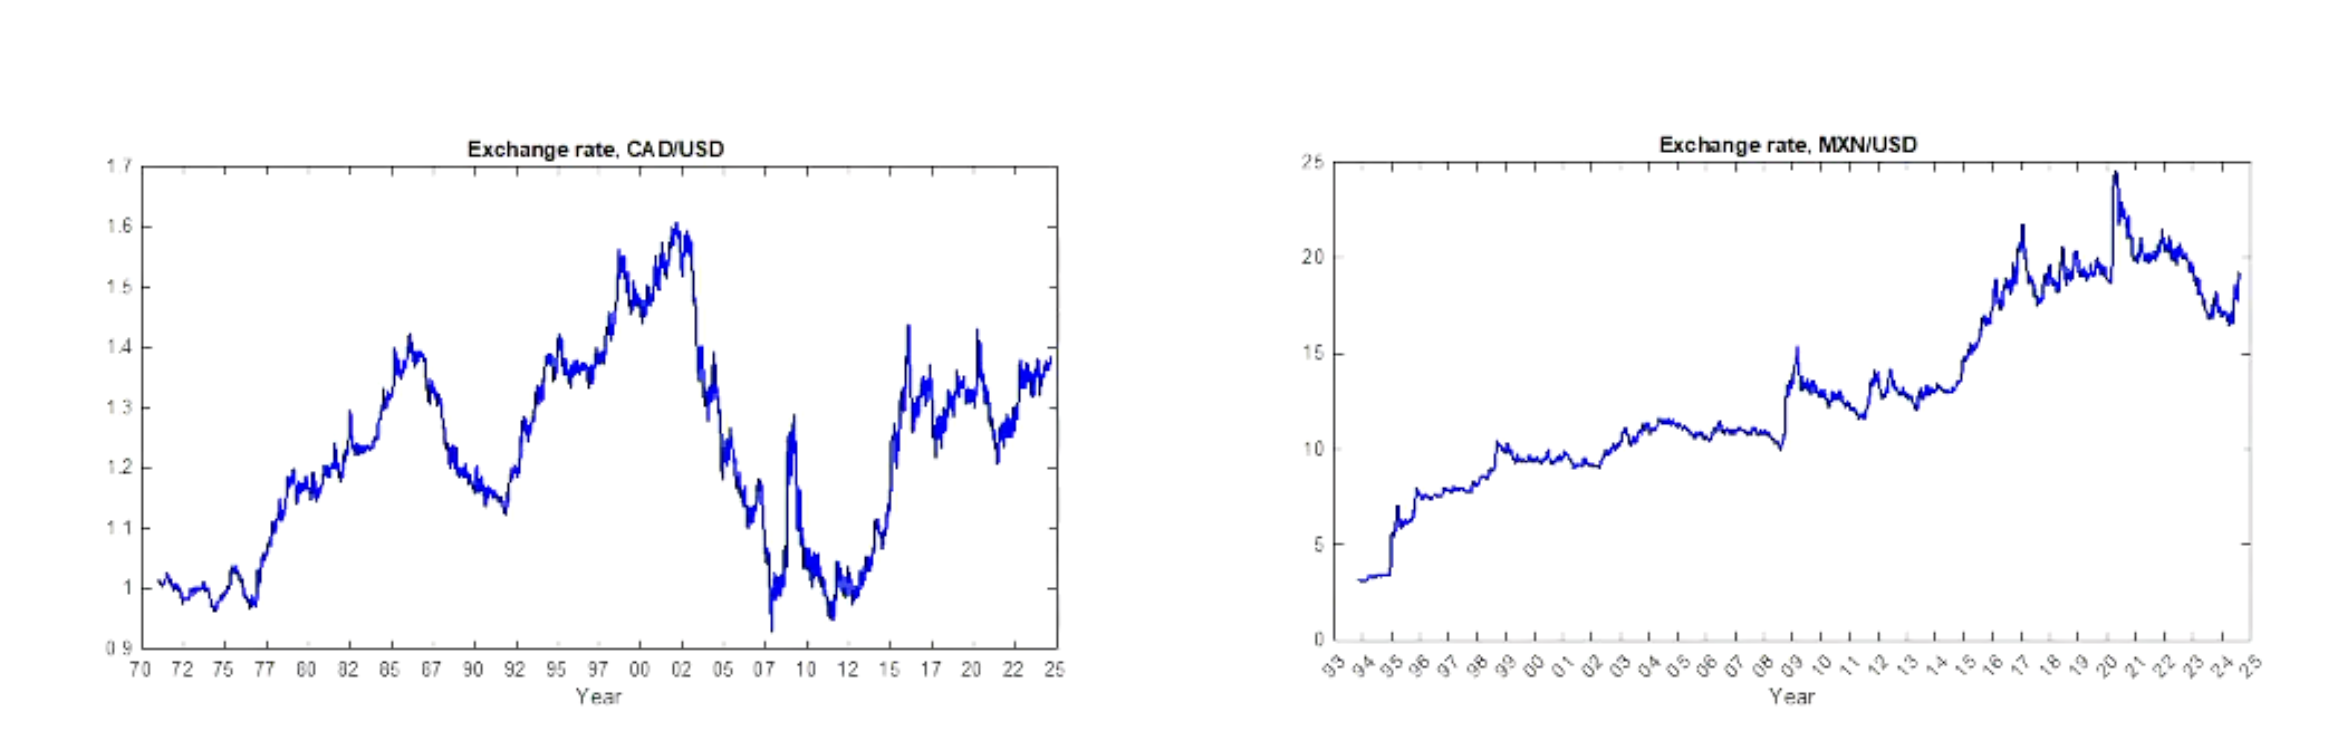
CAD / USD has a range of 1-1.6 / USD over the past 50 years indicating the USD has appreciated and CAD has depreciated
MXN / USD has a range of 3-25 / USD over the past 30 years indicating the USD has appreciated and MXN has depreciated
Quantification of losses / gains require a description of the uncertainty related to exchange rate fluctuations
Using historical data to determine the distribution of exchange rate changes (returns)
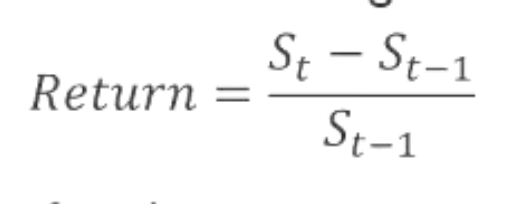
Take the return of the exchange rate per a certain interval (daily, monthly, yearly whatever period)
Calculate the mean and volatility of the exchange rate returns
Assume a normal distribution (bell curve, no extreme returns)
Include skewness (asymmetric shape) and kurtosis (extreme returns) if the distribution is not normal
Example:
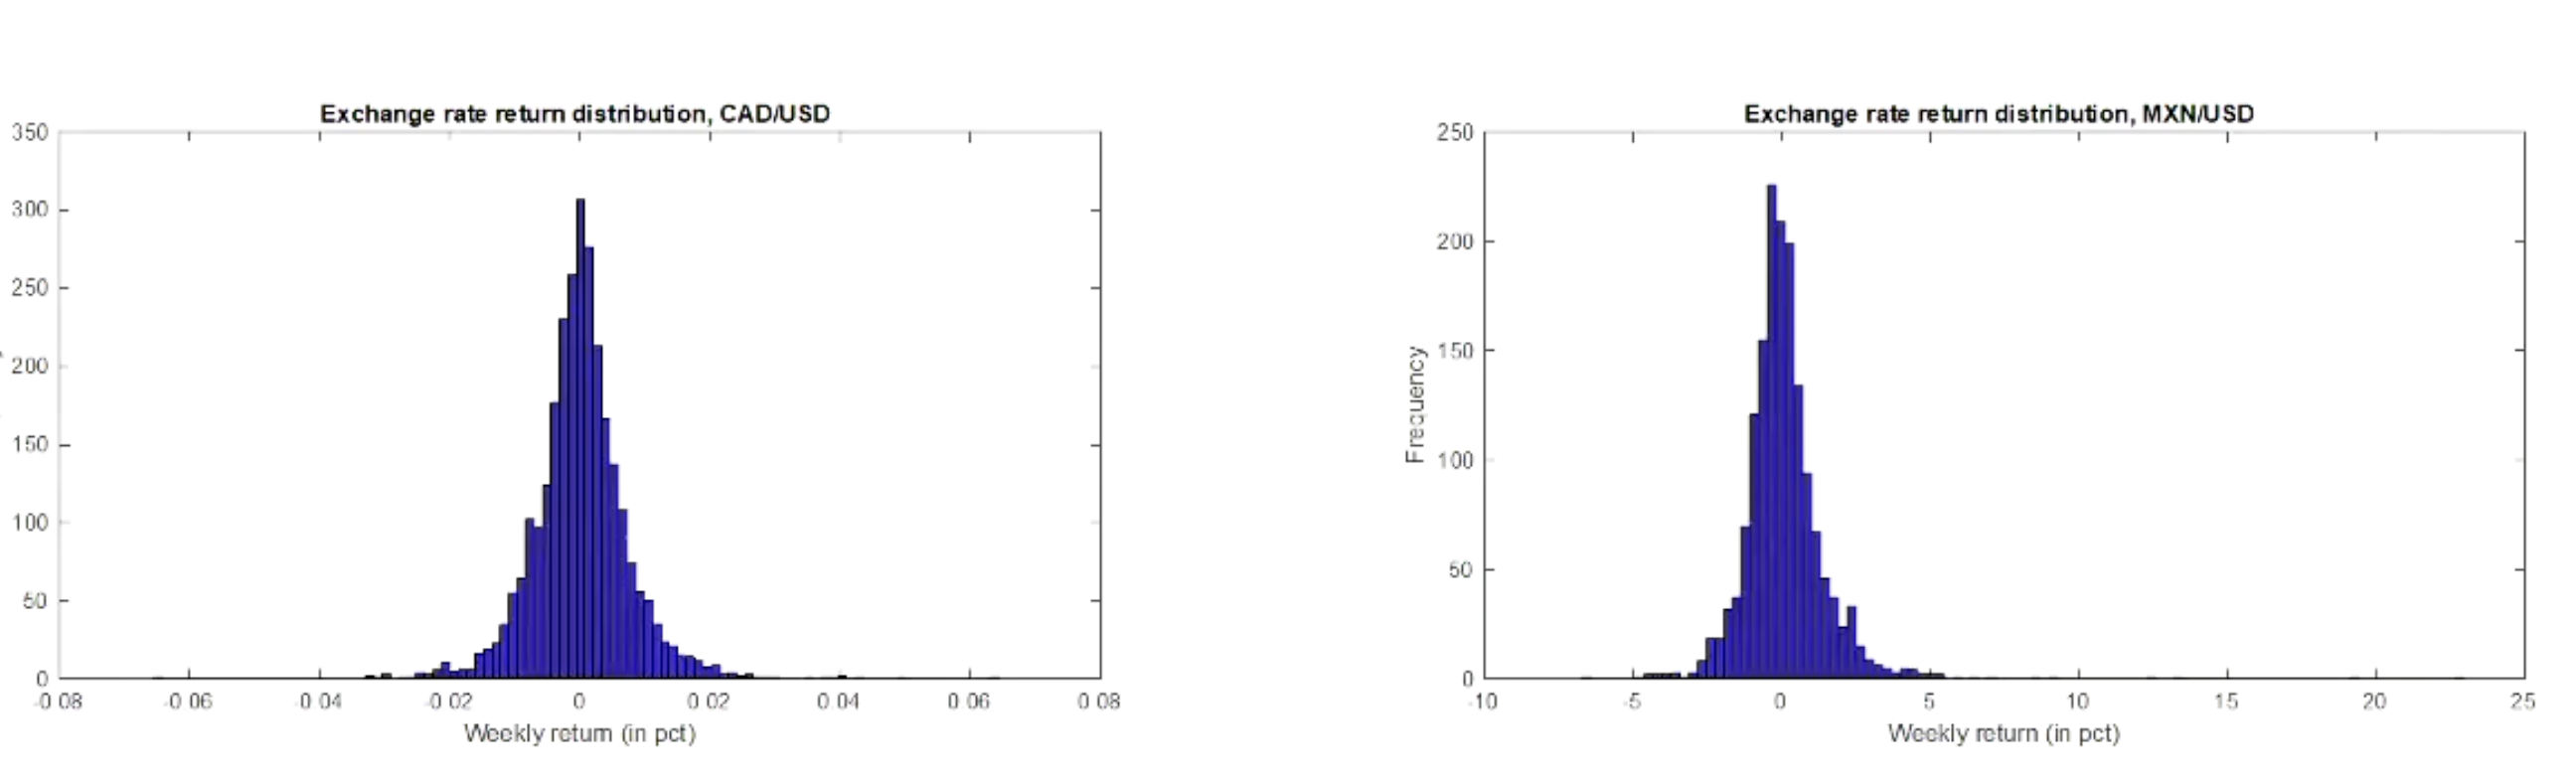
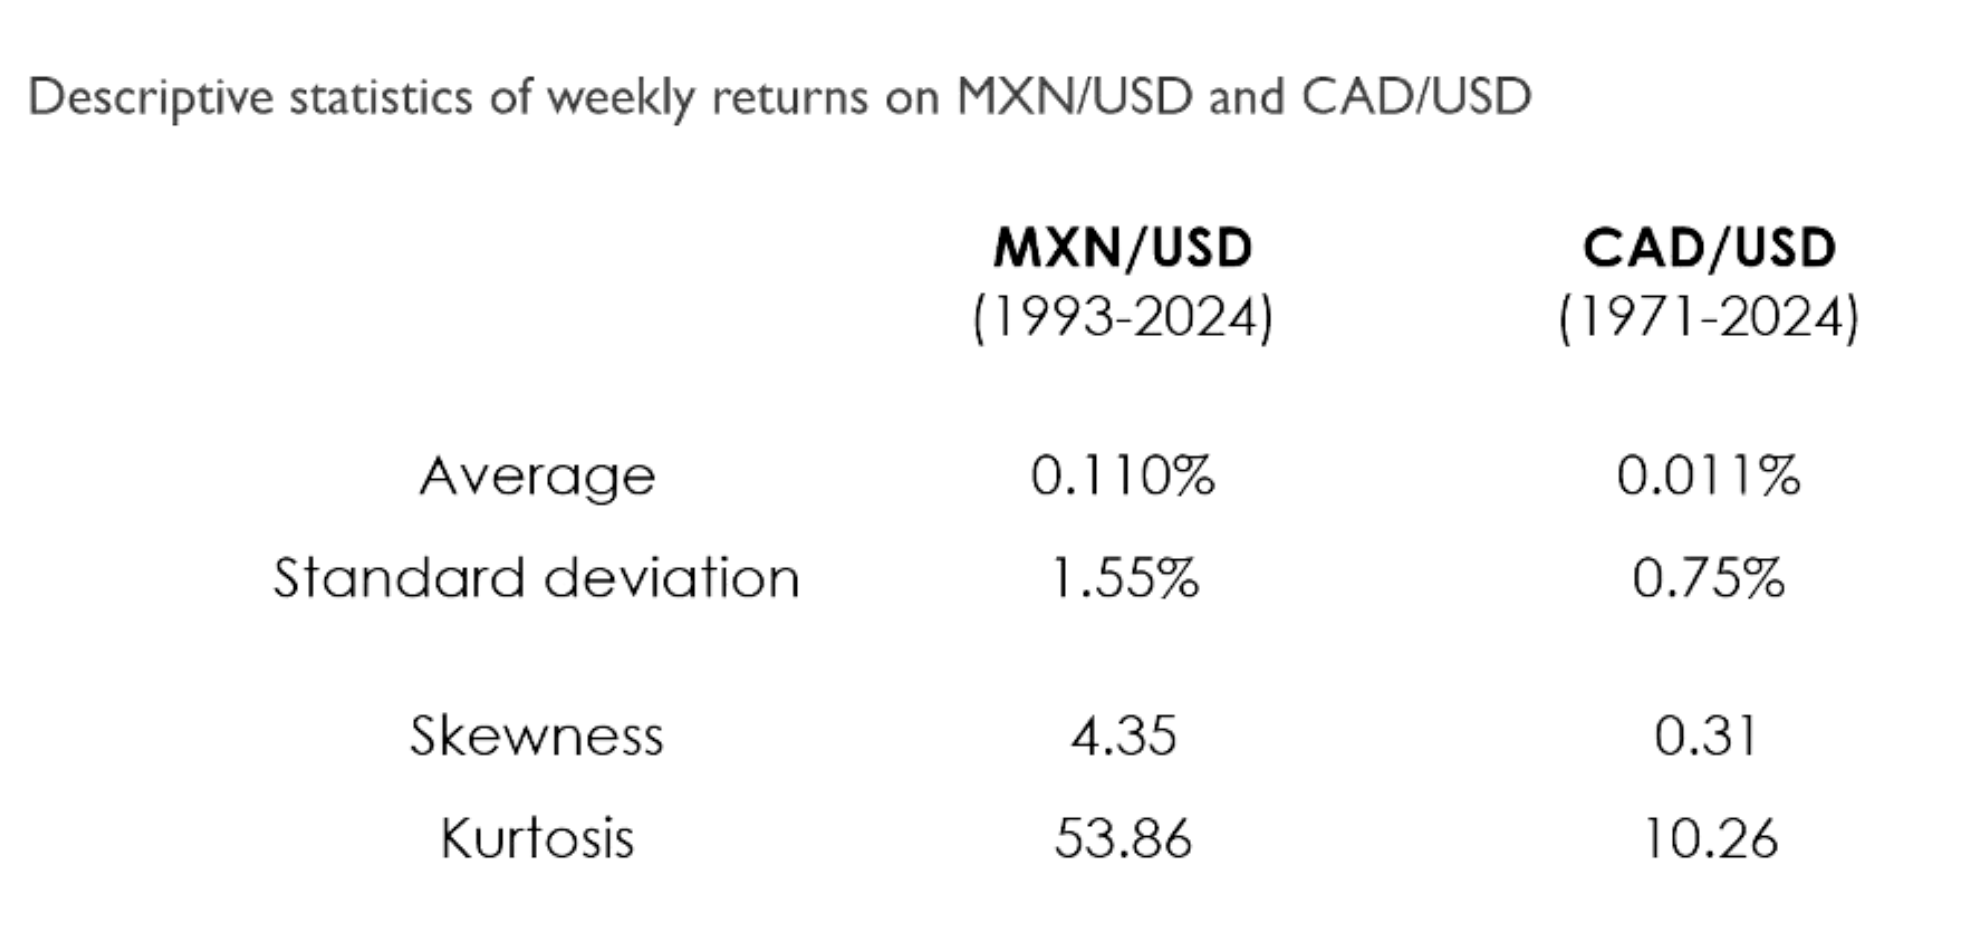
Skewness indicates that there are more positive outliers in the distribution indicating a high volume of change in MXN / USD (depreciation)
Kurtosis measures the fatness of tails, the MXN / USD has a fat right tail indicating that there are more extreme depreciation events that are likely to happen in the future
Missing the 95% confidence interval which measures (Clarify on this)
Currencies of Advanced vs Emerging Markets
Currencies of advanced countries
Reasonable to consider symmetrical distribution in view of the symmetry of the returns
More appropriate to consider a distribution that takes into account of fat tails, extreme values
Currencies of emerging markets
Symmetrical distribution is not appropriate
Historical distribution is generally very skewed and shows large magnitude changes
Mainly due to significant depreciation / devaluation of these currencies that have occured
Exchange rate volatility changing
Time-varying volatility can be estimated with different approaches:
Rolling standard deviation of the returns
Autoregressive (GARCH) model on returns
Important to use recent data to get more realistic, more accurate results from more complicated models as complicated models are easier to break
Statistical models may determine how exchange rate returns (and their volatility) vary over time. However, they do not help us understand why exchange rates fluctuate in such a way. Therefore it is key to remember the fundamentals (interest rates, macroeconomics)
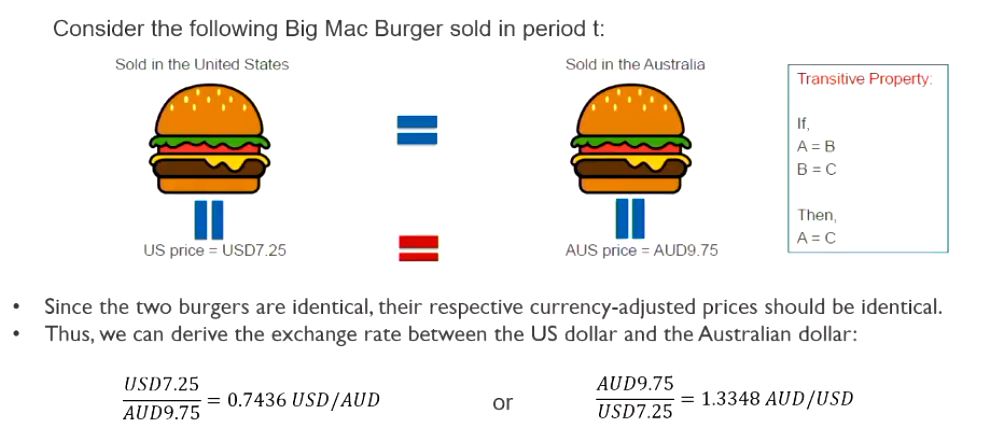
Absolute Purchasing Power Parity (PPP)
The same good is at the same price everywhere (law of one price)
The exchange rate equals the consumer price ratio
Assumes:
No transaction costs
Same basket of goods in all countries
Example:
IF APPP holds RPPP will hold
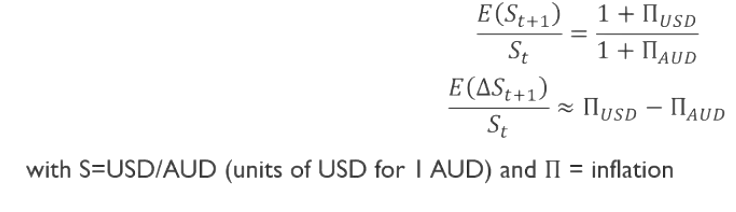
Relative PPP
Considers price growth (rate of inflation) rather than price levels
Expected exchange rate growth = inflation differential
Same simplifying assumptions as absolute PPP
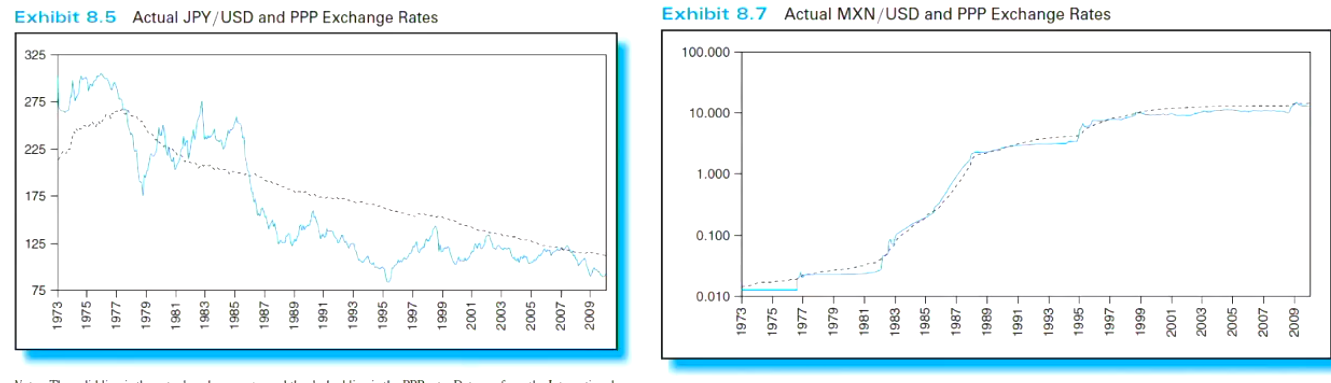
PPP in the real world
PPP gives a framework as to where currencies are trading in the bigger picture
Long-term fundamental valuation
Useful in the long term
Not very effective in the short term
Common CPI alternatives
Big Mac Index (used to predict exchange rate index)
IKEA Billy Bookshelf Index (produced in one area and shipped to other countries, better index)
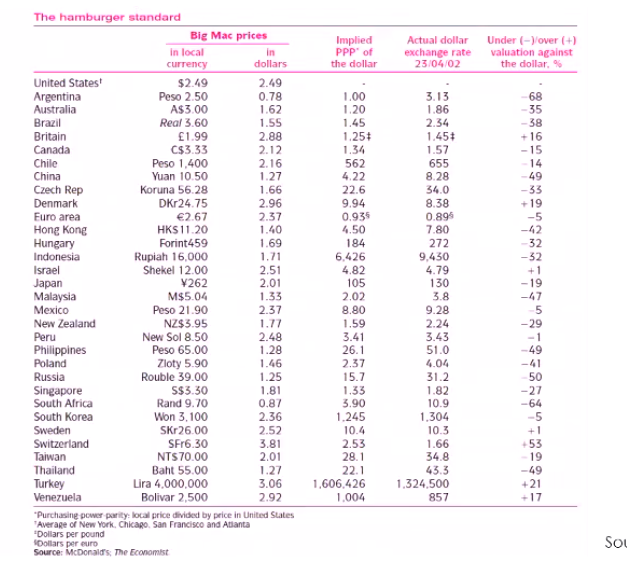
PPP investment application
Sort currencies into portfolios based on 5 year change of PPP
Portfolio 1: 25% of currencies that are most overvalued
Portfolio 4: 25% of currencies that are most undervalued
Result:
Find predictive power for the cross-section of currency excess returns
Buy P4 and Sell P1, Long-short
Theoretically will hold but there may be difficulties finding some currencies (CFA franc for example)
Uncovered Interest Rate Parity
Hypothesis that the expected return on the uncovered (unhedged) foreign money market investment equals the known return from investing in risk free rates internationally
Idea:
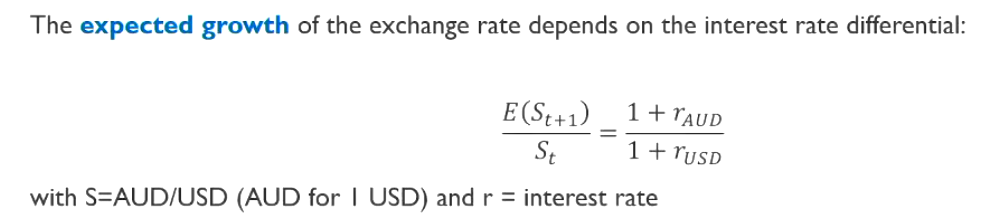
The expected growth of the exchange rate depends on the interest rate differential
We are not hedging anything we are just using the spot rate
Explanation for parity:
Interest rate differential across countries on bonds of similar credit risk should reveal the expectation of depreciation
Initially, attractive interest rates (say australian rates are higher) should be met by an FX move (AUD depreciates by the same amount, cancelling the effect of rates), resulting in the same return
The ex post realised exchange rate will not necessarily equal the rate expected on average
Basically the same as CIRP, but now even in uncovered transactions, there is nothing to earn
Formally”
Assumes free capital mobility and the absence of taxes on capital transfers
The zero investment (zero-cost) portfolio of money market instruments should yield 0 in expectation if investors are rational and risk neutral
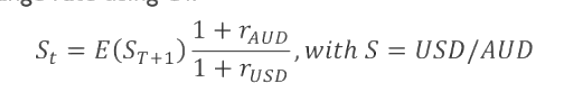
Current exchange ratre formula UIP
Implications of UIP
Interest rate differential, CP = expectation of exchange rate return
The USD Return on a risk free investment must be the same for all countries
Not interesting in a country with higher rates
Expected depreciation is expected to offset the higher rate
Exchange rate coverage without cost
forwards contract price = expected exchange price
Essentially we dont need the forward rate
Valuation model with monetary shock
Impact of a money supply shock (one time and permanent shock) in the USA (QE)
American consumers are endowed with more money
Initially all invested in risk free bonds (banks) so bond yield / interest rate (R usd) will fall
Then consumers will gradually buy goods
Interest rates increases again and inflation slowly picks up
In the long run all money invested has been spent on goods
Therefore higher consumer prices while interest rate goes back to the initial value
Represented by:
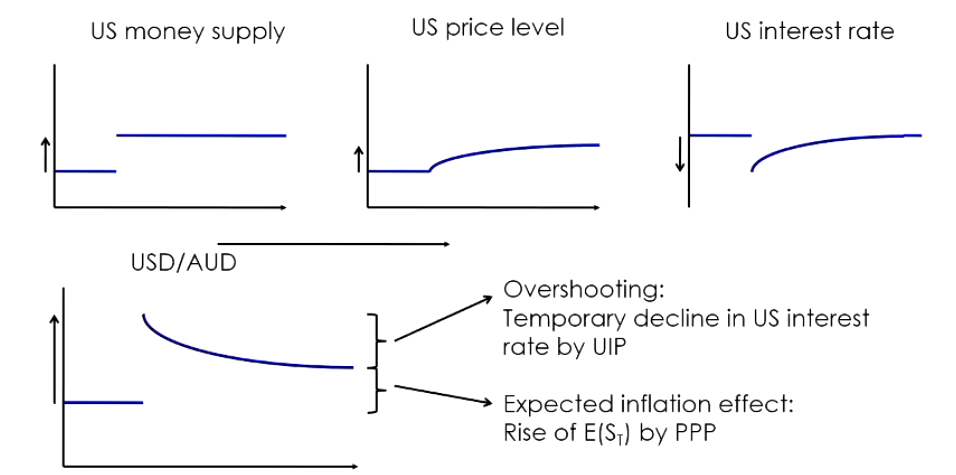
Overshooting is the phenonmenon where the exchange rate is temporarily higher than it should be, and takes time before settling
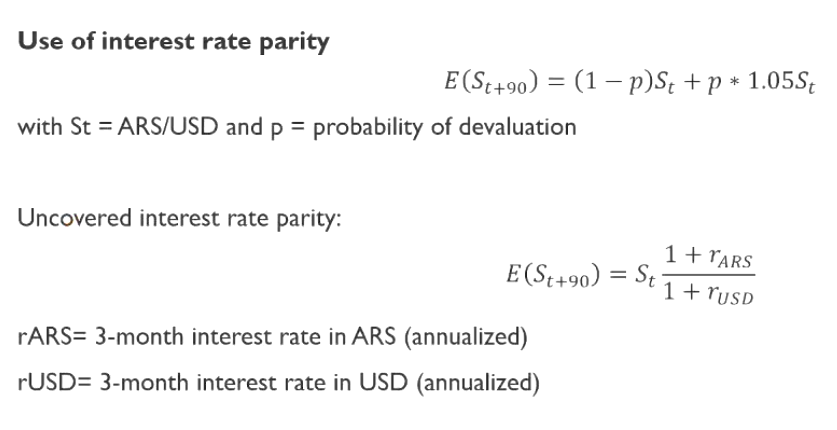
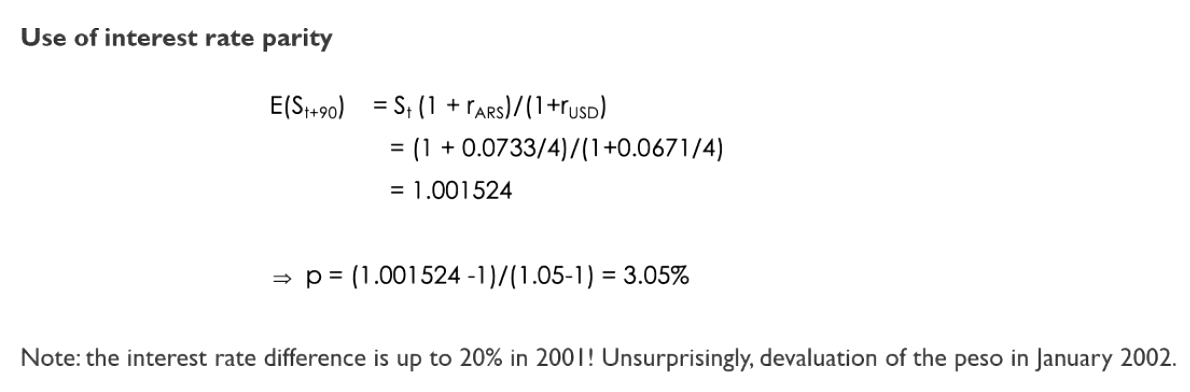
Forecast of exchange rate devaluation
Majority of currencies are not floating
Devaluation can be forecasted using:
Balance of the current account (trade + financial balance)
Monetary growth
Interest rate and inflation differential
Measures of overvaluation using PPP
Use of interest rate parity for predicting devaluation
ARS interest rate is higher than USD indicating that ARS is expected to depreciated by the market
Using expectation spot rate formula:
Floating exchange rate system
Free float (clean): determined solely by supply and demand
Dirty float: market forces with some central bank intervention
Managed float: more central bank intervention than a dirty float
Assume in this course that otherwise mentioned all currencies are using the floating exchange rate system
Fixed / Pegged exchange rate system
Target exchange rate set by the government with the central bank intervening to prevent significant deviation
Requires coordinated monetary policies and commitment to the target rate
Target zone agreement
allows market forces but only within a margin around agreed upon fixed exchange rate
Crawling Peg
Currency deprecation against a reference currency on a regular controlled basis, used to ease transition from fixed to fluctuating exchange rate
What is money?
Serves as a store of value, medium of exchange, and unit of account
Managed by different institutions (Federal Reserve, RBA for USD and AUD)
Previous exchange rate systems
Gold / Silver
1 Pound Sterling = 1 Pound of Sterling Silver
$35 = 1 Oz of Gold (US Bretton Woods)
Features
Exchange rate based on the law of one price
Extremely stable inflation
Rigid supply restrictions
Bretton Woods (1944-1971)
US held 2/3 of all gold reserves in the entire world
Gold was pegged to the dollar at a fixed rate, other currencies were pegged to USD
IMF was introduced to provide liquidity to nations in crisis
Nixon Shocks (1971)
Ended the convertibility of USD to Gold
Huge US deficits (due to the vietnam war, foreign banks demanding gold redemptions)
Marked the shift to fiat currencies
The dollar retained the status of the premier currency despite no gold backing
Floating exchange rate
Exchange rate between two freely traded currencies
Exchange rate fluctuations are determined by supply and demand:
Market equilibrium
High exchange rate volatility
Limited central bank intervention
Temporary stabilisation only
Exchange rate risk:
Can be determined by historical FX volatility
Historical return distribution is useful for predicting up/down movements
Possible intervention by monetary authorities
Determines some ceiling or treshold
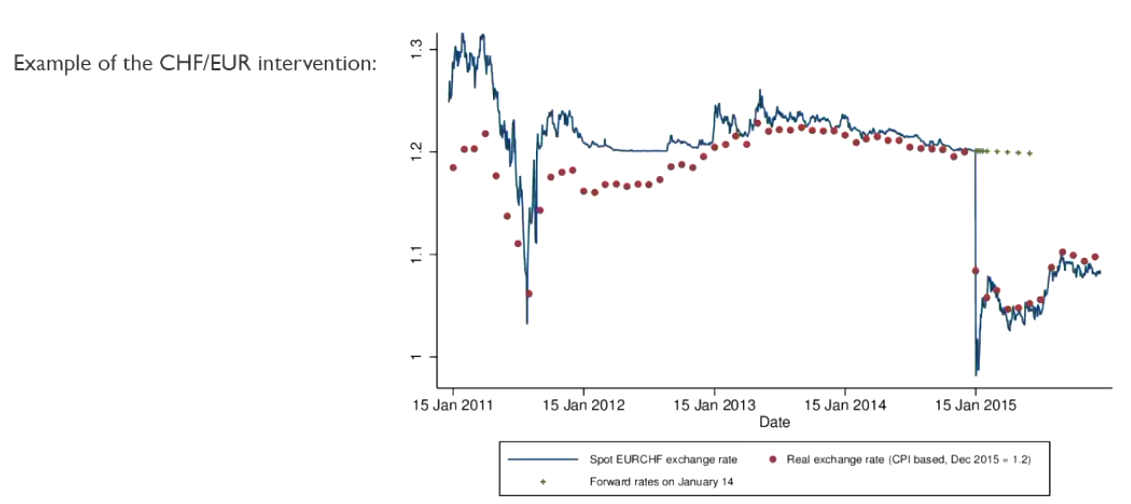
SNB sets a floor at 1.21/1 CHF / EUR in 2011
Fixed exchange rate
Predetermined exchange rate at a fixed level
Determined in advance by the central bank
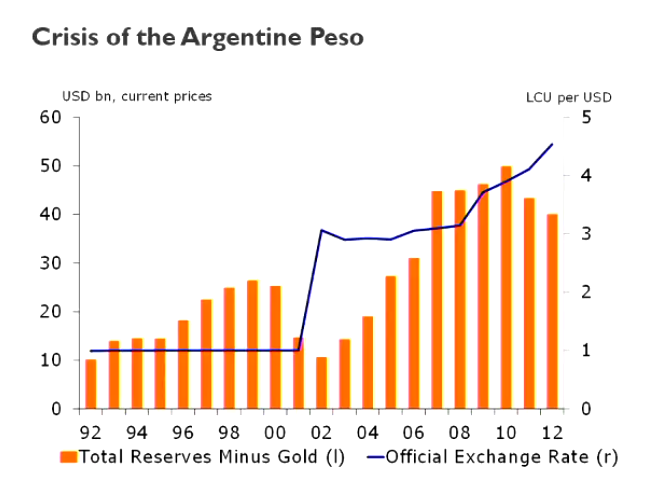
There is still some exchange rate risk
Collapse of the fixed regime (IDR, ARP)
Abrupt and substantial devaluations of currency (GBP post suez)
Arrangement is not credible in the long term
Devaluation incentive in case of economic crisis
Subject to speculative attacks (George Soros GBP)
Pegged exchange rate
Predetermined exchange rate with authorised adjustment
Compromise between fixed and floating regimes
Free fluctuations within a certain range
Adjustments are based on economic fundamentals
inflation, growth, current accounts
Low short-term volatility
Exchange rate risk
low daily volatility is not real risk
latent volatiliy is the real risk (political risk esp if developing countries)
Difficult to quantify as there is no historical data
Called the “Peso” problem
Agreement not very credible in the long term
Devaluation incentive in case of economic crisis
Subject to speculative attacks
Impossible trinity
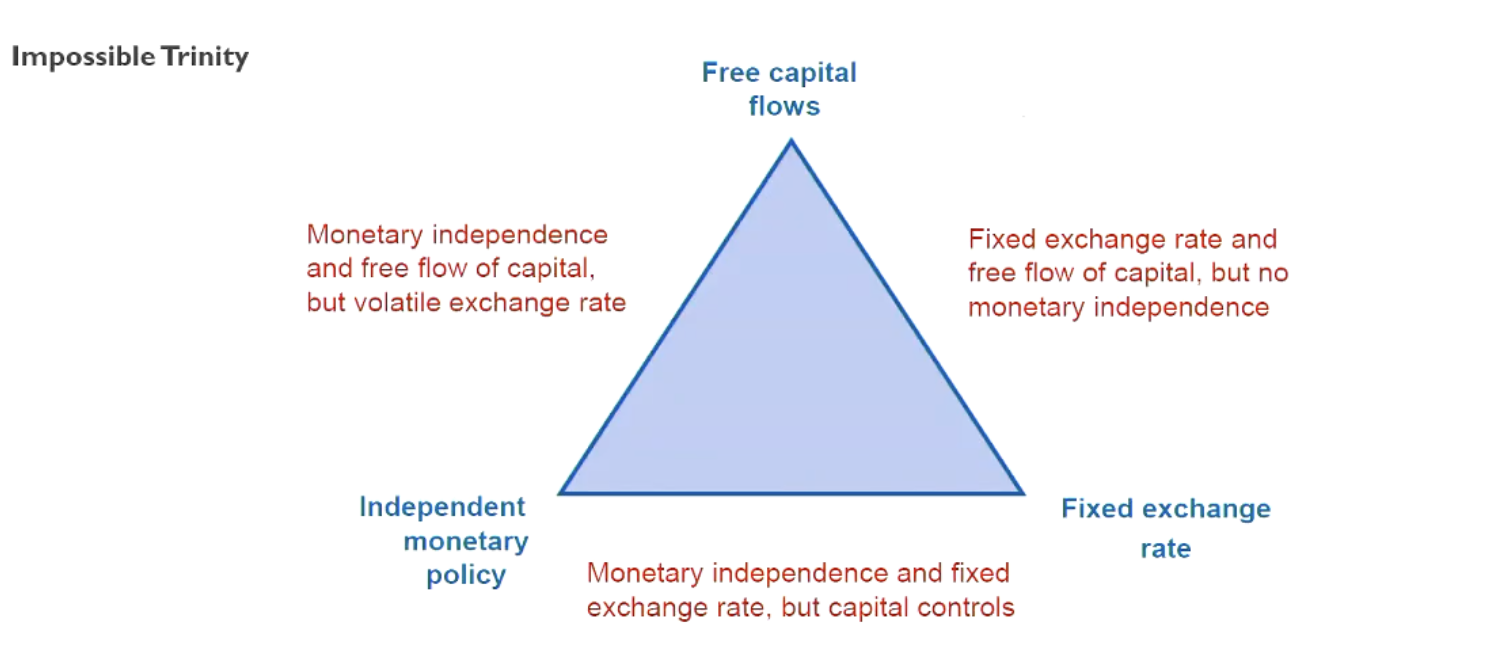
one currency can only have 2 of these charactheristics but not all three
Factors that determine exchange rates
Balance of payments
international trade and capital flows
Economic fundamentals
inflation, growth, commodities
Financial conditions
interest rates, stock market performances, level of uncertainty
Balance of Payments
Synthesis of international financial flows observed during a given period
accounting identity
Each flow is associated with currency demand or supply
Significant edia, analyst, investor, media attention
main source: IMF open source data, easy to access / public
Balance between trade and financial flows
Current + Financial accounts = 0
Accounting balance due to changes in the foreign currency reserves of the central bank
Current account + financial account = Delta reserve
Example: decrease in reserves if total balance < 0
Economically in a floating exchange rate system, the exchange rate would appreciate / depreciate to keep the system balanced
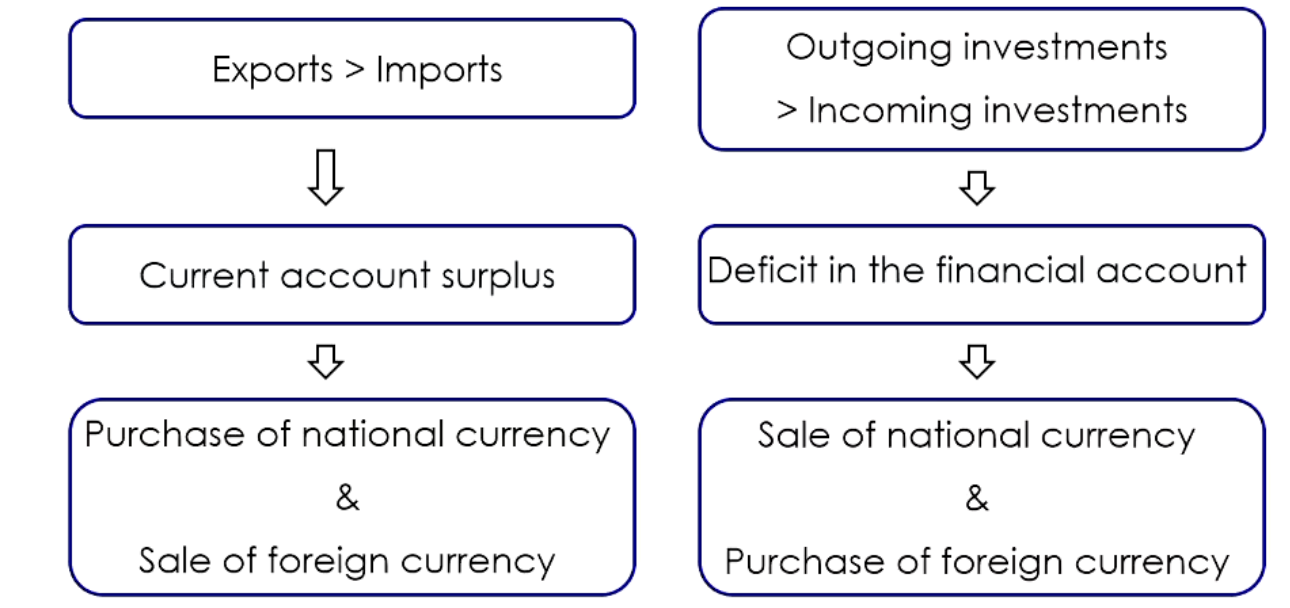
trade deficit
Trade balance = not informative per se about the direction of the exchange rate, if
current account deficit = financial account surplus
it is important to analyse the entire balance of payments as trade deficit leads to financial surplus (generally)
Financial account
main aspect to be analysed
if foreign investors want to finannce a trade deficit = no problem
balance between depreciation (trade deficit) and appreciation (financial surplus) of the currency
natural situation in the case of strong economic growth
Consumption > production: trade deficit
High profitability = high returns on investment: financial surplus
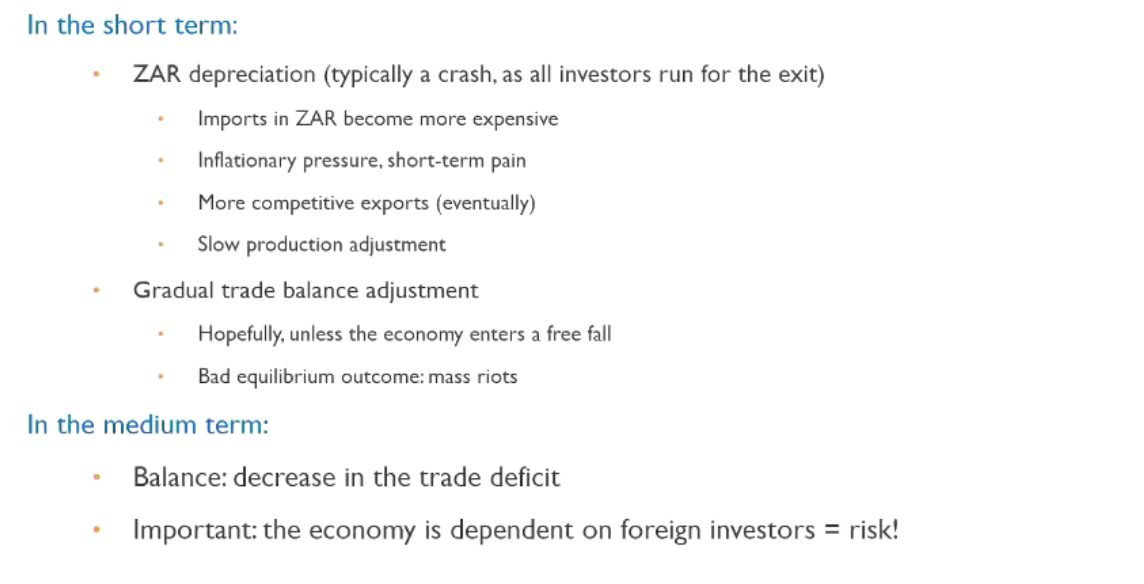
if foreign investors no longer want to finance a trade deficit it could lead to
liquidiation of financial investments (capital flight)
currency depreciation (no one wants the currency, no demand)
Case study for BOP (USA)
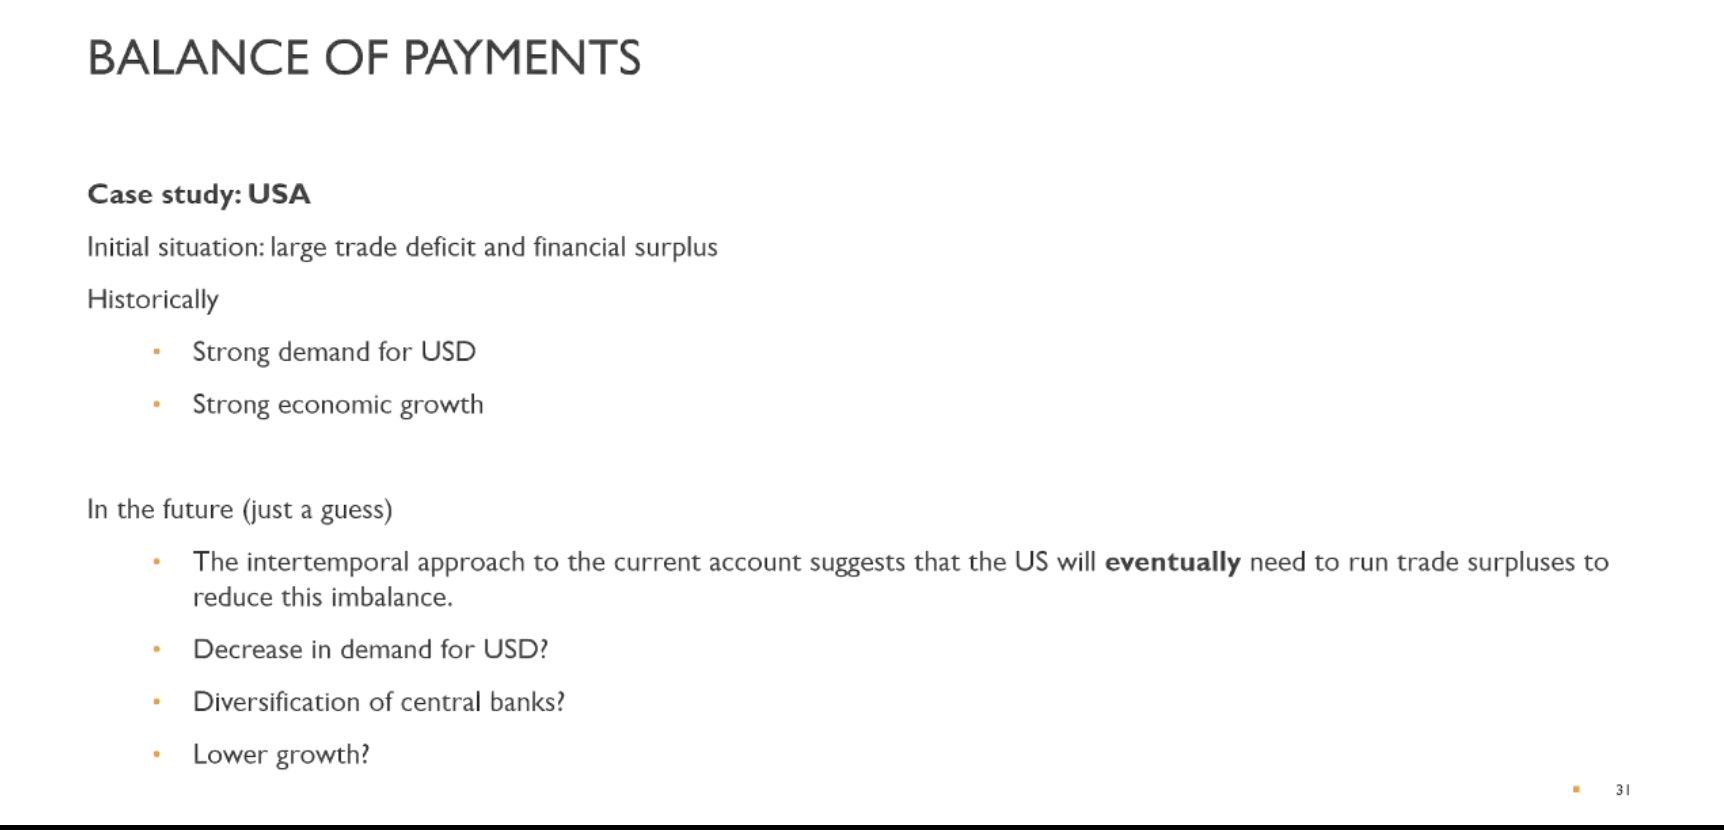
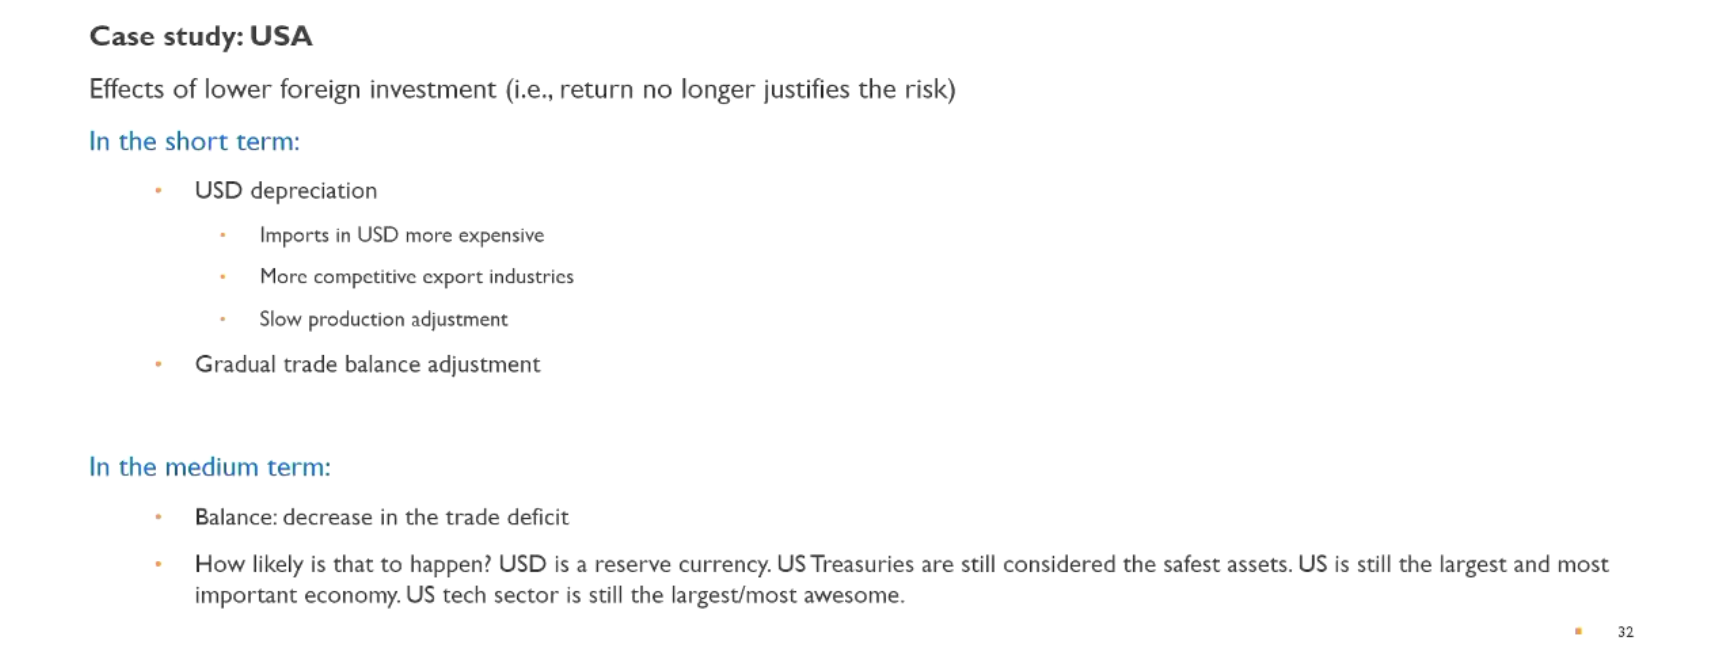
Scenarios are unlikely as US has a lot of economic power (innovating companies, leading products that are exported)
Case study for BOP (Emerging Market)
Practical application of the above concepts for emerging markets
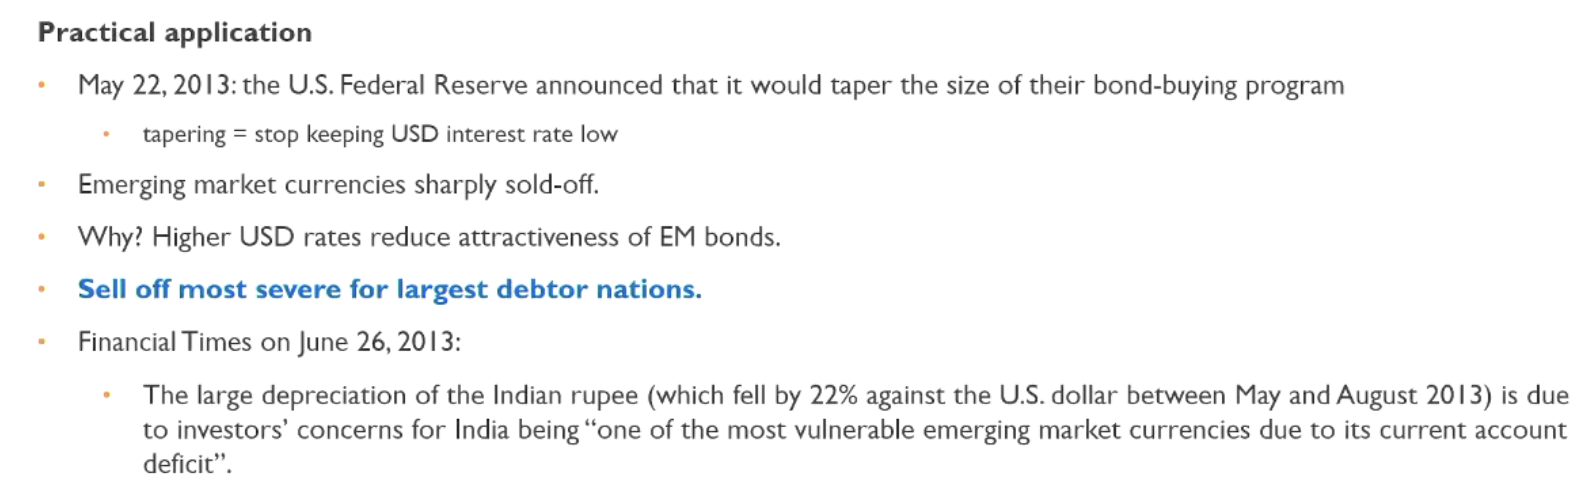
net foreign position (asset - liabilities at a country level) relates to currency returns
the intuition is that investors demand a risk premium to hold debtor nations currencies due to the risks, this is especially true if the currency is held in a foreign currency
Observed effects of economic fundamentals
Appreciation of a currency occurs ceteris paribus if there is:
1.) Strong economic growth
Increase in investment returns
Increased foreign investment
Interest rates with expected economic growth
taylors rule
also interest rates hike from the central bank to reduce inflation from the increase in economic growth
Note that the effect is partially offset if import > export growth
2.) Higher commodity prices for exporting countries (Australia, Canada, NZ)
more corporate profits and equity prices (BHP, Rio Tinto)
improve the country’s economic conditions
speculative component for FX investors
3.) Rise in domestic interest rates
increase in demand for domestic bonds (carry trades)
can signal stronger economic growth and higher stock prices
not necessary due to higher economic growth and higher inflation
4.) Foreign interest rate cut
decline in demand for foreign bonds → depreciates foreign currency relative to domestic currency therefore domestic currency appreciates
5.) Good times for cyclical countries
Ex: emerging market countries
Currency “speculative” growth and periods of calm (low volatility)
6.) Times of crisis for non-cyclical countries
Ex: USA, Japan, Switzerland
safe haven currencies in recessions and period of uncertainty
Central Bank and Exchnage Rates
Purpose of intervention
Influence exchange rates to influence a currency
In general, to limit the appreciation/depreciation of the currency
Appreciation: Loss of competitiveness of exporters
Depreciation: Rising “imported” inflation
Interventions can be:
Sterilised
Unsterilised
Unsterilised Intervention
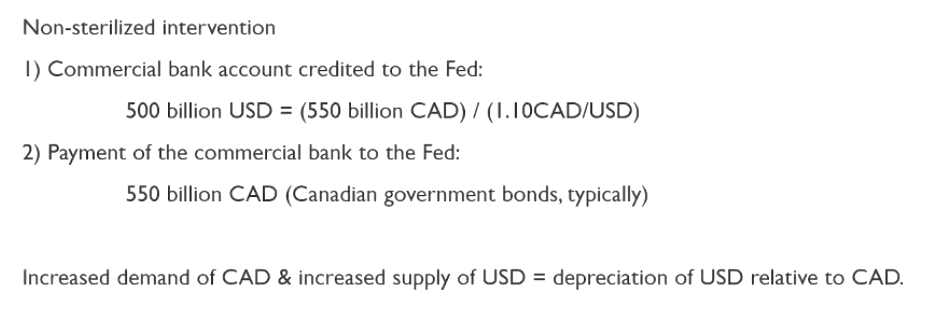
There are downsides:
Increased money supply (500 Billion USD more circulating in the economy)
Medium / long term inflation effects
Therefore there is a potential conflict when seeking price stability
Sterilisation can solve this
Sterilised Intervention
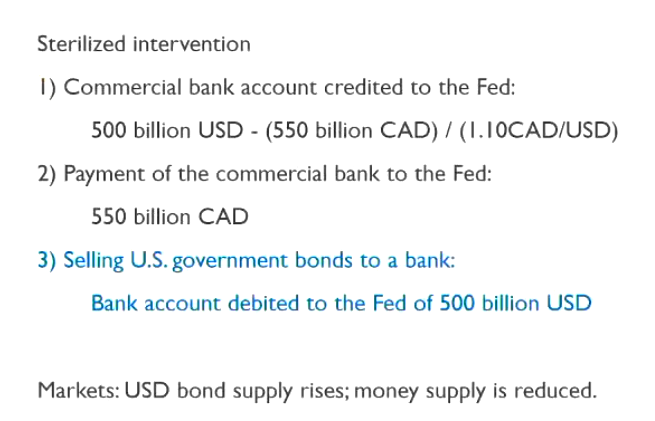
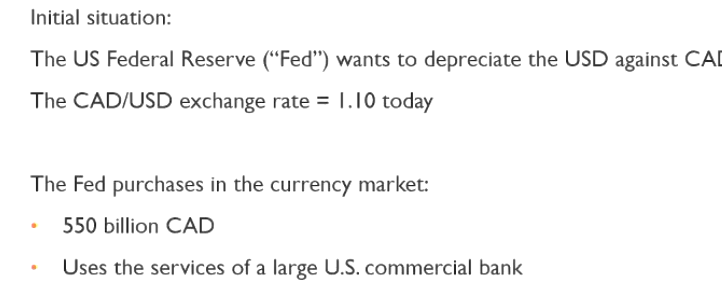
Example of intervention

Intervention Success depends on
Size of intervention relative to daily volume
Size of the available foreign exchange reserves
Current market trends
Coordination between nations (Plaza Accords 1985 took Japan, Germany and USA to depreciate USD)
Number of interventions
Sterilised or Non-Sterilised intervention
It is often easier to prevent appreciation than a depreciation
Markets are also typically pessimistic about the success of an intervention
Forecasting exchange rate
still a prevailing view that exchange rate changes are difficult to predict in the short term
A random walk model performs just as well as any estimated model in the short term (1-12 month time horizon)
exchange rates are asset prices like stock prices and therefore we should expect they behave like other assets which are also hard to predict
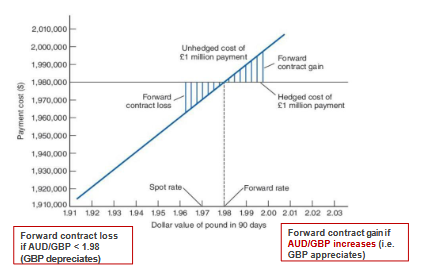
Investment profitability without currency hedging
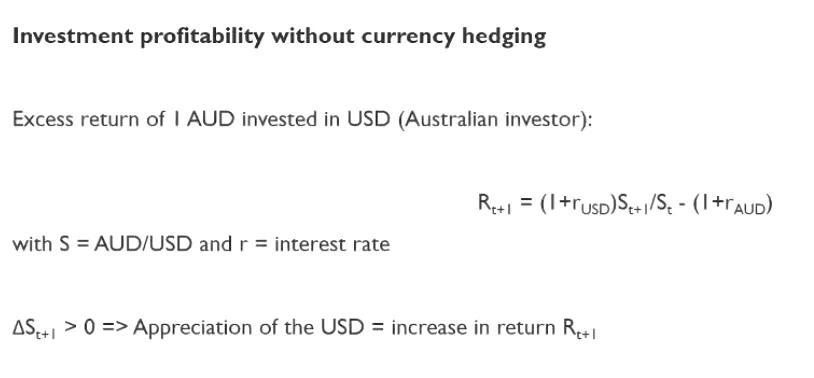
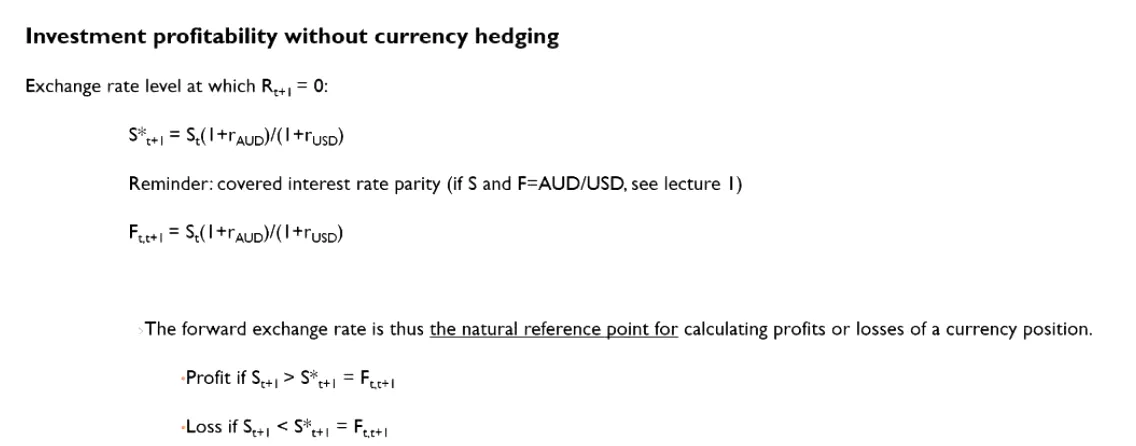
The return has two drivers: the interest rate differential and the currency movement. USD appreciation boosts returns; depreciation hurts them.
Interest rate differential: When converting, one earns the USD interest rate instead of the AUD rate. If R_usd > R_aud, already profitable before currency moves
Profit if the USD ends up stronger than the forward rate predicted as converting back to AUD at a better rate than expected.
The break-even rate is the future exchange rate at which these two effects exactly cancel out — where what you gained from the interest rate differential is precisely wiped out (or matched) by the currency move, leaving you with zero excess return. That break-even point turns out to equal the forward exchange rate.
Loss if the USD ends up weaker than the forward rate predicted getting less AUD when converting back than the forward rate implied.
Real return always compared against the forward rate
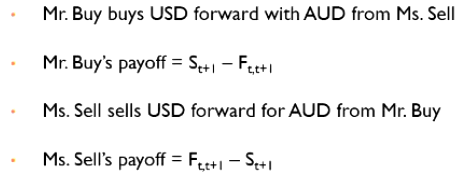
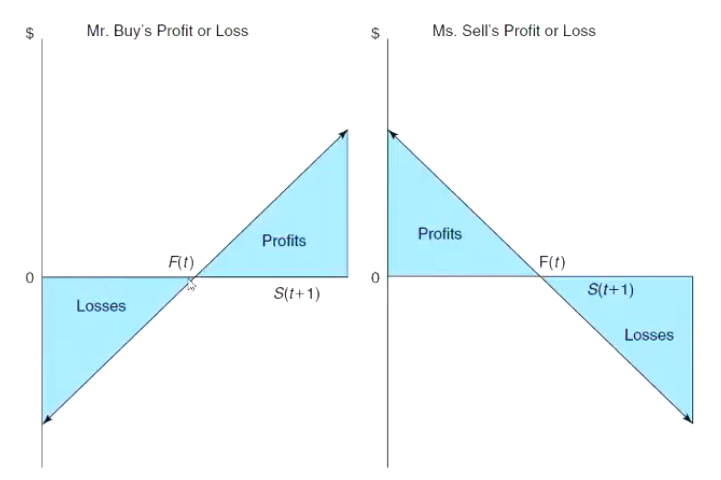
Forward Contracts
Is an agreement between two parties to buy or sell a security (or currency) at a pre-specified price on a pre-specified date T.
Party agreeing to buy (sell) the underlying currency in the future is said to “buy (sell) a forward” and will have a long (short) position in that currency
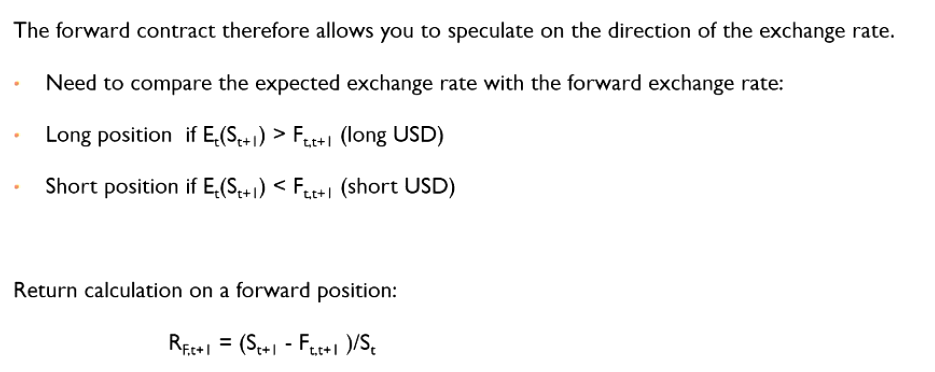
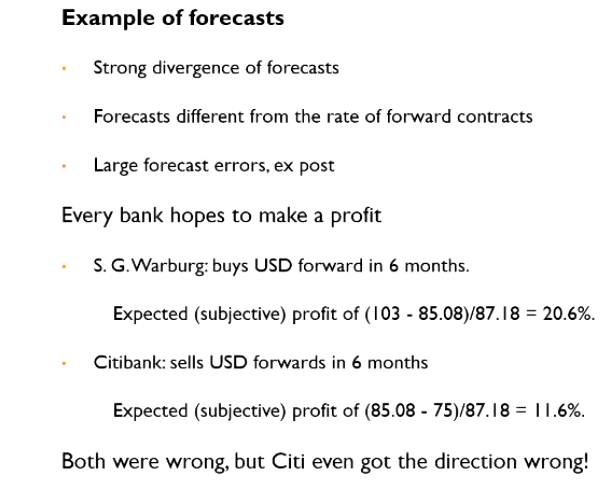
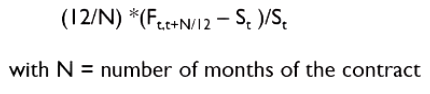
Speculation Strategy based on the direction of exchange rate
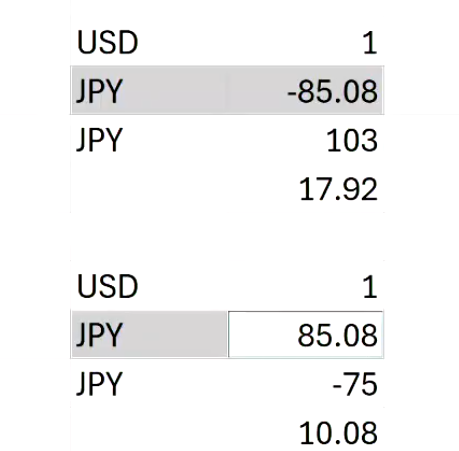
Example of Forecasts and speculation transaction
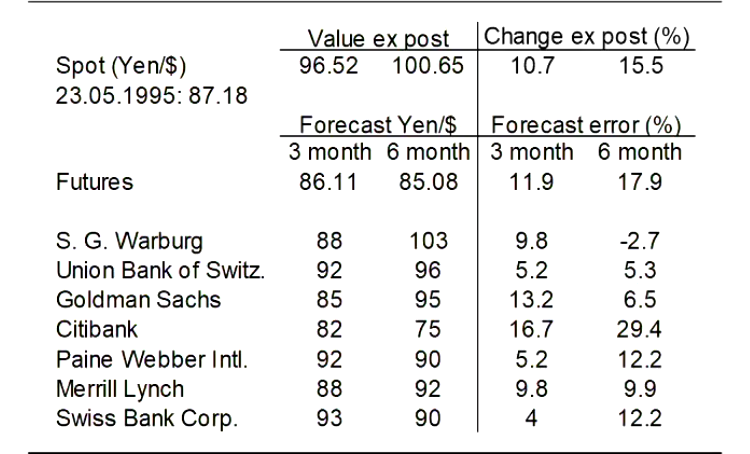
Note: Example evaluates Warburg and Citi predictions
Usefulness of professional forecasts
Generally there is some ability to predict future movements in the exchange rate (and in the right direction)
Forecasters do this by:
Extrapolating recent trends (technical analysis), while at longer horizons they tend to forecast a return to a long term equilibrium, such as PPP.
Capture information like:
real exchange rate
ratio of current account balance to GDP
currency risk premium
Forward rate premium and discounts
USD is quoted at a forward premium if forward rate is higher than spot rate
USD is quoted at a forward discount if forward rate is lower than spot rate
Basically pay more AUD for one USD in the future if there is a premium
The forward rate is typically annualised and in %
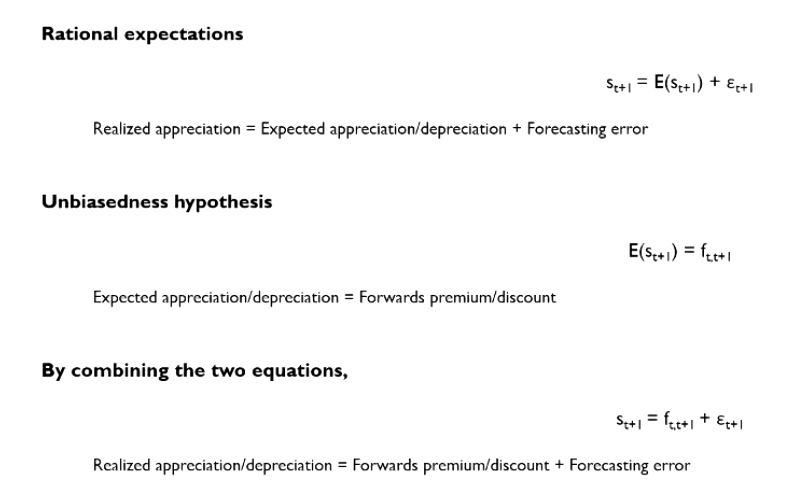
Forward exchange rate as a predictor of the future spot rate
Recall
CIP: Ft,t+1 = St (1+raud) / (1+rusd)
UIP: Et (St+1) = St (1+raud) / (1+rusd)
with S and F expressed as AUD/USD (AUD for 1 USD)
Combine UIP with CIP: Et (St+1) = Ft,t+1
Et (St+1) - St = Ft,t+1 - St
Expected currency return: Et (St+1) - St / St
Forward premium: Ft,t+1 - St / St
Et (St+1) = ft,t+1
rtAUD - rtUSD, S = AUD/USD
UIP (together with CIP) implies that forward exchange rate is an unbiased predictor of the future spot exchange rate
Forecast error = 0 on average
Economic background behind the forward exchange rate
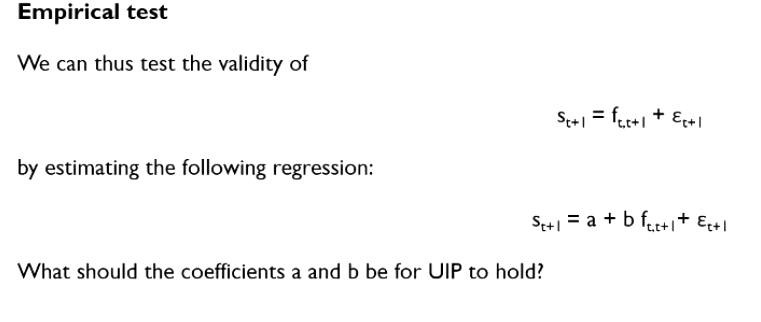
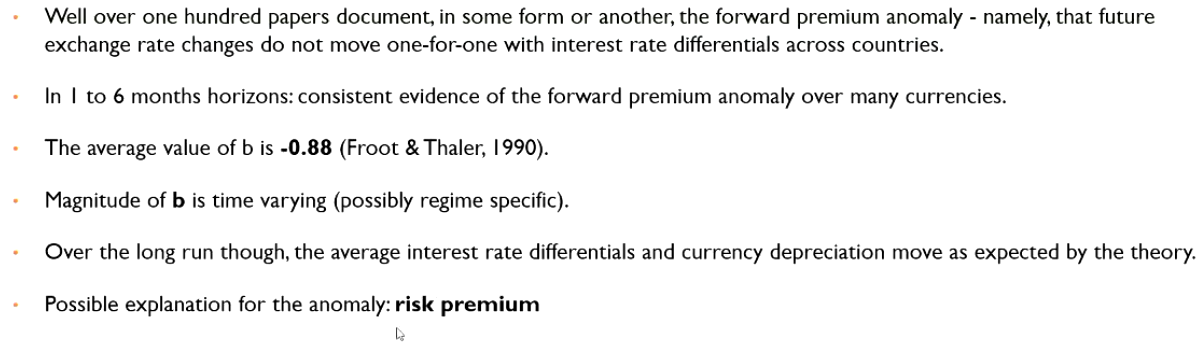
Empirical Test behind forward premium theory
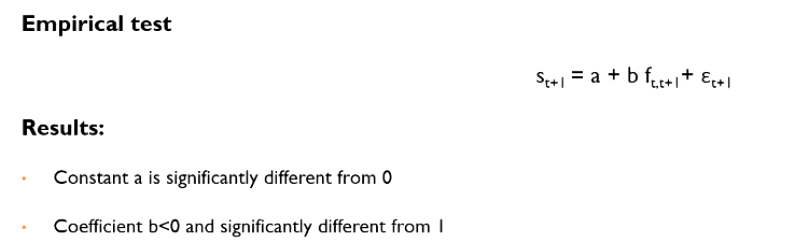
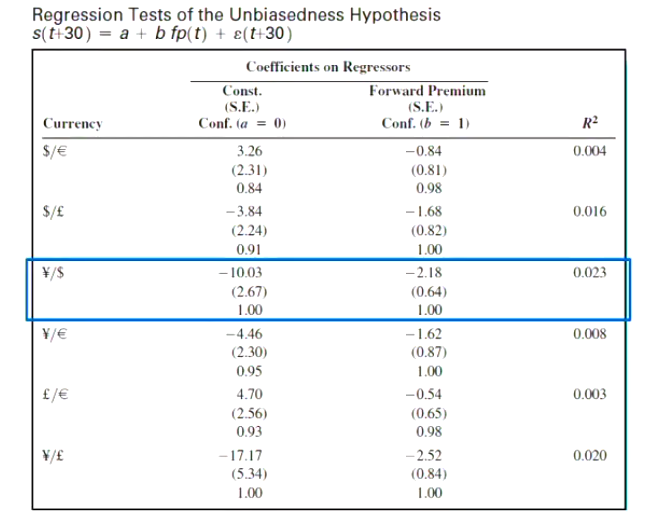
Interpretations:
a = -10.03 USD at a discount because RJPY < RUSD, therefore USD depreciates on average
b = -2.18 if USD becomes more at a discouint because RJPY - RUSD is more than < 0, USD should depreicate but it appreciates
Implications:
the constant (a) is in the right direction (higher interestr rate currencies depreciate on average in the long run)
the slope (b) suggests that UIP does not hold in short-term: countries with higher interest rates = future currency appreciation
This may be due to the risk premium
Risk Premiums
Assumes that the true model of exchange rate changes is
Et (St+1) = Ft,t+1 + RPt
where RPt is a risk premium adjustment
if risk premium is always 0, UIP Holds
But we have seen it fail empirically
In practice RPt is often positive when ft,t+1 is negative
AUD depreicates in bad times against JPY so RPt > 0
Domestic inteest rates (AUD) are higher than foregin interest rates (JPY) So ft,t+1 < 0
Forecasting techniques
Fundamental Analysis
Econometric / Statistical models
Economic and financial fundamentals
Technical Analysis
Chartists (patterns)
Statistical analysis (filters, momentum, regressions)
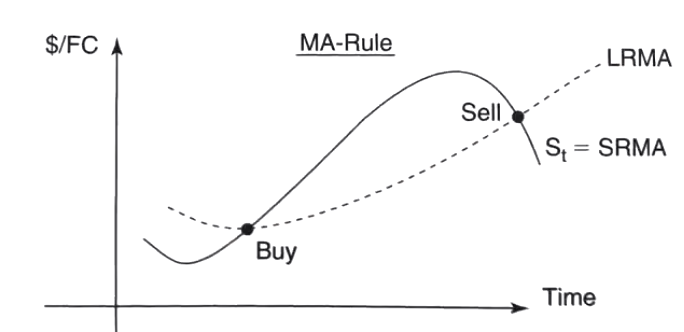
Technical Analysis
The idea that currencies follow trends and reversals
The majority of strategies are based on the temporal evolution of a currency
Filter-based strategies
to distinguish trrends and reversals from noise
Typically economists have a negative view of this method as it is inconsistent with the efficient market hypothesis
Typically short term and used by retail traders
In the long term fundamental analysis is always favoured
Hedging with Forward Contracts vs Money Market — Which to Choose?
Forward Contract = (Amount × Forward rate) / Domestic interest rate
Forward contract → use forward rate and domestic interest rate
Money Market = (Amount / Foreign interest rate) × Spot rate
Money market → use foreign interest rate and spot rate
Never mix rates between the two methods
Foreign Currency Risk Premium & Domestic Currency Return
Risk Premium (approximation):
Expected exchange rate appreciation − Interest rate differential = Expected appreciation − (r_domestic − r_foreign)
UIP holds if: risk premium = 0 (expected appreciation = interest rate differential) UIP does not hold if: risk premium ≠ 0
Domestic Currency Return on Foreign Bond (two methods):
Method 1: Domestic rate + Risk premium Method 2: Foreign rate + Expected appreciation
Method 2: Foreign rate + Expected appreciation
Both give the same answer
Example:
UK rate 5%, Swiss rate 3.75%, expected CHF appreciation 2%
Risk premium = 2% − (5% − 3.75%) = 0.75%
UIP does not hold
Domestic return = 3.75% + 2% = 5% + 0.75% = 5.75%
Forward and Future contract
A promise to buy or sell a specific quantity of a currency on a specific date
Characteristics of Forward Contracts
Private agreement between two parties (OTC)
Terms of the contract specific to the needs
Fixed maturities: 1,2,3,6, or 12 months
Large contracts
Significant credit (counterparty risk)
As it is only between two parties, there is always a risk that the other party may go bankrupt, hence not be able to pay
Main actors are typically large institutions
Banks, Hedge funds, MNCs
No quotes → no secondary market
Fixed and non-reversible position unless there is mutual agreement between parties
No action until contract expiry
No margin call but a large initial deposit is required
Its main use is to receive currency at a predetermined price
Prices are derived from the CIRP (see flashcard)
Characteristics of Future Contracts
Contracts are traded on a organised exchange (CME)
Standardised contracts
Small sizes
Fixed expiry date
4x per year: Mar, Jun, Sep, Dec: IMM Dates (3rd Wed of the month)
High daily liquidity but not enough for a large player (>100 Million USD position)
Price is quoted around the clock as positions are marked to market
Easy to close position even before maturity
No credit risk but maintain a margin account
Guarantees the counterparty the payment of future losses and risk of possible margin calls
Mainly used for heading and short term speculators
Currency is rarely physically received or delivered
Betting on the uncertainty of timing and amount
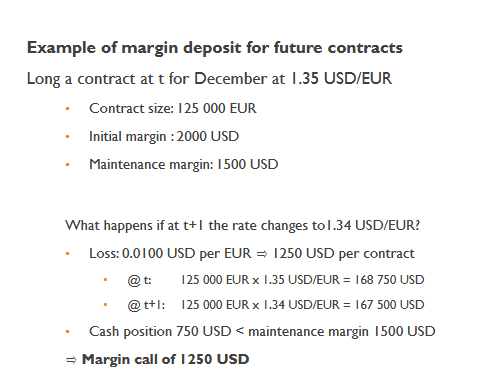
Initial margin
Amount to be deposited when the contract is bought / sold
Depends on exchange rate volatility
USD 1000 to 4000 per contract on CME
Typically cash or collateral (gov bonds)
Shares listed at NYSE or physical gold can also be margin
Valued only at 70% of current value though
There is an oppoiortnity cost if the initla margin did not come from colateral (foregone interest)
Maintenance margin
Minimum margin level required each day
70 to 100% of the initial deposit level
The client must cover his / her loss
the contract can be closed if necessary
Example:
Main participants
Arbitragers
Seek to earn risk free profits by taking advantage of differences in interest rates amongst countries
Use forward contrats to eliminate the exchange rate risk
Commercial traders / hedgers
use forward contracts to elimintate or cover the risk of loss on export / import orders
Mostly MNCs
Speculators
Make profits from FX fluctuations
Currency Swaps
Fixed for fixed currency swap
Exchange of interest payments and capital in one currency to interest payment sand capital into another currency
Characteristics:
Private agreement between a client and a bank (OTC)
Appear off balance sheet
No secondary market
Reversible position only by mutual agreement