01 - Biostatistics
1/28
There's no tags or description
Looks like no tags are added yet.
Name | Mastery | Learn | Test | Matching | Spaced | Call with Kai |
|---|
No analytics yet
Send a link to your students to track their progress
29 Terms
biostatistics
application of statistical principles in medicine, public health, or biology
collect information data → summarize, analyze, and interpret results
make inferences
draw conclusions
study samples
subsets of population of interest
proportion (%) of adults in sample estimates proportion in population
sample → inference → population
epidemiology
study of distribution and determinants of health events in population
distribution = frequency and pattern
determinants = cause and risk factors
clinical epidemiology
branch of epidemiology to apply epidemiologic methods to individual patient care
purpose → determine impact of disease and health conditions in clinical settings to enhance patient care through evidence-based practice
population-based approach → uses data from groups of patients to guide clinical decisions for individual patients
risk assessment → evaluates likelihood of disease occurrence or outcomes in patient populations
diagnostic accuracy → studies performance of diagnostic tests and procedures
prognosis → predicts likely course and outcomes of disease
treatment efficacy → assesses benefits and risks of therapeutic interventions
public health
health of population and all factors that influence health of individuals and groups of people
improve health → education, inequalities, housing, lifestyle
improve services → clinical effectiveness, planning
protect health → infectious disease, environment
descriptive statistics
data distribution
data representation
measurements of central tendencies
mean → average value; used for normal data
median → middle value; used for skewed data
mode → most frequent value; used for categorical data
measures of variability
range → difference between highest and lowest values
standard deviation → spread around the mean
interquartile range → middle 50% of data set
data distribution
normal distribution:
mean = median = mode
mean ± standard deviation
skewed distribution:
mean affected by outliers
median ± interquartile range
data presentation
box plot → median, IQR, outliers
bar graph → compare groups (often ± SD)
pie chart → proportions of categorical data
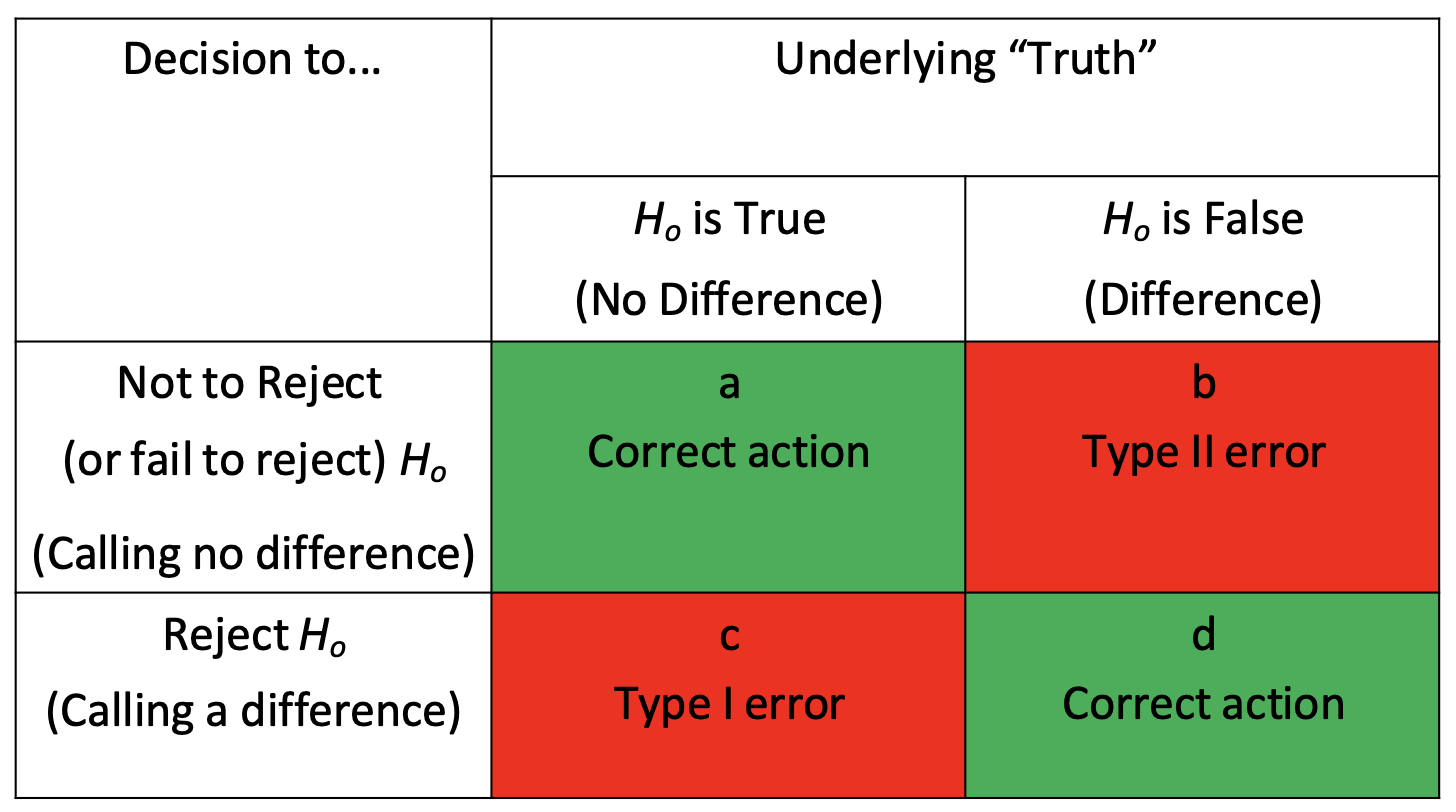
null and alternative hypothesis
null (H0):
no statistically significant difference
drug efficacy = placebo efficacy
researchers try to disprove/reject null hypothesis
alternative hypothesis (Ha):
statistically significant difference
drug efficacy ≠ placebo efficacy
researchers try to prove
type I vs type II error
type I (alpha) error → false positive; saying drug works when it doesn’t
type II (beta) error → false negative; missing a real effect
hypothesis testing
tells about possibility of a chance influencing the results
does not test for or tell anything about the possibility of a bias
methods → compare p-values or evaluate confidence intervals
alpha level and p-value
alpha level → level chosen before the study as maximum permissible error in study
usually 0.05
threshold used for rejecting null hypothesis
p-value → probability that results occurred by chance if Ha is true
p < 0.05 → null hypothesis is rejected; there is statistically significant difference between groups
p ≥ 0.05 → study has failed to reject null; no statistically significant difference
confidence intervals
range where true value likely lies
gives idea of accuracy of point estimates
assess statistical significance, using null value as reference
CI = 1 - alpha; if alpha = 0.05 → 95% CI
narrow CI = high precision; wide CI = low precision
bigger sample → narrower CI
difference in means for 95% CI = difference ± 1.96 × standard error
standard error = SD / √n
process of determining whether something is statistically significant
state a null hypothesis, H0
choose an alpha level
review p-value from statistical model (analysis report) and compare with alpha
review confidence level from statistical model → 1 for ratios, 0 for difference
determine statistical significance → p-value and CI should give same conclusion
difference vs ratio measures
difference measure → how much higher/lower?; null = 0
calculates absolute change by subtracting → group A - group B
measures mean difference, risk difference, difference in proportion
null = 0 → difference of 0 = no difference between groups
ex: treatment group mean BP = 130; control group mean BP = 135
difference = 130 - 135 = -5
95% CI = (-10, +2)
includes 0 in CI → not statistically significant
ratio measures → how many times higher/lower?; null = 1
compares group using division → group A / group B
measures relative risk, odds ratio, hazard ratio
null = 1 → same risk in both groups
ex: treatment group risk = 10%; control group risk = 20%
relative risk = 0.10 / 0.20 = 0.5
95% CI = (0.3, 0.9)
does not include 1 → statistically significant
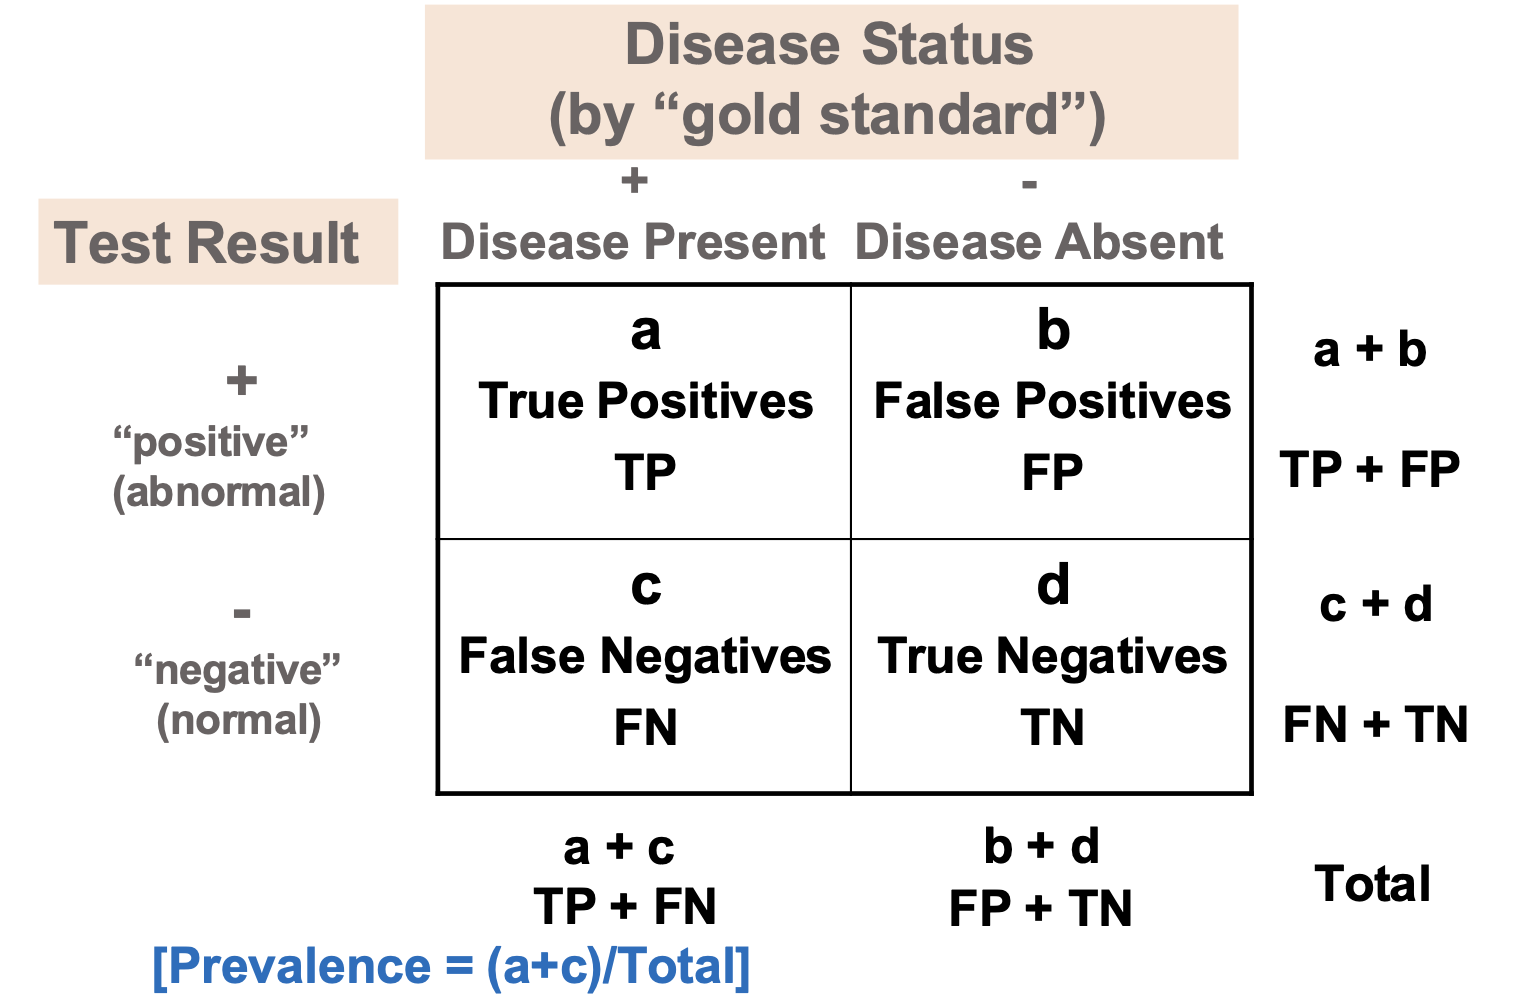
test performance measures
sensitivity → TP / (TP + FN)
among persons with disease, percent who have positive tes
specificity → TN / (FP + TN)
among persons without disease, percent who have negative test
positive predictive value (PPV) → TP / (TP + FP)
among persons with positive test, percent who have disease
negative predictive value (NPV) → TN / (FN + TN)
among persons with negative test, percent who do not have disease
likelihood ratios (LR)
measures diagnostic accuracy in evaluating particular disease or condition
when a patient tests positive:
LR+ = sensitivity / 1-specificity = true positive rate / false positive rate
LR+ → rule in disease (>1)
when a patient tests negative:
LR- = 1-sensitivity / specificity = false negative rate / true negative rate
LR- → rule out disease (<1)
statistical and clinical significance
statistical significance does not mean that results are clinically important
statistical significance → is result real or chance?
clinical significance → does it matter to patients?
factors → sample size, duration, cost, ease of implementation
bias
interference tending to produce results that depart systematically from true values
selection bias → groups differ at baseline
measurement bias → inaccurate measurement
confounding bias → third variable distorts effect
internal vs external validities
internal validity → results are correct for sample
external validity → results holds true in other settings
precision vs accuracy
precision (reliability) → reproducibility
accuracy (validity) → closeness to truth
sample size considerations
larger sample → higher power → less chance error
significance → alpha value = 0.05
power → ≥ 80%
effect size → meaningful definition of “different”
correlation
measures linear relationship only
r = -1 or 1 only
increasing correlation when r is closer to 1
correlation ≠ causation
discrete vs continuous data
discrete → can only assume limited number of values within given range
nominal = categories (yes/no)
ordinal = ranked (class I-IV)
continuous → can take on any value within given range
interval = no true zero (ºF)
ratio → true zero (BP, HR)
probability rules
P(developing disease) = probability of developing disease
P(A) + P(not A) = 1 or 100%
additive rule → mutually exclusive
multiplicative rule → independent events
independence = P(A occurring) not related to P(B occurring)
conditional probability → P(A|B) = P(A occurring) given P(B occurring)
descriptive vs inferential statistics
descriptive → summarizes and describes data collected
may be done visually and numerically
inferential → using population samples to make generalizations and infer/draw conclusions
methodology depends on data type and study design
statistical inference can be made by estimation or hypothesis testing
common stastical tests
t-test → checks difference between means of two groups (continuous)
ANOVA → checks difference between means of three or more groups (continuous)
chi-square → checks difference between three or more proportions or percentages (categorical)
Fisher’s exact test → checks difference between two proportions or percentages (categorical)