Average revenue, total revenue and profit
0.0(0)
0.0(0)
Card Sorting
1/4
There's no tags or description
Looks like no tags are added yet.
Study Analytics
Name | Mastery | Learn | Test | Matching | Spaced |
|---|
No study sessions yet.
5 Terms
1
New cards
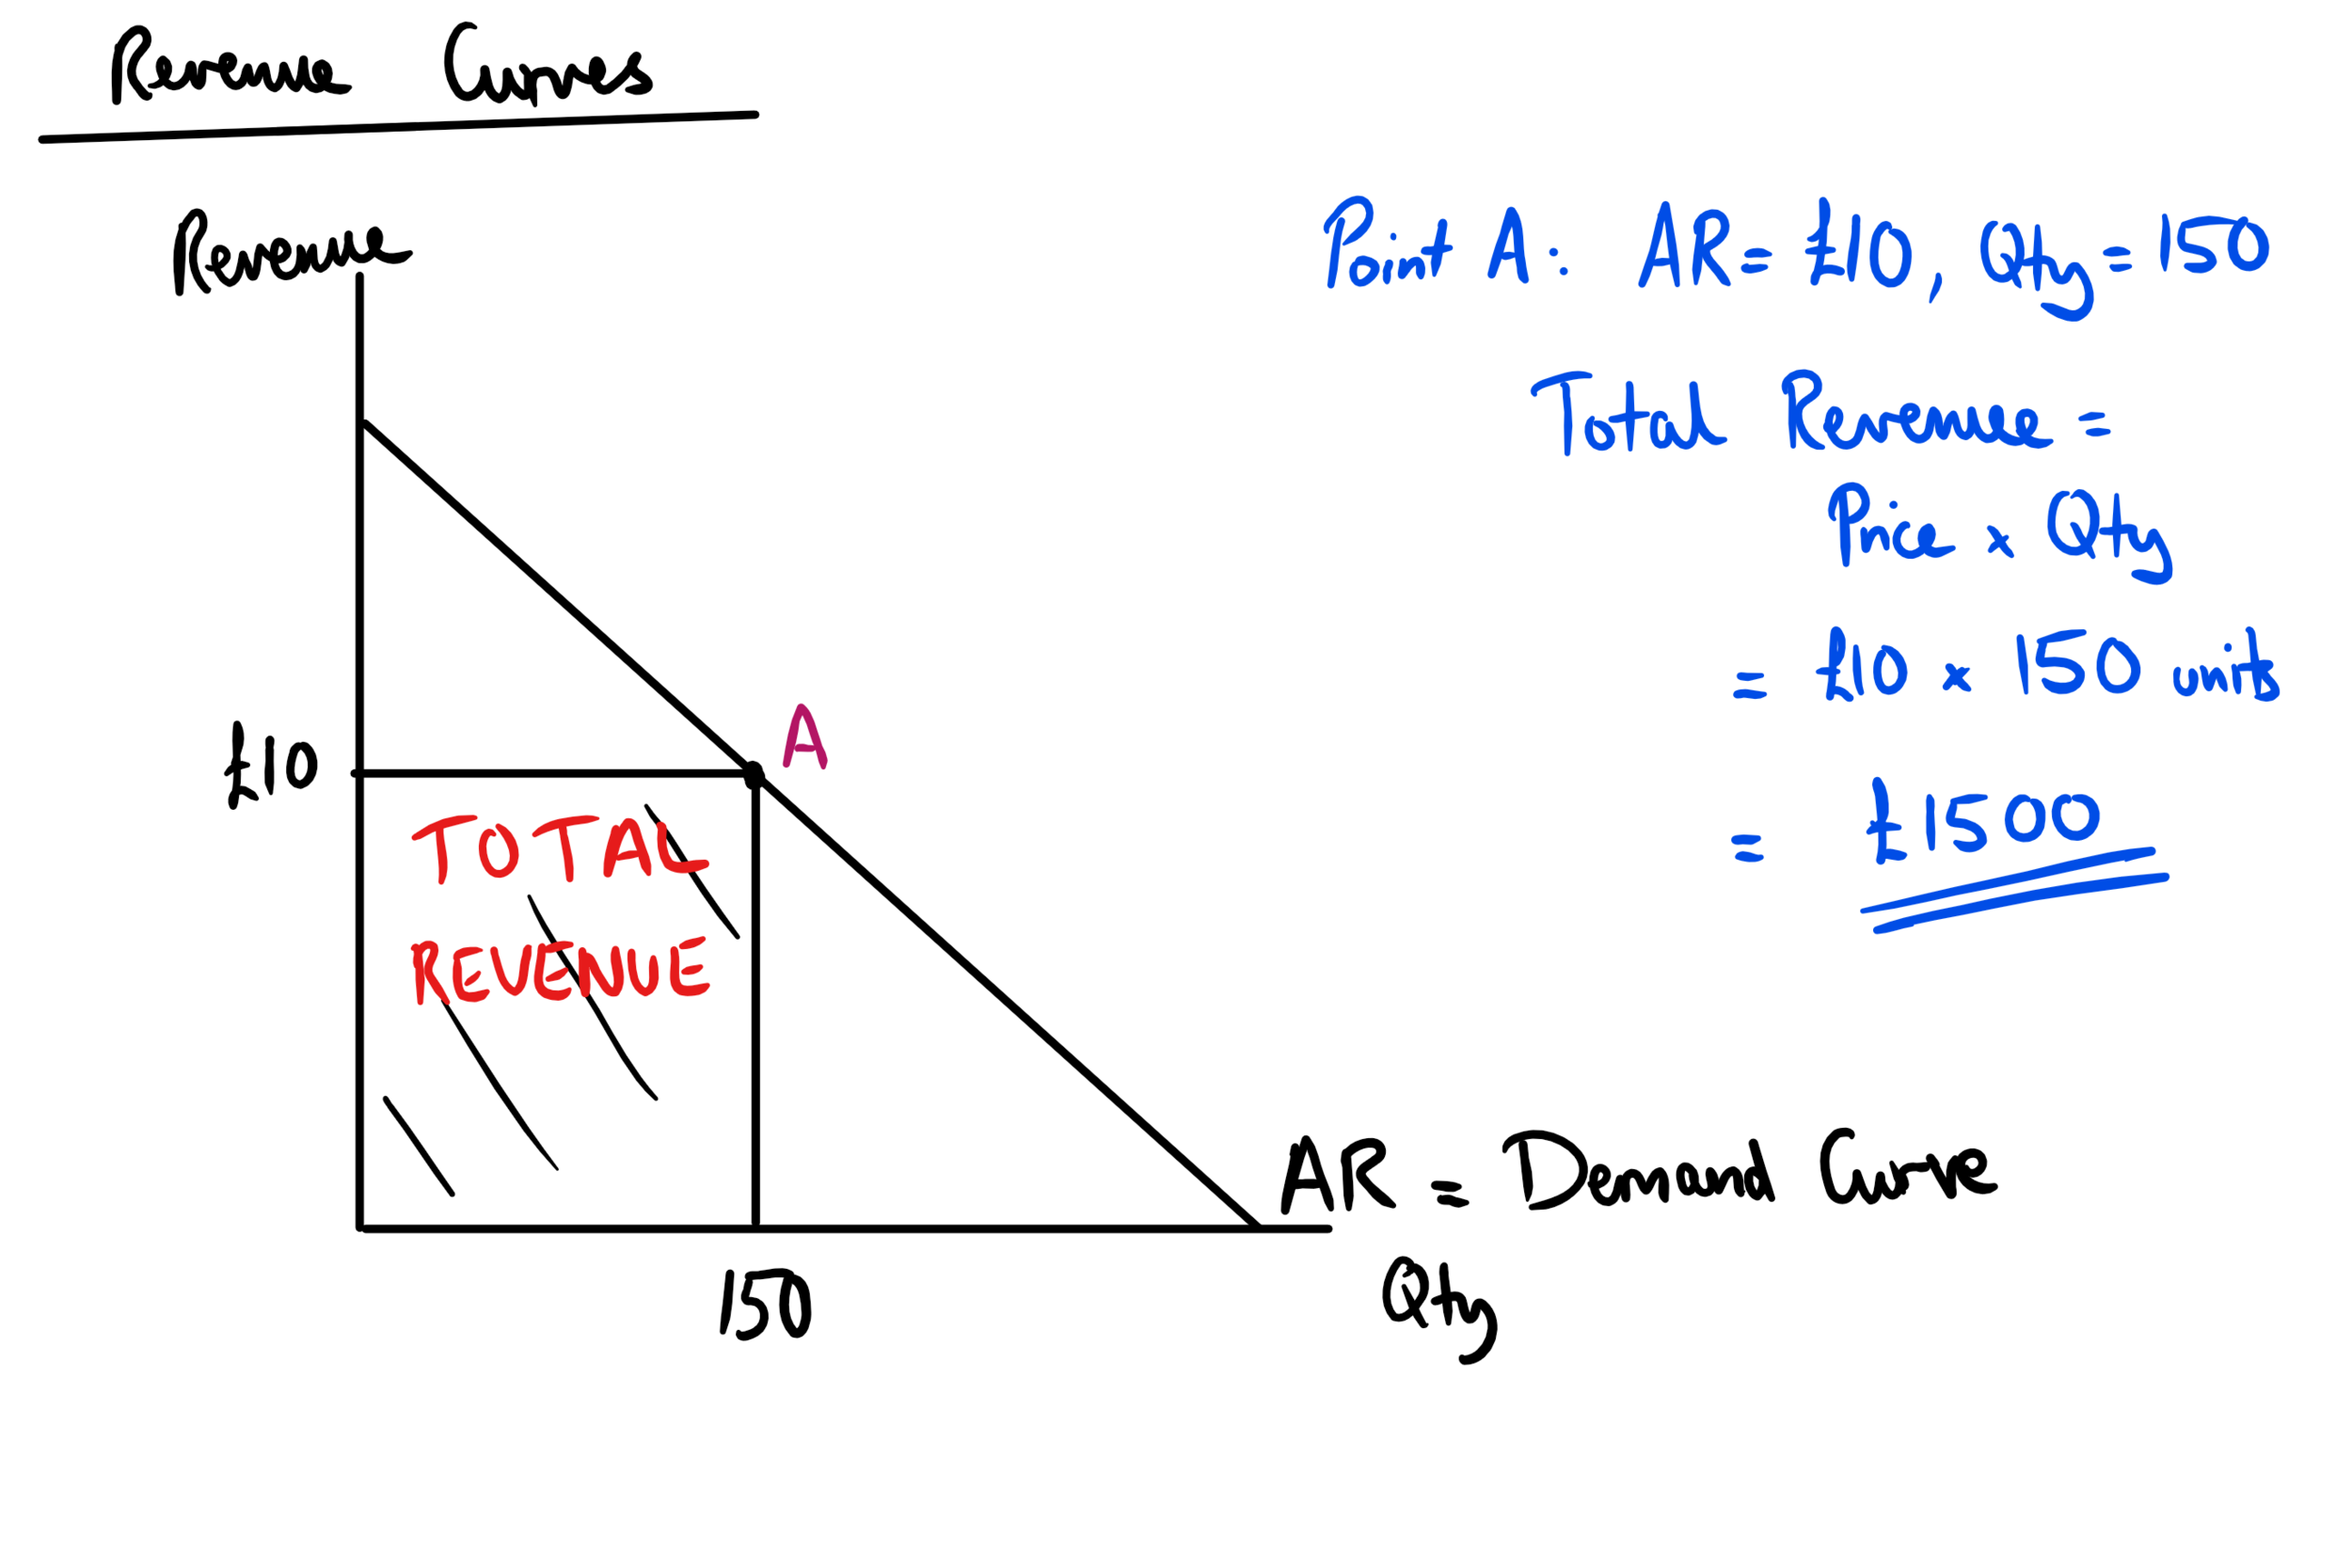
Total revenue equation
Price x quantity
2
New cards
Average revenue equation
(revenue per unit)
TR/ Q
Equal to price
3
New cards
Profit equation
(Total revenue) - (Total costs)#
Negative = a loss
4
New cards
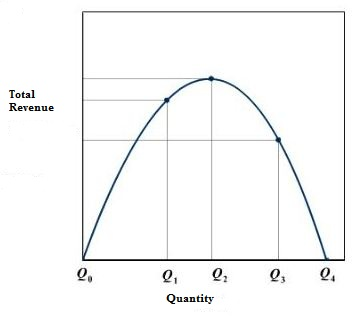
Total revenue graph
First half = elastic, as price decreases, revenue increases
Second half - inelastic, as price decreases, revenue decreases
Maximum point - max revenue, unitary elastic
5
New cards
Average revenue graph
AR = Demand
Price from 0 to £10 = inelastic
Price £10+ = elastic
Midpoint = unit elastic
Area of P1, Q1 = total revenue