STA 147 - Ch 3.4: Measures of Position and Outliers, Z-Score
1/23
There's no tags or description
Looks like no tags are added yet.
Name | Mastery | Learn | Test | Matching | Spaced | Call with Kai |
|---|
No analytics yet
Send a link to your students to track their progress
24 Terms
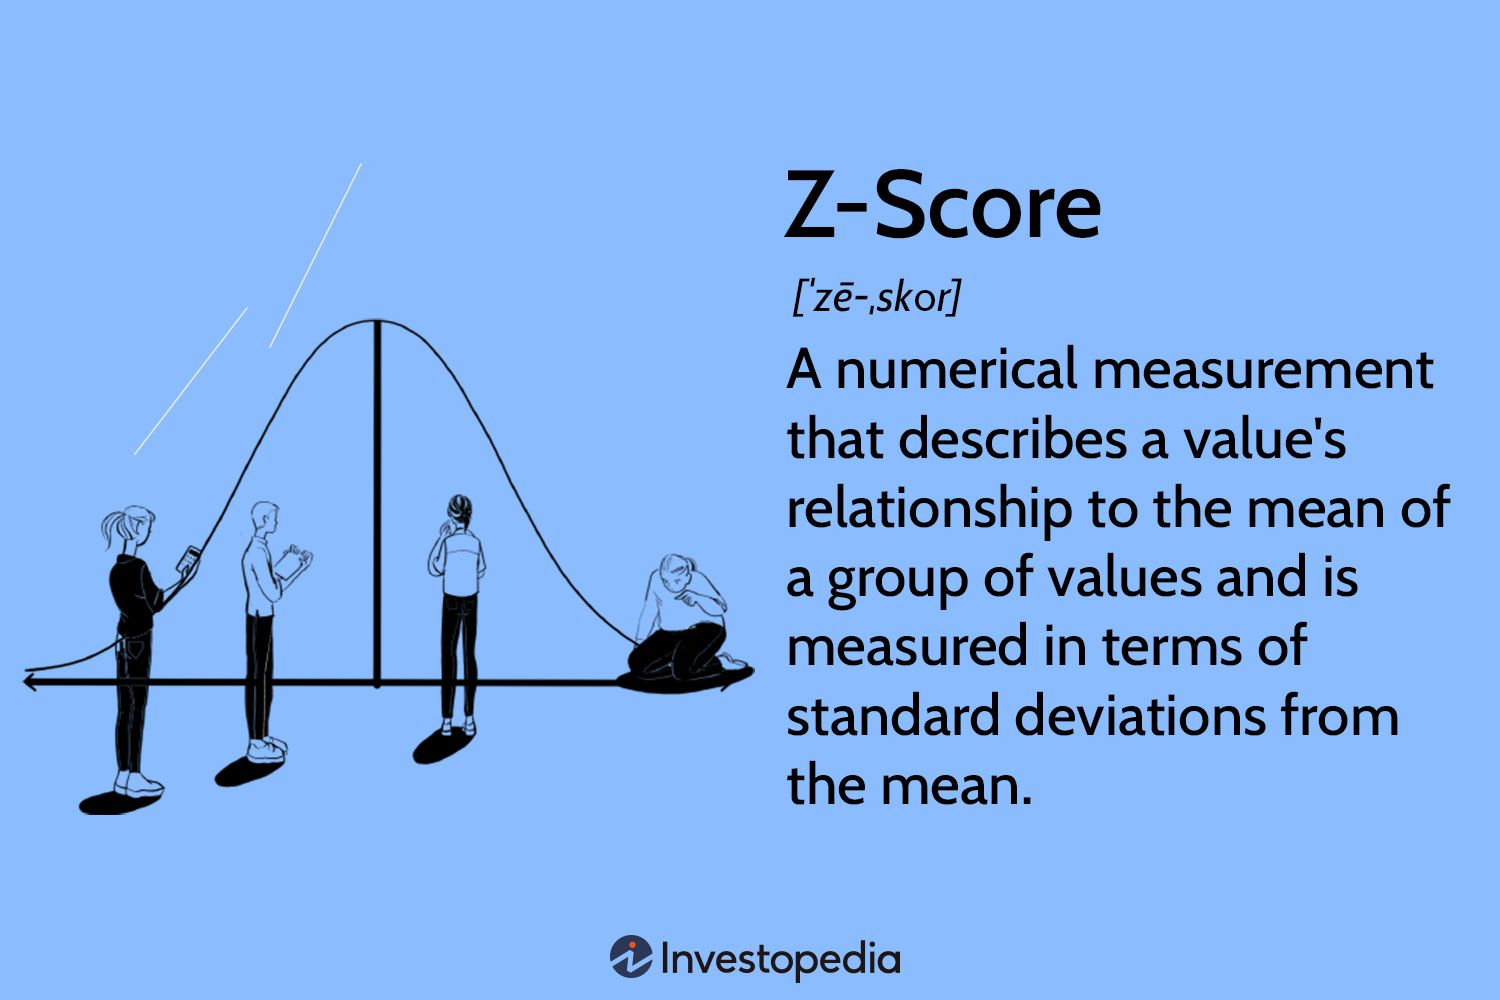
z-score
Z-score refers to the distance a data value is from a mean in terms of standard deviation. ***See the picture***
EX: A z-score of 1 represents that a data set is 1 standard deviation away from the mean)
There are two types of z-scores
Population z-score and Sample z-score
how do you find the Z-score
by subtracting the mean from the data value and dividing this result by the standard deviation.
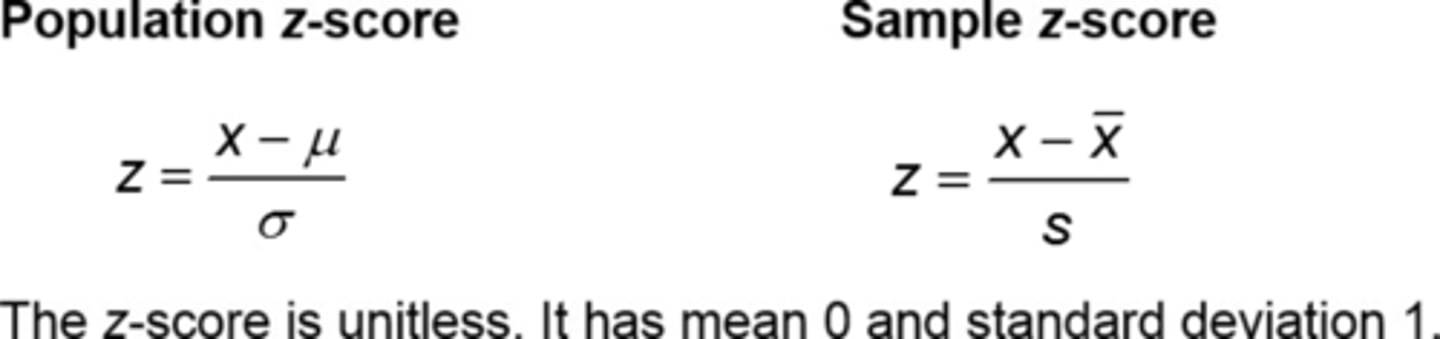
The z-score is unitless. It has a mean of 0 and standard deviation of 1. Explain what this means:
The z-score being unitless means it is a standardized measure that doesn't depend on the original units of the data (e.g., centimeters, seconds, etc.). Instead, it expresses how far a particular data point is from the mean of a dataset in terms of standard deviations.
---------------------------------
When we say the z-score has a mean of 0 and a standard deviation of 1, it means:
A z-score of 0 indicates that the data point is exactly at the mean.
A positive z-score indicates that the data point is above the mean, and the higher the z-score, the further above the mean it is.
A negative z-score indicates that the data point is below the mean, with negative values representing points further below the mean.
The standard deviation of 1 means that each unit increase or decrease in the z-score represents one standard deviation away from the mean.
--------------------------------
So, the z-score tells you how many standard deviations a value is from the mean, without being tied to any particular unit of measurement, making it a flexible way to compare values from different distributions or datasets.
EXAMPLE Using Z-Scores
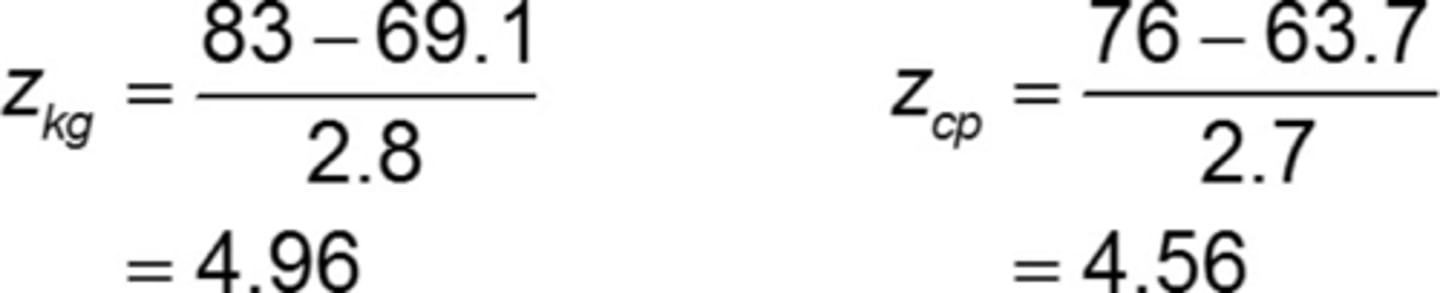
The mean height of males 20 years or older is 69.1 inches with a standard deviation of 2.8 inches. The mean height of females 20 years or older is 63.7 inches with a standard deviation of 2.7 inches. Data is based on information obtained from National Health and Examination Survey. Who is relatively taller?
a) Kevin Garnett whose height is 83 inches or Candace Parker whose height is 76 inches?
a) plug the variables into the equation (x being their heights, x-bar and mew being the mean height of males/females 20 and older, and the SD as stated in the problem)
Kevin Garnett's height is 4.96 standard deviations above the mean. Candace Parker's height is 4.56 standard deviations above the mean. Kevin Garnett is relatively taller.
Percentiles
The kth percentile, denoted, is a value that represents the point in a set of data where k percent of the values are less than or equal to that number. It shows how a specific value compares to the rest of the data.
---------------
For example, if you're looking at the 70th percentile, 70% of the data is smaller than or equal to that value.
EXAMPLE Interpret a Percentile
The Graduate Record Examination (GRE) is a test required for admission to many U.S. graduate schools. The University of Pittsburgh Graduate School of Public Health requires a GRE score no less than the 70th percentile for admission into their Human Genetics MPH or MS program.
Interpret this admissions requirement.
In general, the 70th percentile is the score such that 70% of the individuals who took the exam scored worse, and 30% of the individuals scores better. In order to be admitted to this program, an applicant must score as high or higher than 70% of the people who take the GRE. or you could say, the applicant's score must be in the top 30%.
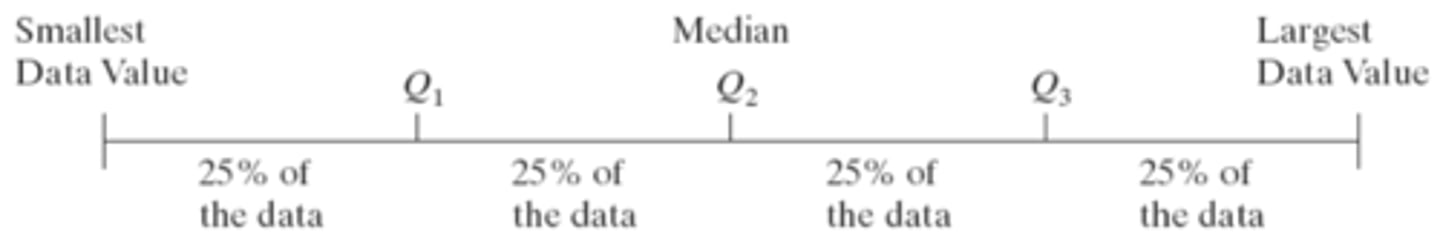
Quartiles
Quartiles divide data sets into quarters, or, four equal parts, or quartiles
first quartile
second quartile
third quartile
What is the 1st Quartile?
(denoted Q1) divides the bottom 25% the data from the top 75%. Therefore, the 1st quartile is equivalent to the 25th percentile.
What is the 2nd Quartile?
(denoted Q2) divides the bottom 50% of the data from the top 50% of the data, so that the 2nd quartile is equivalent to the 50th percentile, which is equivalent to the median.
What is the 3rd Quartile?
(Denoted Q3) divides the bottom 75% of the data from the top 25% of the data, so that the 3rd quartile is equivalent to the 75th percentile.
How do you find Quartiles
Step 1: Arrange the data in ascending order.
Step 2: Determine the median, M, or second quartile, Q2 .
Step 3: Divide the data set into halves: the observations below (to the left of) M and the observations above M. The first quartile, Q1, is the median of the bottom half, and the third quartile, Q3, is the median of the top half.
EXAMPLE Finding and Interpreting Quartiles
A group of Brigham Young University—Idaho students (Matthew Herring, Nathan Spencer, Mark Walker, and Mark Steiner) collected data on the speed of vehicles traveling through a construction zone on a state highway, where the posted speed was 25 mph. The recorded speed of 14 randomly selected vehicles is given below:
20, 24, 27, 28, 29, 30, 32, 33, 34, 36, 38, 39, 40, 40
a) Find the quartiles for speed in the construction zone. Explain labeling each step with it.
b) Interpret the Quartiles
a)
Step 1: The data is already in ascending order.
Step 2: There are n = 14 observations, so the median, or second quartile, Q2, is the mean of the 7th and 8th observations. Therefore, M = 32.5.
Step 3: The median of the bottom half of the data is the first quartile, Q1.
20, 24, 27, 28, 29, 30, 32
The median of these seven observations is 28. Therefore, Q1 = 28. The median of the top half of the data is the third quartile, Q3. Therefore, Q3 = 38.
b) Interpret the Quartiles
Interpretation:
25% of the speeds are less than or equal to the first quartile, 28 miles per hour, and 75% of the speeds are greater than 28 miles per hour.
50% of the speeds are less than or equal to the second quartile, 32.5 miles per hour, and 50% of the speeds are greater than 32.5 miles per hour.
75% of the speeds are less than or equal to the third quartile, 38 miles per hour, and 25% of the speeds are greater than 38 miles per hour.
Can Quartiles be found in Minitab?
Yes, in "Descriptive Statistics"
IQR (interquartile range)
is the range of the middle 50% of the observations in a data set. That is, the IQR is the difference between the third and first quartiles (insert IQR formula here :3 )
How do you find IQR
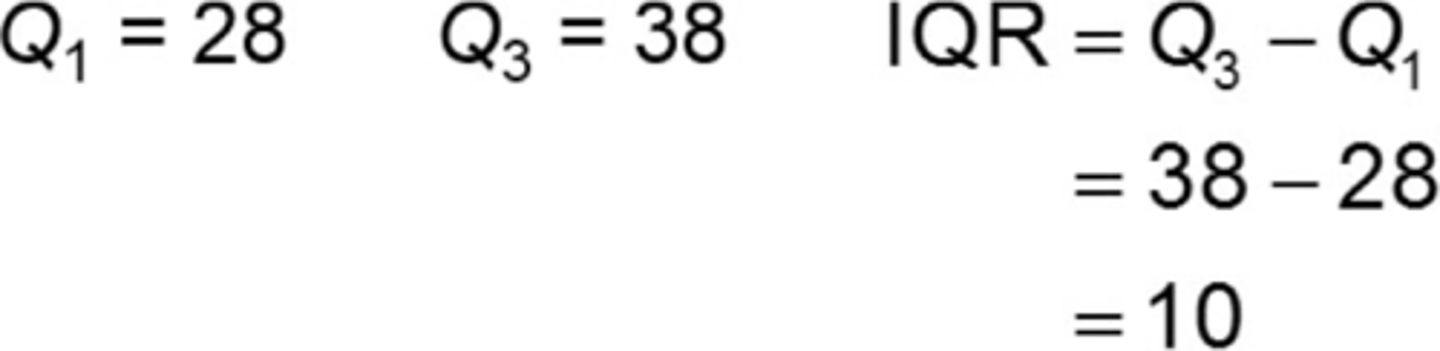
IQR = Q3 − Q1
EXAMPLE Determining and Interpreting the Interquartile Range
a) Determine and interpret the interquartile range of the speed data shown on the next side:
b) Now, suppose a 15th car travels through the construction zone at 100 miles per hour. How does this value impact the mean, median, standard deviation, and interquartile range?
a) The range of the middle 50% of the speed of cars traveling through the construction zone is 10 miles per hour
b) Now, suppose a 15th car travels through the construction zone at 100 miles per hour. How does this value impact the mean, median, standard deviation, and interquartile range?
The picture displays the new found Mean, Median, SD, and IQR
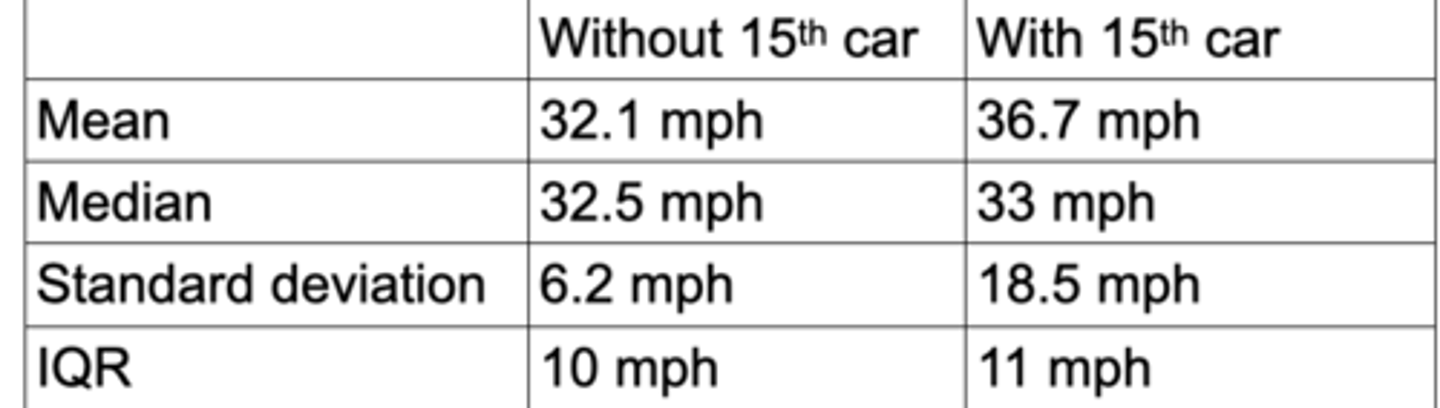
UNDERSTANDING THIS CHART IS KEY TO MIDTERM 1 SUCCESS!!!
What are Outliers in data? When are they most commonly seen
Outliers in data are values that are significantly different from the rest of the data points. They either appear much higher or much lower compared to the majority of the data.
Outliers can be seen in several situations, such as:
Measurement errors: Mistakes during data collection can produce outliers.
Natural variation: In some cases, outliers occur naturally in processes or populations, like very high incomes in economic data.
Experimental conditions: Sudden changes in the environment or conditions can create unusual data points.
Skewed distributions: In certain data sets where the distribution isn’t symmetrical, outliers may appear more frequently.
Outliers are important because they can distort results, so identifying them helps in understanding whether they represent unusual cases or errors.
Outliers are values that are less than ____________ or values that are greater than ____________
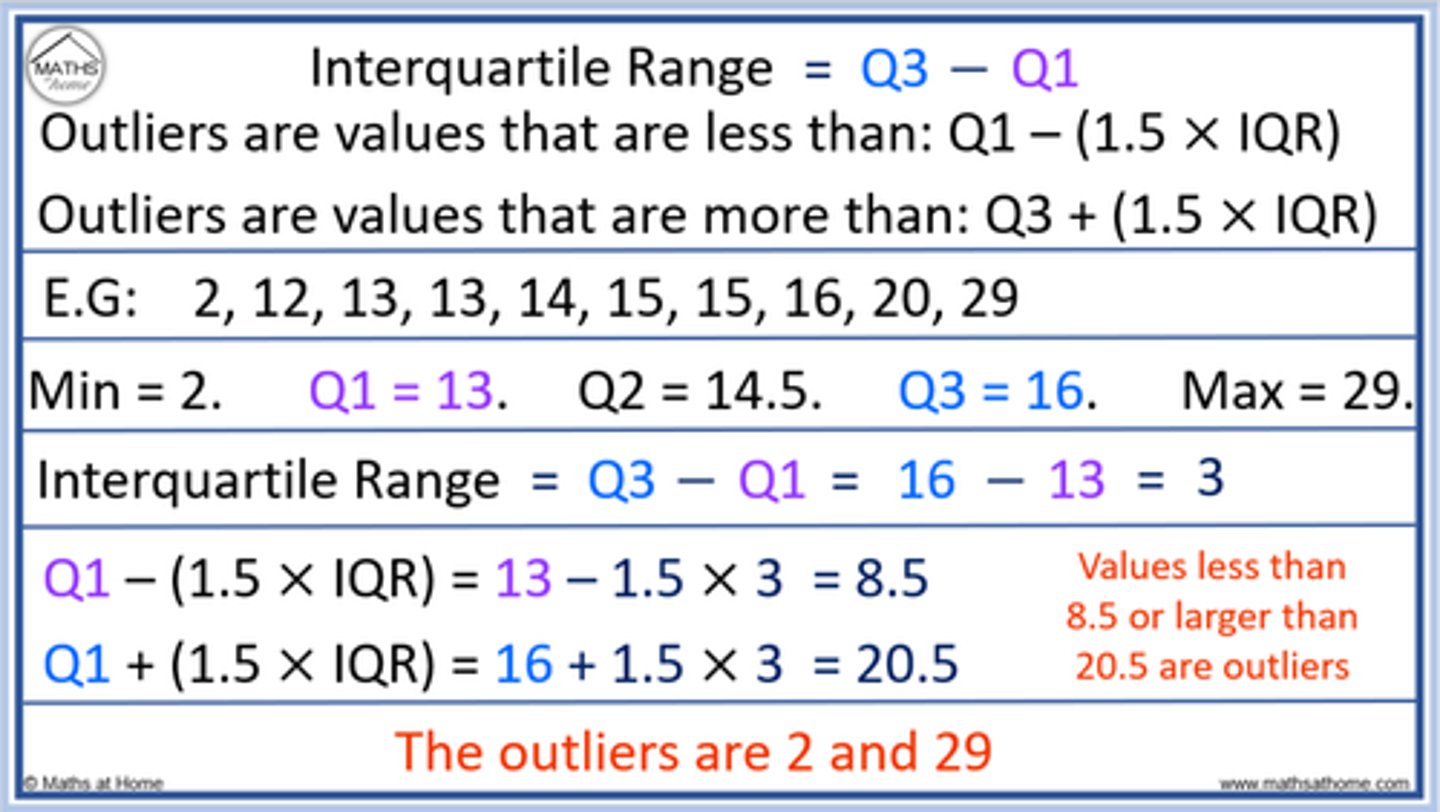
Outliers are values that are less than Q1 - (1.5 • IQR) or values that are greater than Q3 + (1.5 • IQR)
How do you check for Outliers using Quartiles?
Checking for Outliers by Using Quartiles:
Step 1 Determine the first and third quartiles of the data.
Step 2 Compute the interquartile range.
Step 3 Determine the fences. Fences serve as cutoff points for determining outliers.
Lower Fence = Q1 − 1.5(IQR)
Upper Fence = Q3 + 1.5(IQR)
Step 4 If a data value is less than the lower fence or greater than the upper fence, it is considered an outlier.
EXAMPLE Determining and Interpreting the Interquartile Range
a) Check the speed data for outliers.
20, 24, 27, 28, 29, 30, 32, 33, 34, 36, 38, 39, 40, 40
a)
Step 1: The first and third quartiles are Q1 = 28 mph and Q3 = 38 mph.
Step 2: The interquartile range is 10 mph.
Step 3: The fences are
Lower Fence = Q1 − 1.5(IQR) = 28 − 1.5(10) = 13 mph
Upper Fence = Q3 + 1.5(IQR) = 38 + 1.5(10) = 53 mph
Step 4: There are no values less than 13 mph or greater than 53 mph. Therefore, there are no outliers.