Scatterplots, Association, and Correlation
1/10
There's no tags or description
Looks like no tags are added yet.
Name | Mastery | Learn | Test | Matching | Spaced | Call with Kai |
|---|
No analytics yet
Send a link to your students to track their progress
11 Terms
Scatterplot investigation (FUDS)
Form (linear or nonlinear)
Unusual Features (outliers)
Direction (positive or negative)
Strength (strong, moderate, weak)
The sign of correlation coefficient tells us..
The direction of the association
The magnitude of the correlation tells us..
the strength of a linear association (strong = near -1.0 or near +1.0, while weak= near 0)
Correlation has..
NO UNITS (shifting or scaling the data, standardizing or even swapping the variables has no effect on the numerical value)
Scatterplots
shows the relationship between two quantitative variables measured on the same cases
Outlier
A point that does not fit the overall pattern seen in the scatterplot
Response Variable
the variable that you hope to predict or explain, assigned to the y-axis
Explanatory/Predictor variable
the variable that accounts for, explains, predicts, or is otherwise associated with the y-variable; assigned to the x-axis
Correlation Coefficient
a numerical value of the direction and strength of a linear relationship
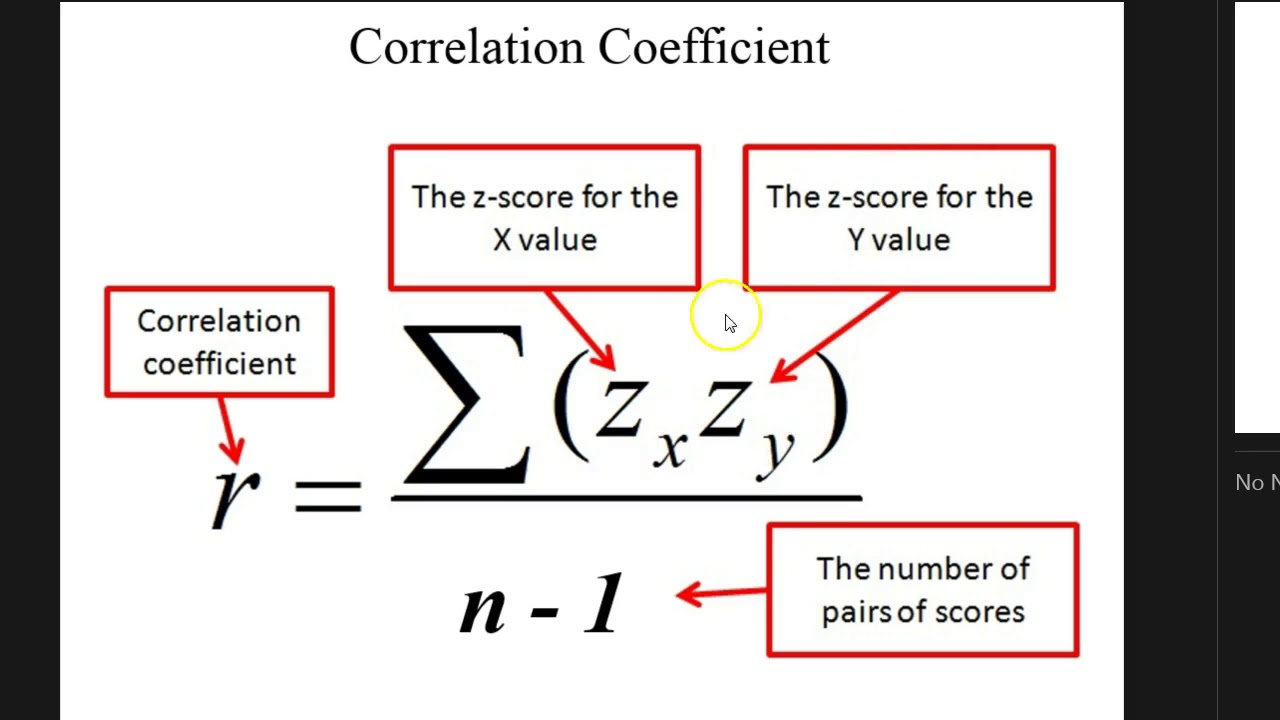
Correlation Coefficient formula
Correlation Coefficient= the sum of the product of corresponding z-score of x and z-score of y divided by n-1)
Lurking variable
A variable other than x and y that simultaneously affects both variables, accounting for the association between the two