Microeconomics Final Exam Study Guide
1/102
There's no tags or description
Looks like no tags are added yet.
Name | Mastery | Learn | Test | Matching | Spaced |
|---|
No study sessions yet.
103 Terms
Economics
The study of making decisions
Scarcity
In the economy, consumers have unlimited wants and needs, but there are limited resources
Microeconomics
Branch of economics that focuses on individual behavior, such as firms, consumers, and markets
Macroeconomics
Branch of economics that focuses on the entire economy as a whole, including the global and domestic economies
Incentives
rewards or punishments that motivate individuals to act a certain way (can be direct or indirect, positive or negative)
Positive Incentives
encourage a desired behavior
Negative Incentives
discourage an undesired behavior
Direct Incentives
explicit incentives clearly linked to a specific action
Indirect Incentives & Unintended Consequences
unintended effects that influence behavior
Trade-offs
everything is limited in economics, so each decision made means giving up something else
Opportunity Cost
the cost of making a decision (what is given up)
Marginal Thinking
evaluating each additional benefit or cost of something
Trade
buying and selling goods and services for greater benefit (uses specialization)
Steps in the Scientific Method
1) observe
2) develop a hypothesis
3) create a model to test the hypothesis
4) analyze the results & draw conclusions
5) apply the findings
Models and Assumptions
a simplified version of reality with certain fixed assumptions to simplify
Circular Flow Diagram
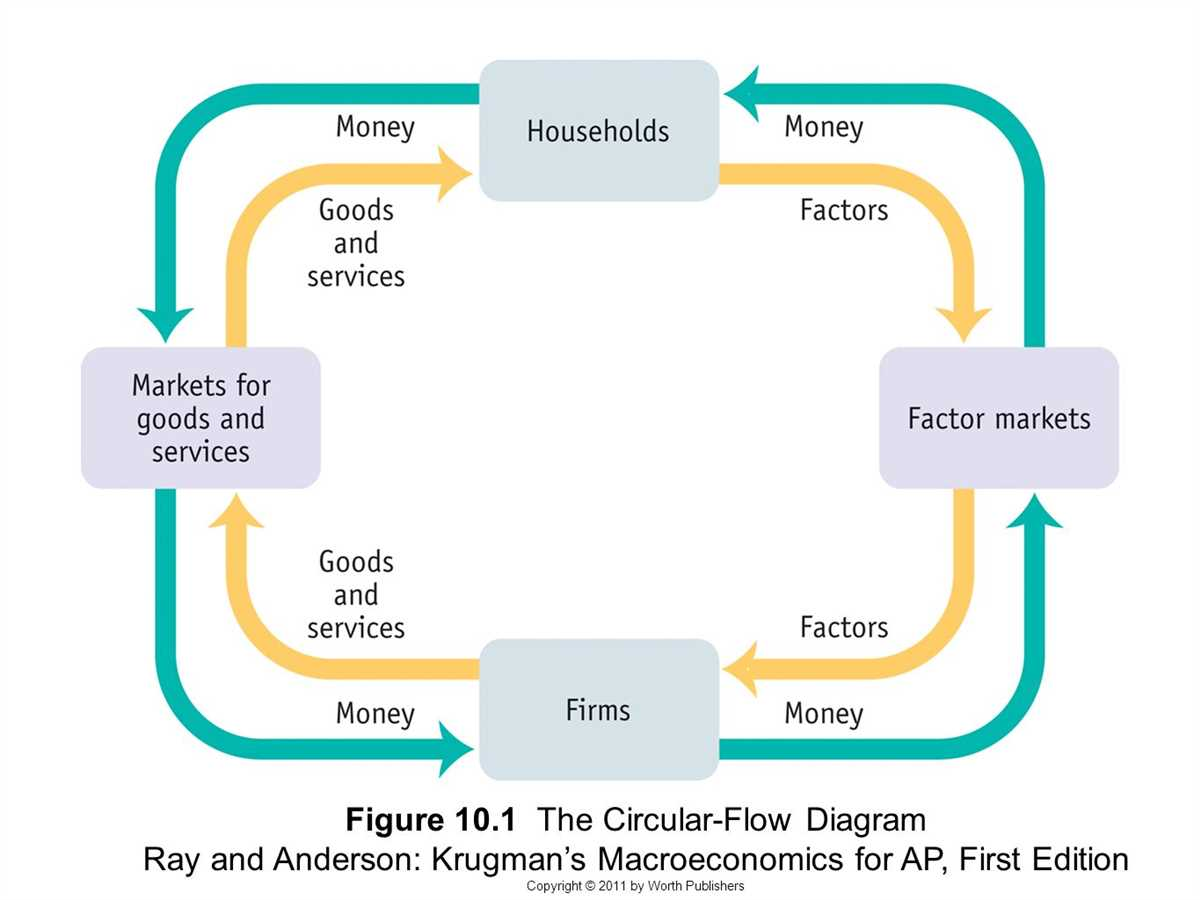
Markets
place where buyers and sellers come together to exchange goods
Resources
the input used in the production of goods and services; limited leading to trade-offs
Labor
human effort used in the production of goods and services
Land
natural resource, raw materials from the Earth
Capital
man-made tools and machinery used in the production of goods and services
Human Capital
skills, knowledge and experience used by individuals toward the production of goods and services
Entreprenourship
the combination of K,L,H,N used strategically
Variables vs Constants
while variables change due to outputs, constants remain the same
Production Possibility Frontier (PPF)
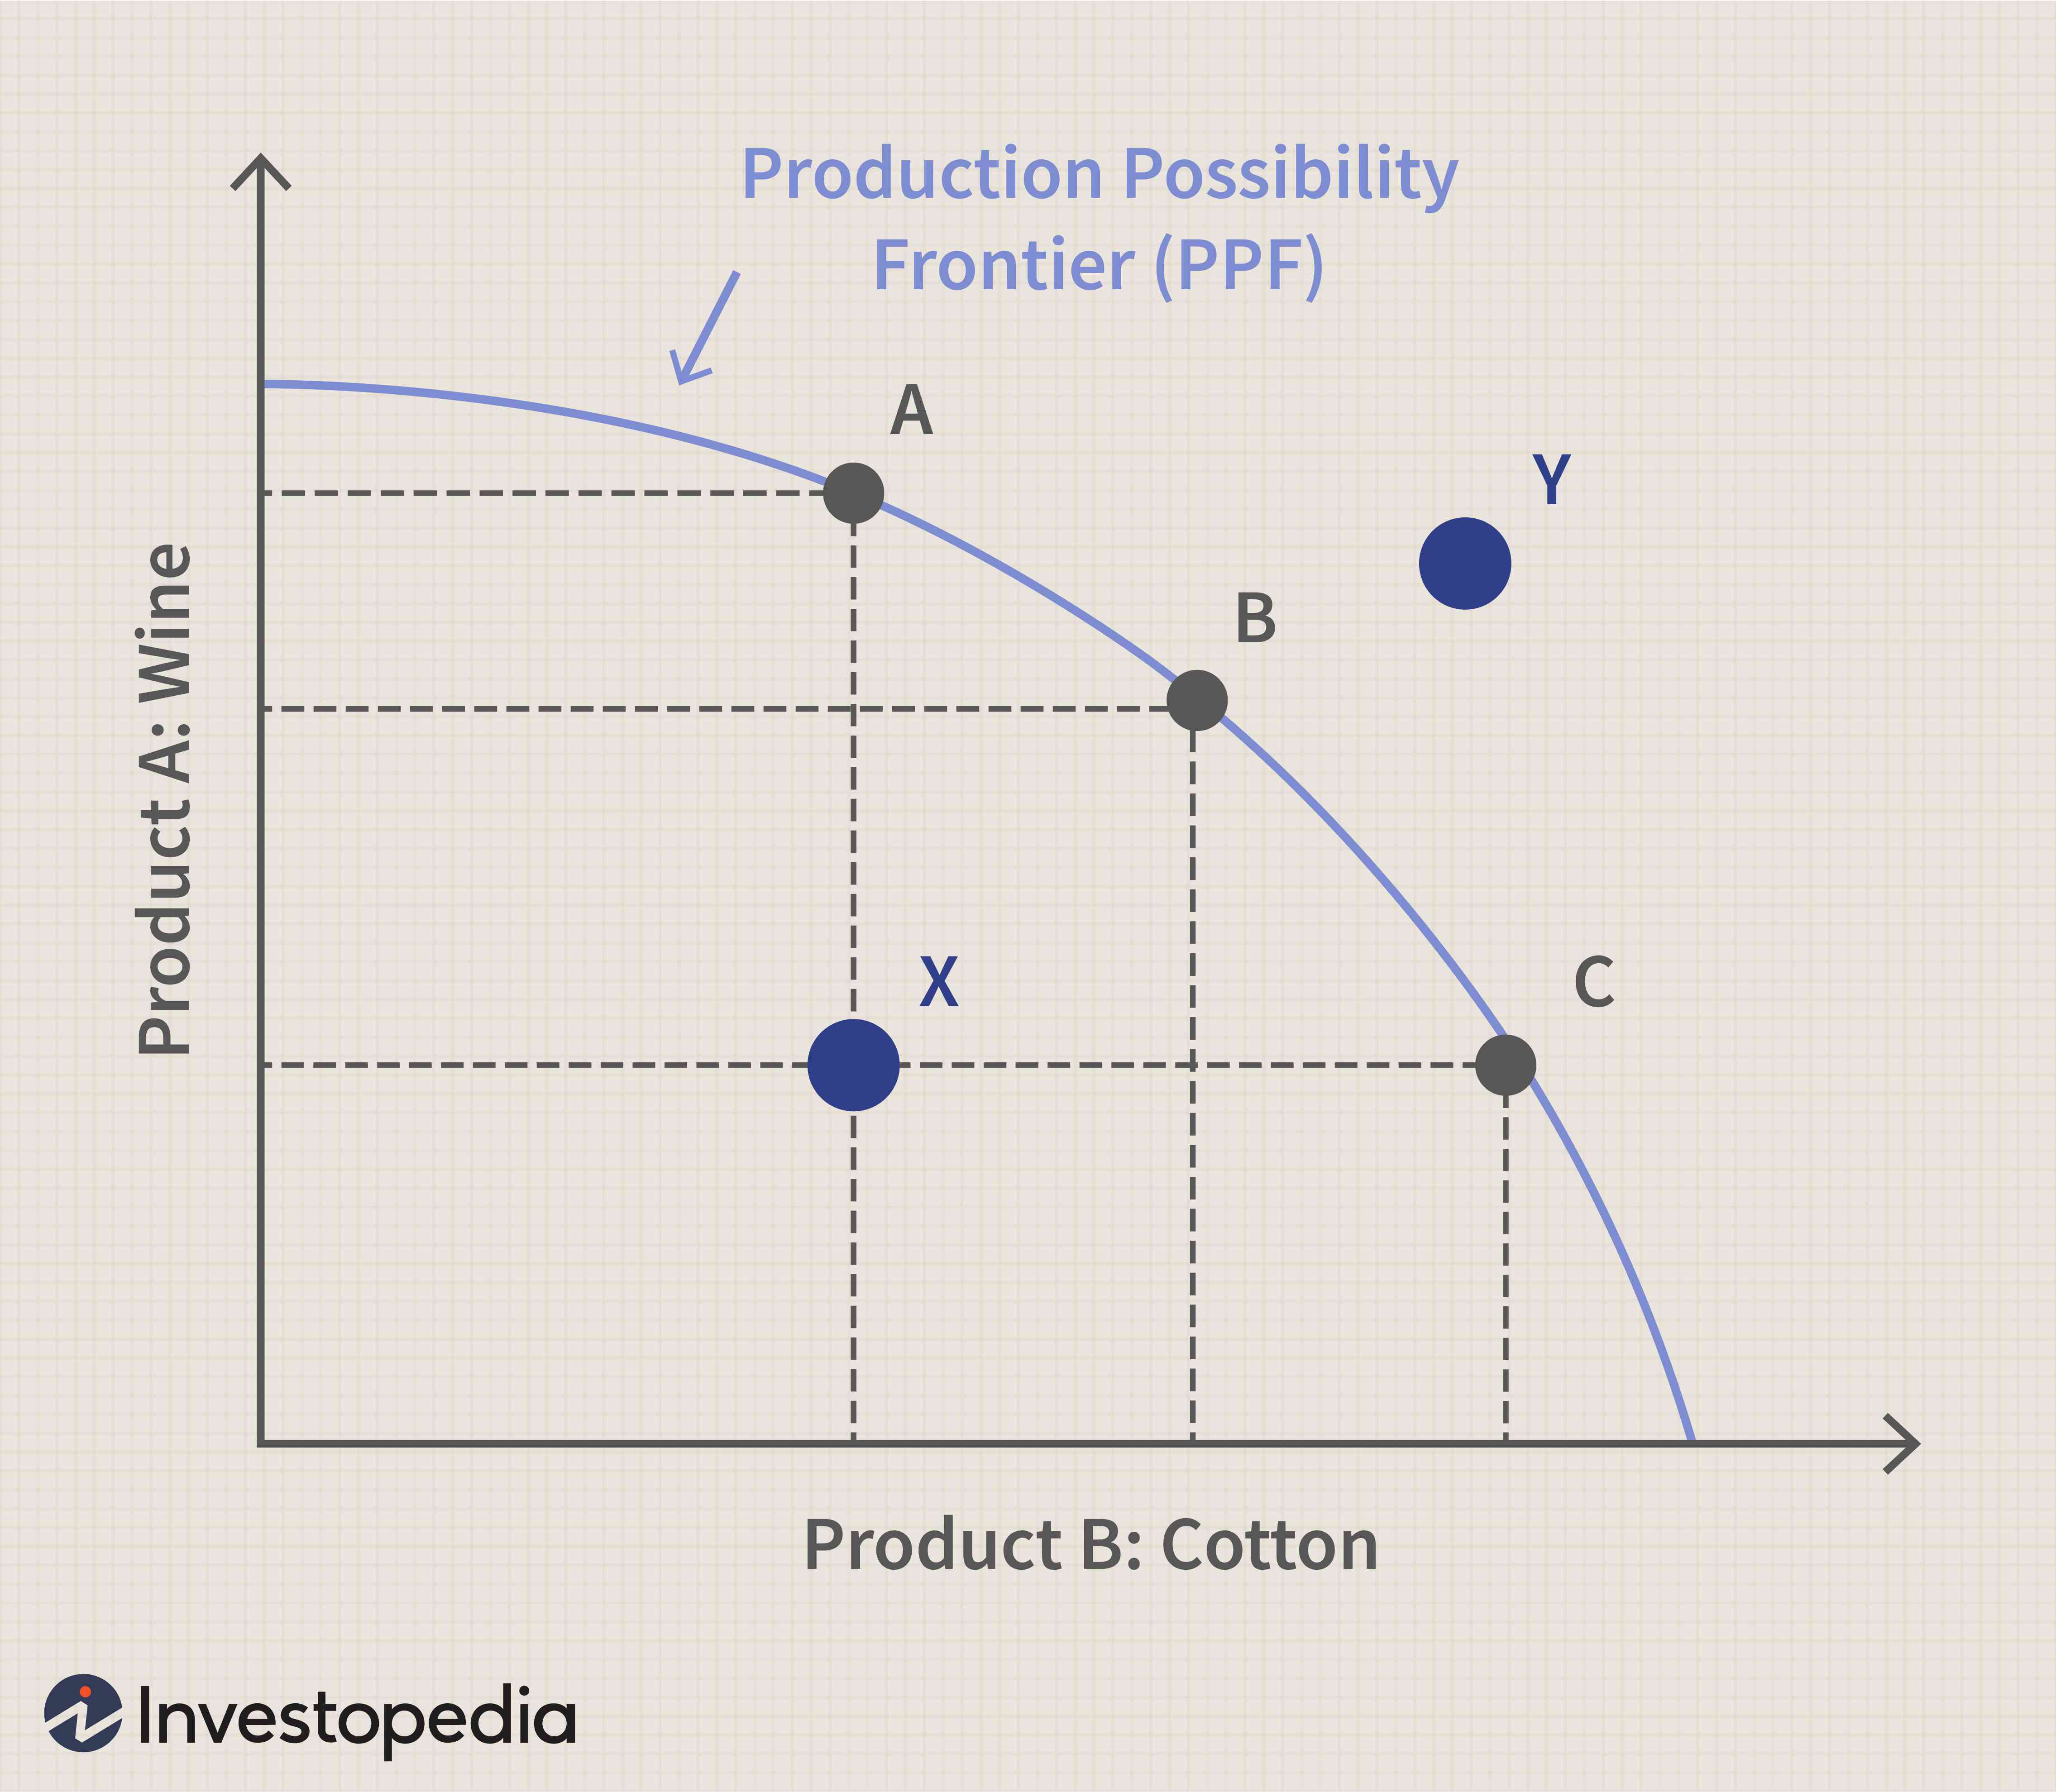
Absolute Advantage
whoever is better at producing something than another person has this
Comparative Advantage
whoever produces something at a lower opportunity cost has this
Specialization
when individuals/firms focus only on what they produce at the lowest opportunity cost
Exports vs Imports
trades given vs trades received
Gains from Trade
the economic benefits that comes when firms specialize and trade with each other
Lower and upper bounds for pricing goods in exchange
between the two individuals’/firms’ comparative advantages
Consumer vs Capital Good Trade-off
consumer - consumption
capital - used in production
trade-off - negative correlation (more capital = less consumer)
Investment
spending on capital goods to increase future production
Two Roles for Economists
scientists: explain how the economy works (positive)
advisors: recommend how it should work (normative)
Positive vs Normative statements
positive: factual, testable statements
normative: opinion-based, value judgements
Adam Smith
wrote Wealth of Nations
introduced the invisible hand
Invisible Hand
means that the economy is ruled by something other than the government and works for the best interest of everyone when everyone works for the best interest of themselves
Market Economy
decisions are decentralized, made by the buyers and sellers
Competitive Markets
many buyers and sellers; no one controls the price
Monopolies
one seller dominates the market
Quantity Demanded
amount consumers are willing to buy at a specific price
Quantity Supplied
amount producers are willing to sell at a specific price
Demand
relationship between price and quantity demanded
Supply
relationship between price and quantity supplied
Individual vs Market Demand
individual: one consumer’s demand
market: total demand of all consumers
Movement along the Demand and Supply Curves
caused by a change in price
Demand Shifters (D changes)
income
tastes
expectations
number of buyers
price of related goods
Supply Shifters (S changes)
input prices
technology
expectations
number of sellers
Law of Demand
as price increases, quantity demanded decreases (negative relationship)
Law of Supply
as price increases, quantity supplied increases (positive relationship)
Demand and Supply Schedule
table that shows the quantity demanded and quantity supplied in a market
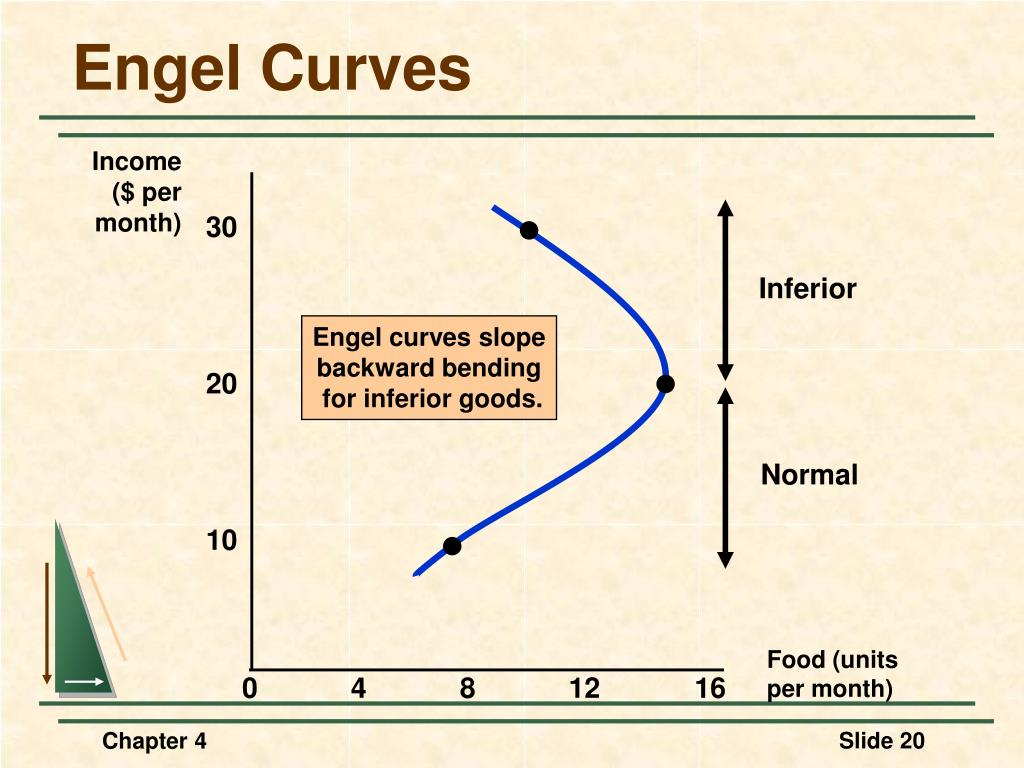
Normal and Inferior Goods
normal: as income increases, demand increases (positive) - ex. sports cars
inferior: as income increases, demand decreases (negative) - ex. bus tickets
Substitutes vs Compliments
substitute: goods used in place of one another
complements: goods used together
Panic Buying vs Speculative Buying
panic: buying driven by fear
speculative: buying based on the expectation that prices will rise
Excise Taxes
per-unit tax
Sales Taxes
tax that’s a percentage of the price
Capital Gain Taxes
tax on profits from selling assets
Subsidies
government payments to encourage production or consumption
Supply and Demand Model
a model showing the relationship between quantity supplied and quantity demanded
Equilibrium
where quantity demanded = quantity supplied
Disequilibrium (Shortage vs Surplus)
surplus: quantity supplied > quantity demanded
shortage: quantity supplied < quantity demanded
Self-guided Economic Adjustments to Equilibrium (Price Mechanism)
price adjusts until the market reaches equilibrium
OPEC
organization of the Petroleum Exporting Countries (a supply cartel)
Ownership Structures of Firms
sole proprietorship: one owner
partnership: 2 owners
corporation: group of owners
Stocks
ownership shares in a company
Engel Curve
shows the relationship between income and quantity demanded of a good
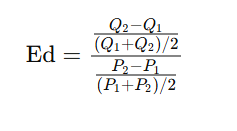
Price Elasticity of Demand
measures how sensitive quantity demanded is to price changes
Elastic Demand
when the quantity demanded fluctuates a lot due to changes in price (ex. luxury goods)
revenue falls when price rises
Inelastic Demand
when the quantity demanded stays relatively the same even with changes in price (ex. necessities)
revenue rises when price rises
Unitary Elastic Demand
revenue stays relatively the same when price rises
Ed = 1
Determinants of Price Elasticity of Demand
Ed = %change quantity demanded / %change in price
elastic: Ed > 1
inelastic: Ed < 1
unitary: Ed = 1
Perfectly Inelastic and Perfectly Elastic Demand
perfectly inelastic: quantity demanded does not change at all if price changes
perfectly elastic: quantity demanded drops to zero when the price changes
Total Revenue
price x quantity
Relationship between TR and Elasticity
elastic: as price increases, TR drops
inelastic: as price increases, TR rises
cross-price elasticity of demand
measures how quantity demanded of one good responds to the price change of another
positive: substitutes
negative: complements
Price Elasticity of Supply
how sensitive quantity supplied is to price changes
determinants of supply elasticity
time period
flexibility of production
availability of inputs
Midpoint Method of Calculating Elasticities
when to use: comparing two points on a demand or supply curve (before and after change); asked to find elasticity over a range of prices and quantities; when you want a consistent, direction-independent result
Willingness to Pay (WTP)
maximum amount a buyer is willing to pay for a good
Consumer Surplus (CS)
= WTP - price paid
market CS: the area between demand curve and price level
English Auction
bids go up until the highest bidder wins
Dutch Auction
price goes down until a buyer accepts
Willingness to Sell (WTS)
minimum price a seller is willing to accept
Producer Surplus (PS)
= price received - WTS
market PS = area between supply curve and price level
Total Surplus (social welfare)
= CS + PS
measures the total benefit to society
Desirability of Free Markets
maximize total surplus and allocate resources efficiently
Taxes and their Economic Consequences
affect price paid by buyers and received by sellers
cause deadweight loss and reduce total surplus
Tax Incidence
who actually bears the burden of a tax - buyers and sellers (depends on relative elasticities)
Tax Revenue
= tax x quantity sold
Deadweight Loss (DWL)
loss in total surplus due to market distortion, like taxes or tarrifs
Nonbinding Price Controls
has no effect because the market equilibrium is already legal
Binding Price Controls
has an economic effect because it forces the price away from equilibrium
Price Ceiling
legal maximum price, like rent controls; binding if set below equilibrium (causes shortages)
Price Floor
legal minimum price, like minimum wage; binding if set above equilibrium (causes surpluses)
Rent Control
price ceiling applied to housing rents
Price Gouging Laws
temporarily limiting prices during emergencies
Minimum Wage & its history
price floor for labor
Short-Run and Long-Run Effects of Price Controls
SR: quantity and supply/demand are less responsive
LR: elasticities increase, making effects of DWL worse
Fixed Costs (FC)
costs that do not change with the level of output
ex. rent, salaries, insurance (all must be paid even in production = 0)
Variable Costs (VC)
costs that change with the level of output
ex. raw materials, hourly wages, electricity