Unit 2 - AP Microeconomics Vocabulary
1/115
There's no tags or description
Looks like no tags are added yet.
Name | Mastery | Learn | Test | Matching | Spaced |
|---|
No study sessions yet.
116 Terms
Demand
consumers’ ability and willingness to pay for a good or service
Law of Demand
a decrease in the price of a good causes an increase in the quantity demanded
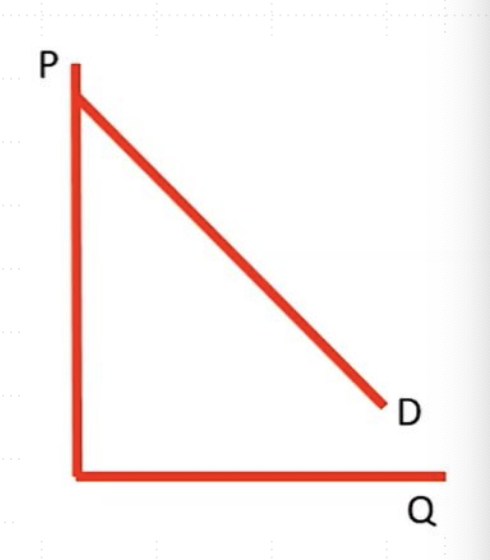
Law of Demand: As price falls from P1 to P2,
quantity demanded increases from Q1 to Q2
Law of Demand: As price increases from P2 to P1,
quantity demanded decreases from Q2 to Q1
Price and Quantity (demanded) are our ___
variables
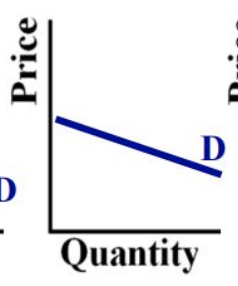
Draw Law of Demand graph
What happens if the price of a good changes?
The existing demand curve can show the new quantity demanded.
What happens if something other than price changes?
A new demand curve is needed.
Can the current demand curve handle changes in price?
Yes, it can show the new quantity demanded when price changes.
If demand changes, this is a shift in the ___
demand curve
If quantity demanded changes, this is a ____
movement along the demand curve.
Why does a demand curve slope downward?
Diminishing Marginal Utility, Income Effect, & Substitution Effect
Diminishing Marginal Utility
As more units of a good are consumed, the utility from each additional unit decreases, leading people to pay less for each subsequent unit.
Income Effect
When the price of a good falls, consumers experience an increase in purchasing power
Substitution Effect
When the price of a good increases, consumers switch to (substitute) less expensive alternatives.
Market demand
adding together the quantities that all consumers in the marketplace are willing to buy at each price
What causes a shift in demand?
1. Tastes and Preferences
2. Number of Consumers
3. Price of Related Goods
4. Income
5. Future Expectations
Substitutes
used in the place of the other
If the price of one increases, the demand for the other will increase (or vice versa).
Complements
two goods that are bought for the other will increase (or vice versa)
If the price of one increase, the demand for the other will fall (or vice versa).
Normal Goods
As income increases, demand increases
As income falls, demand falls
Inferior Goods
As income increases, demand falls
As income falls, demand increases
Future Expectations
If you expect the price to increase soon, you are more likely to go out and buy something now.
If you expect the price to decrease, you will wait for the price drop and decrease current consumption.
Demand is on whose side?
Consumers
Supply is on whose side?
Producers
Supply
the relationship between a good’s price and the quantity supplied by producers/sellers
Law of Supply
an increase in the price of a good causes an increase in the quantity supplied
Draw Law of Supply Curve
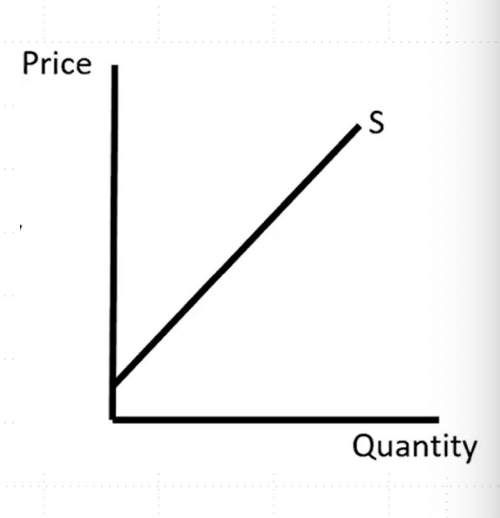
Law of Supply: As price falls from P1 to P2,
quantity supplied decreases from Q1 to Q2
Law of Supply: As price increases from P2 to P1,
quantity supplied increases from Q2 to Q1
Long run
period of time long enough that anything can be changed.
Short run
the period before the long run, when some things may be fixed.
5 Shifters (Determinants) of Supply
Prices/Availability of inputs (resources)
Number of Sellers
Technology
Government Action: Taxes & Subsidies
Expectations of Future Profit
Taxes
raise the market price of a good, across all prices; but the
government gets the extra money, not the firm.
The firm will sell fewer units; they don’t like taxes.
Subsidies
government payments to firms to encourage particular industries or goods.
The firm gets extra money for selling that good, so they will produce more units.
Price Elasticity of Demand/Supply
Measure of how responsive quantity demanded/supplied is to changes in price
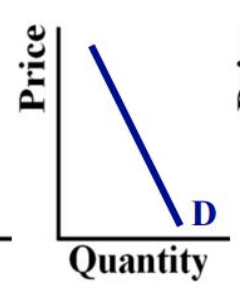
Elastic Demand
A price increase causes a large decrease in quantity demanded
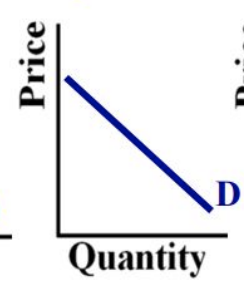
Inelastic Demand
A price increase causes a small decrease in quantity demanded
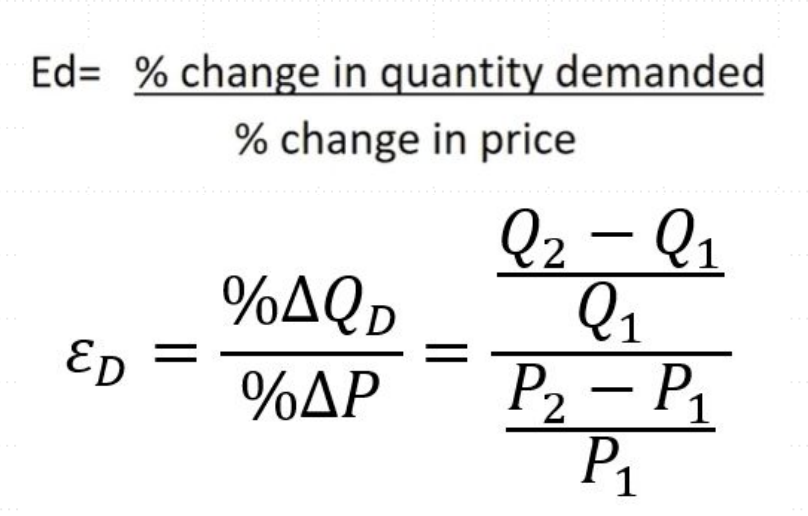
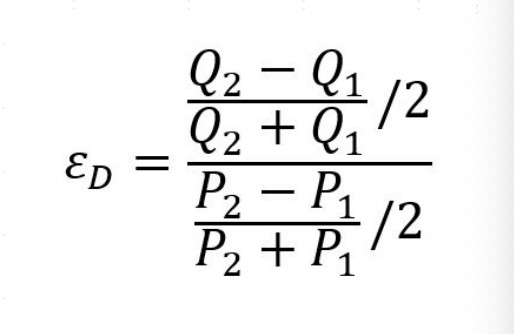
Price Elasticity of Demand FORMULAS (2)
Midpoint Formula for Elasticity
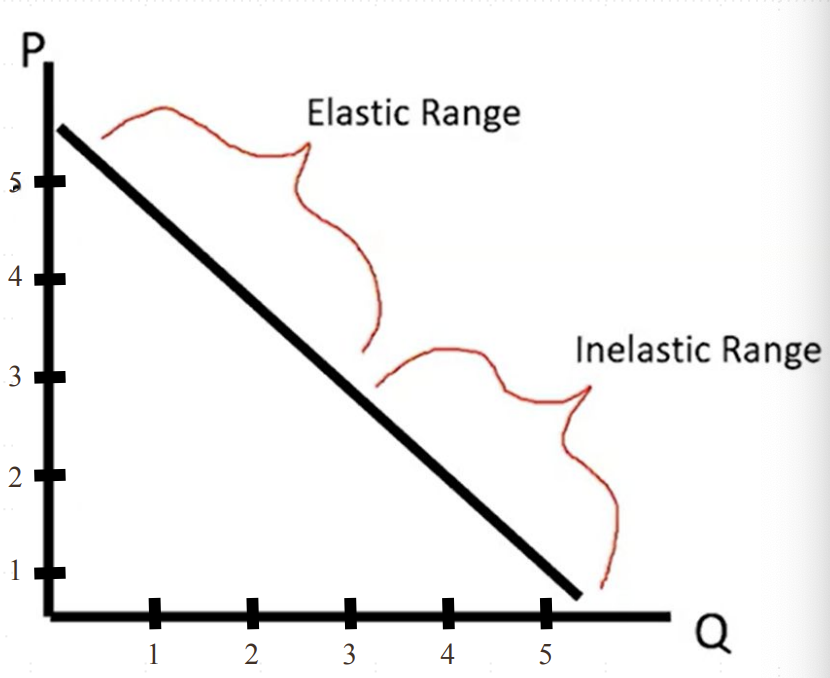
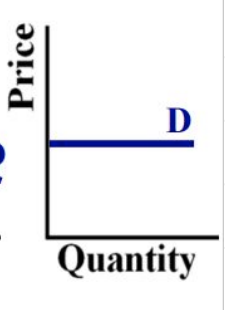
Where is the elastic range and inelastic range on graph?
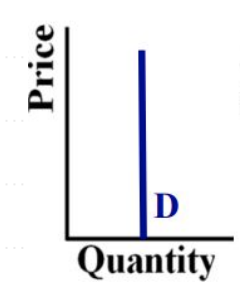
Perfectly inelastic value
0
Relatively Inelastic value
<1
Unit Elastic value
1
Relatively Elastic
>1
Perfectly Elastic
Infinite
Total Revenue =
Price * Quantity
Inelastic means arrows for price and TR are
facing same direction
Elastic means the arrows for price and TR are
opposite direction
Determinants of Elasticity
Availability of Close Substitutes
Necessity vs, Luxury
Percentage of Budget
Time
Availability of Close Substitutes
Demand is more elastic if there are many substitutes.
Necessity vs. Luxury
Demand is more inelastic if you need the good.
Percentage of Budget
Demand is more elastic for larger purchases.
Time
Demand is more inelastic when you have to make a decision quickly (and because you have less time to wait for a price change).
Elastic supply
A price increase causes a large increase in quantity supplied
Inelastic supply
A price increase causes a small increase in quantity supplied
Price of Alternative Input
supply is more elastic if it is easy to find alternative inputs.
Time
supply is more elastic when producers have more time to adjust to price changes
The absolute value of the price elasticity of supply increases when…
the price of alternative inputs decreases
Income Elasticity of Demand
Measure of how responsive quantity demanded is to changes in income(don’t take absolute value anymore!)
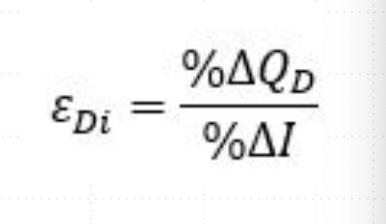
Income Elasticity of Demand: If the result is positive…
the good is normal - (quantity increases as income increases).
Income Elasticity of Demand: If the result is negative…
the good is inferior - (quantity decreases as income increases).
Queens (Quantity) over
Peasants (Price)
Cross-Price Elasticity of Demand
Measure of how responsive quantity demanded of one good is to changes in price of another good.
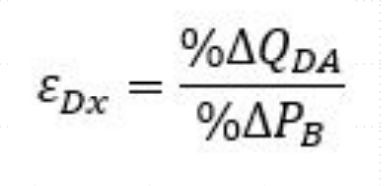
Cross-Price Elasticity of Demand: If the result is positive…
the goods are substitutes.
Cross-Price Elasticity of Demand: If the result is negative…
the goods are complements.
Market Equilibrium - where is it found?
the Demand curve and the Supply curve intersect: Qd = Qs at this price
Market Equilibrium
Consumers want to purchase the same amount producers want to sell
No shortages or surpluses
Qe is equilibrium quantity, Pe is equilibrium price
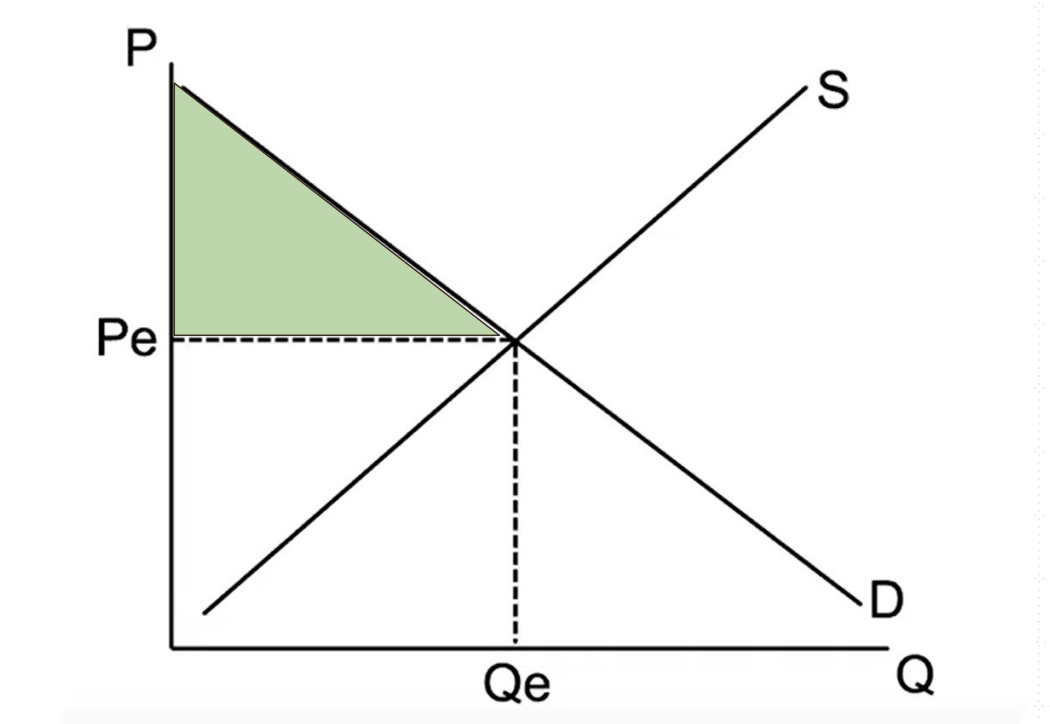
(2.6) Consumer Surplus
the benefit to consumers from paying less than the price they are willing to pay; consumers benefit from lower prices.
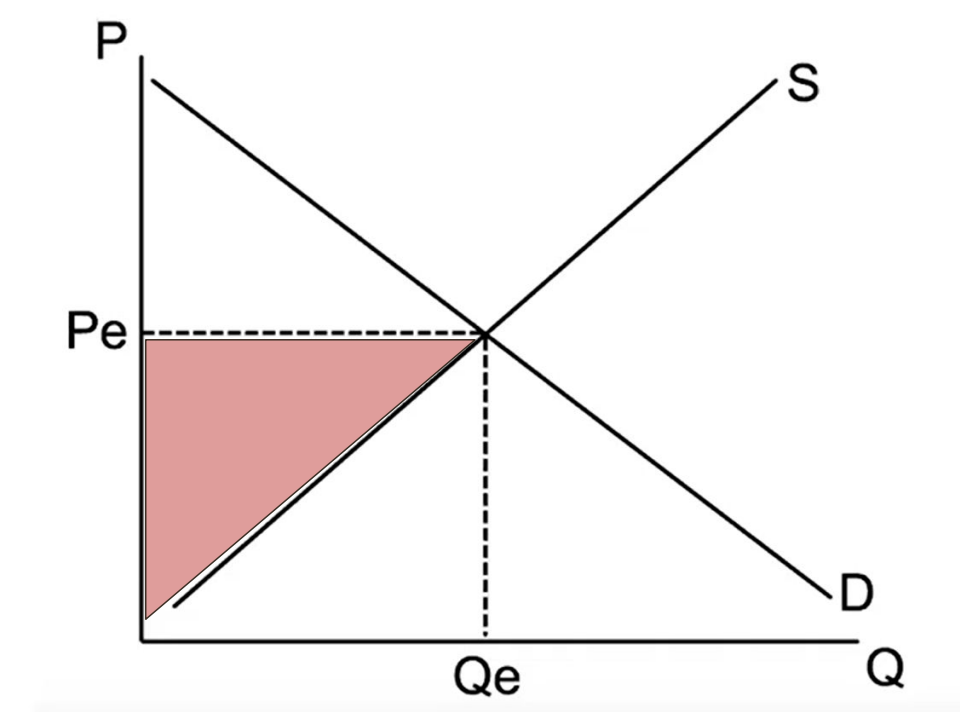
(2.6) Producer Surplus
the benefit to sellers from selling at a price higher than the price for which they’d be willing to sell; producers benefit from higher prices.
Total Surplus =
Consumer Surplus + Producer Surplus
Total surplus is _____ at market equilibrium.
maximized
Market Disequilibrium
Qd no longer equals Qs at the current price; total surplus is no longer maximized.
Shortage
When the quantity demanded is greater than the quantity supplied at the prevailing price
QD > QS
Consumers want to buy more units than producers want to sell
Surplus
When the quantity supplied is greater than the quantity demanded at the prevailing price
QS > QD
Producers want to sell more units than consumers want to buy
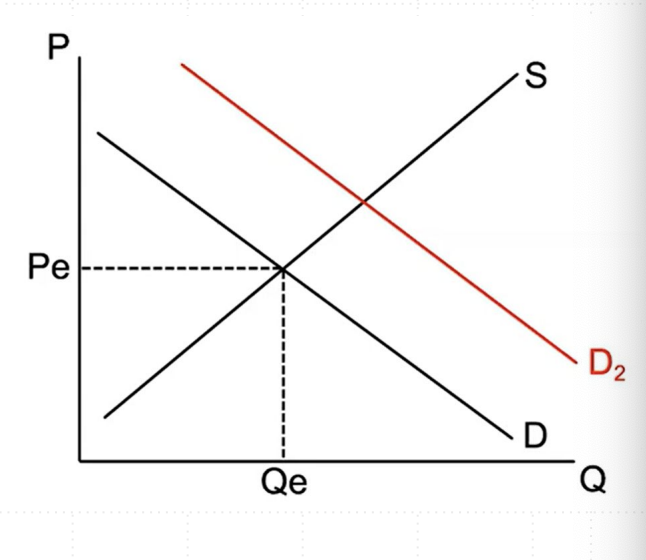
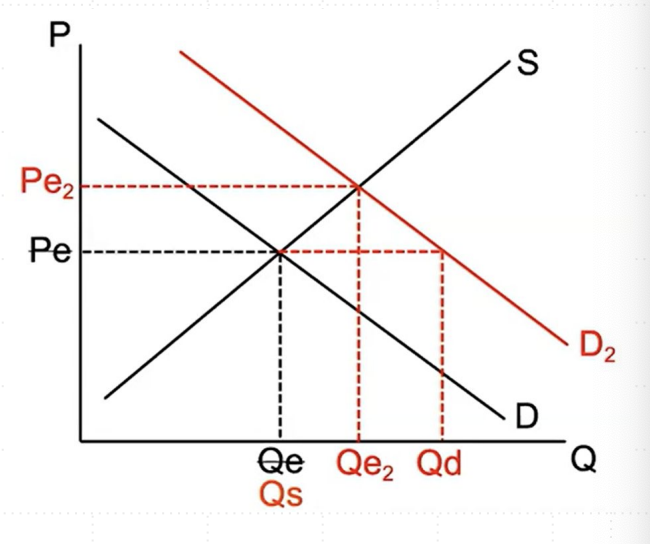
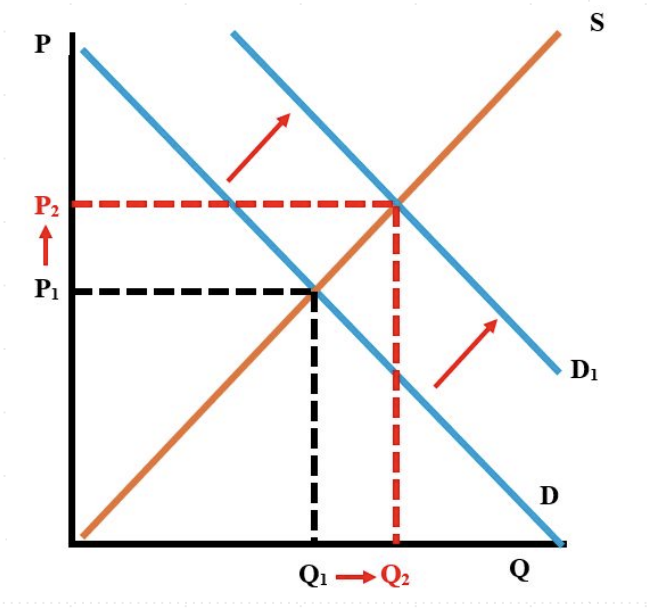
Increase in Demand
Initially creates shortage
(QD > QS at P1 )
Quantity increases Price increases
Decrease in Demand
Initially creates surplus
(QS > QD at P1 )
Quantity decreases Price decreases
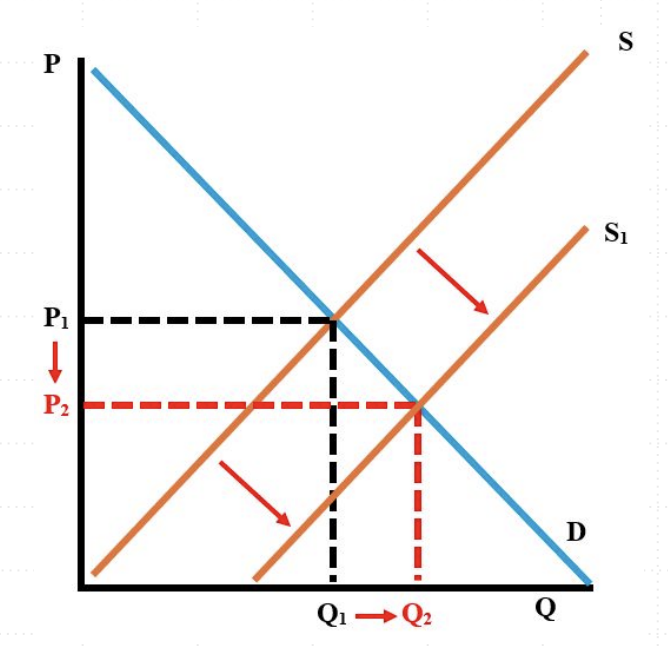
Increase in Supply
Initially creates surplus
(QS > QD )
Quantity increases Price decreases
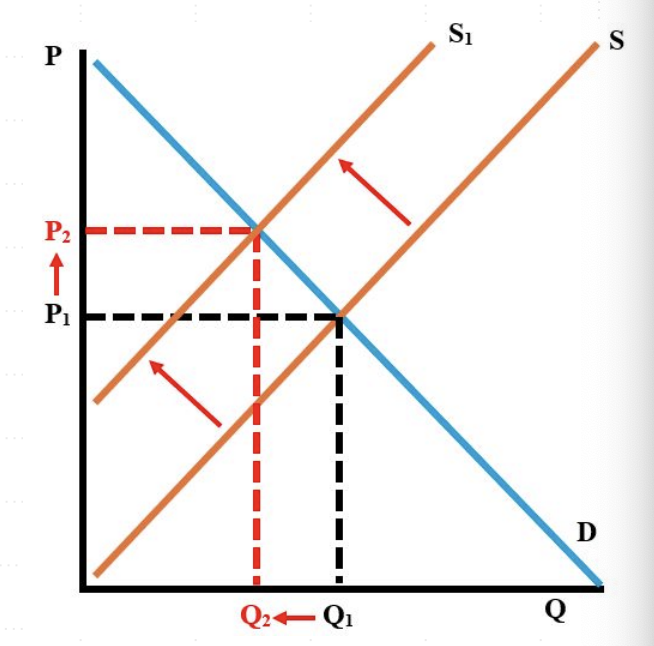
Decrease in Supply
Initially creates shortage
(QD > QS )
Quantity decreases Price increases
If both curves shift, either price or quantity will have a definite change and the other will be ______.
indeterminate
Elasticity and New Equilibria
The price elasticity of supply and demand will affect how large the change in the equilibrium will be after a curve shift.
Relatively elastic demand
small change in equil. price
large change in equil. quantity
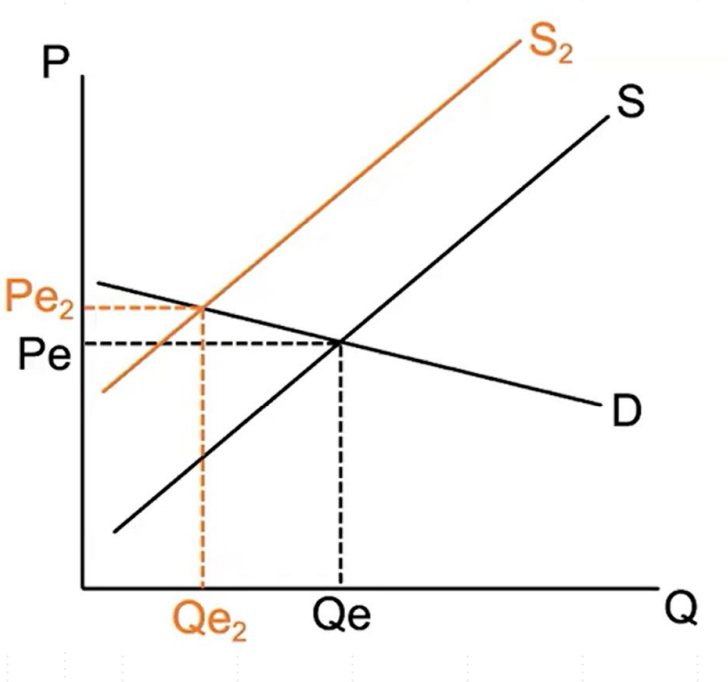
Relatively elastic demand
large change in equil. price
small change in equil. quantity
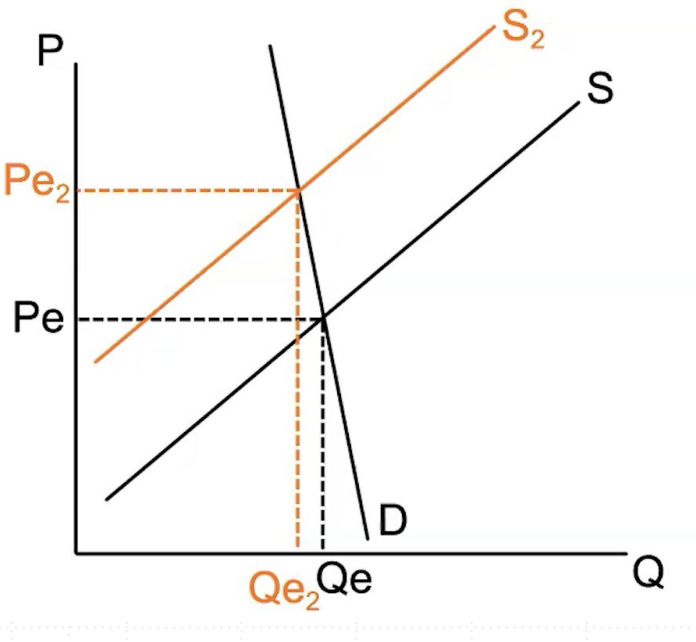
For supply shifts…
the price elasticity of demadn affects the magnitude of the changes in price and quantity
For demand shifts…
the price elasticity of supply affects the magnitude of the changes in price and quantity
Changes in Surplus
Surplus changes when equilibrium changes; one of Consumer or Producer Surplus will increase or decrease depending on curve shifts.
Indeterminate Change
The change in the other surplus (Consumer or Producer) is indeterminate and cannot be determined with given information.
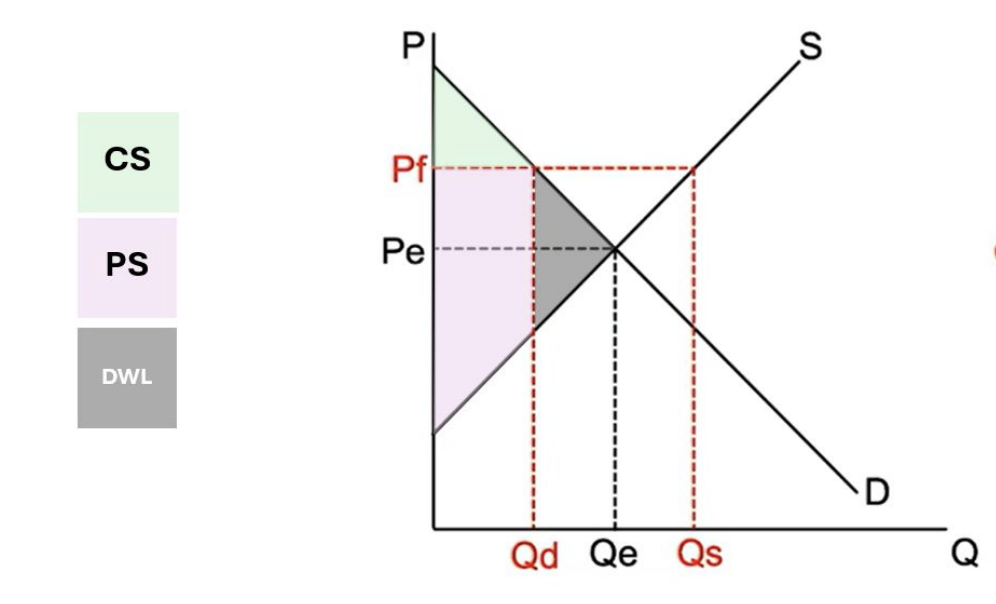
Price Ceiling
a legal upper limit (maximum) on the price that can be charged; must be below equilibrium price to be effective (binding)
Price Floor
a legal lower limit (minimum) on the price that can be charged; must be above equilibrium price to be effective (binding)
Quota
a limit on the quantity that can be sold in a market
Deadweight Loss
Loss in surplus due to non-equilibrium pricing, indicating allocative inefficiencyy
Allocative efficiency
not achieving optimal allocation of resources based on consumer preferences
How does price floor graph look like? What is the calculation?
Qs - Qd = surplus
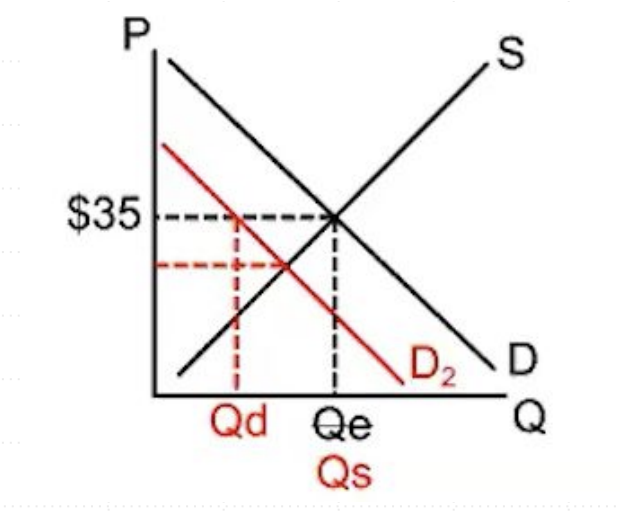
How does price ceiling graph look like? What is the calculation?
Qd - Qs = shortage
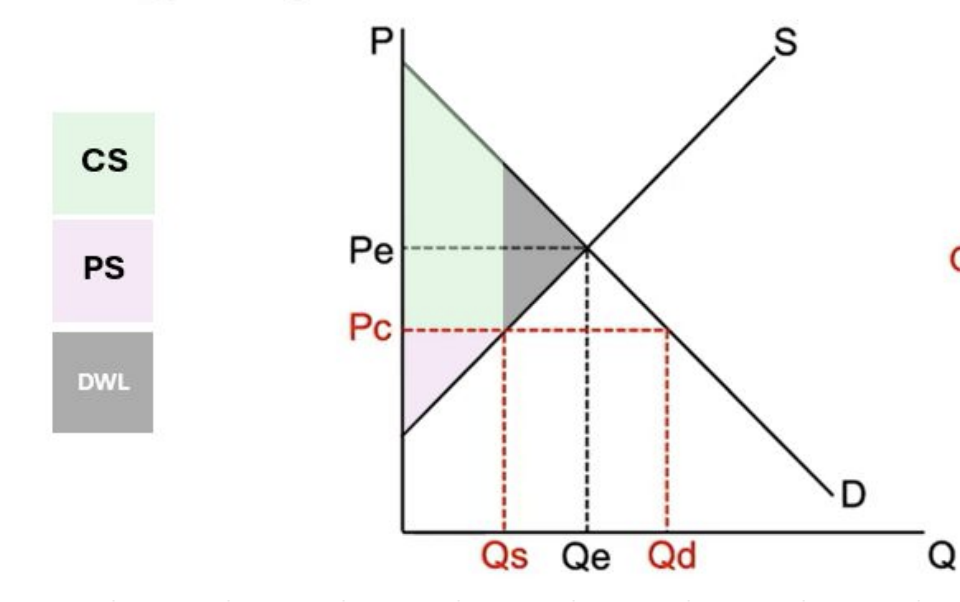
A ceiling must be ___ the equilibrium price.
below
A floor must be ___ the equilibrium price.
above
Excise tax
per-unit tax on the purchase of a good; this discourages production of that good
Subsidy
a per-unit cash transfer from the government for producing a good; this encourages production of that good.
We treat the tax as an ____ in the cost of production
increase