Week 7: Quantitative hypothesis testing
1/32
There's no tags or description
Looks like no tags are added yet.
Name | Mastery | Learn | Test | Matching | Spaced | Call with Kai |
|---|
No analytics yet
Send a link to your students to track their progress
33 Terms
Confidence intervals
Used to estimate the range within which a population parameter is likely to fall, based on sample statistics.
→ use the sample mean as an estimate of the population mean
Sample mean
Mean of your sample (a subset of the population).
Population mean
Mean in the population.
Point estimate
A sample mean is known as a point estimate of the population mean.
Interval estimate
Confidence intervals of the mean are interval estimates of where the population mean might lie.
What confidence mean is typically used, especially in Psychology?
95% confidence interval typically used
For 95% of samples, the true value of the population mean will fall within this interval.
What is the relationship between sample size and variation with confidence intervals?
Greater variation in population = greater confidence intervals
Larger samples = smaller confidence intervals
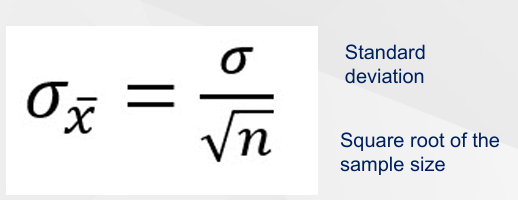
What is the standard error and how do you calculate this?
Deviation of the sampling distribution of the mean.
What should we multiply the standard error by to get the 95% confidence interval?
1.96
→ 95% confident that our sample mean will be within 1.96 SDs of the population mean
Worked example of standard error
For our sample, we collected eating behaviour scores 9, 12, 13, 10, 12, 11, 13, 12, 13, 13; Mean= 11.8; SD= 1.33.
The 95% confidence interval = 0.42 → x 1.96 = 0.82
The confidence interval is 11.8 ± 0.82, so the 95% confidence interval of the mean is 10.98-12.62
What are some issues with standard error?
Small samples have larger confidence intervals
Larger samples have narrower confidence intervals
The larger the sample size, the better the estimate of the population - better confidence interval - better approximate the mean
→ representative sample and random, probability sampling
Hypothesis
A precise statement of an assumed relationship between variables/the effect of variables.
A prediction about how something will behave
The effect of the IV on the DV; the relationship between the IV and the DV
Must be testable, precise and clear
Null hypothesis (H0)
States that there is no difference.
Alternative/research/experimental hypothesis(H1)
States that there will be a difference.
What type of hypothesis is used during statistical testing?
A research hypothesis is translated into a statistical null hypothesis for testing.
Harping
We collect the data, look at the data and generate a hypothesis afterwards.
Aspects of a research/alternative hypothesis
There is a difference/effect/relationship between the variables we are studying.
The population means from the 2 groups/conditions are not equal
Phrasing of the hypothesis relates to the type of study you are conducting and the variables being measured
→ differences = t-tests
→ relationships = correlations
Causal hypothesis
Suggests a particular causal influence; only appropriate if you are using an experimental design.
→ e.g. consuming caffeine causes driving impairment
Non-causal/associative hypothesis
Suggests particular characteristics of behaviour without reference to causation.
→ e.g. consuming caffeine is associated with driving impairment
Directional hypothesis/one-tailed
Suggests the direction of the effect.
theory-driven
more statistical power, gives us stronger results
→ there may be previous research to support the use of a directional hypothesis
Non-directional hypothesis
Doesn't specify the direction of the difference/effect. Predicted that there will be a difference/relationship, but you have not predicted the direction of that
→ e.g. there will be a difference in driving impairment after consuming different strengths of caffeine
Directional & causal example
Greater alcohol level consumption causes greater impairment in recognising familiar faces.
Directional & non-causal example
Greater alcohol level consumption is related to greater impairment in recognising familiar faces.
Non-directional & causal example
Alcohol consumption causes impairments in recognition of familiar faces.
Non-directional & non-causal example
Alcohol consumption is related to recognition of familiar faces.
T-tests of difference
Used when comparing groups of people or results of the same person under different conditions.
Correlations
Used when looking at how variables are associated or related.
Sampling error
Discrepancy between the sample statistic and the actual population parameter, which can lead to incorrect conclusions if not properly accounted for.
sometimes, it is likely the patterns of scores in our samples do not accurately reflect the underlying population
Central limit theorem
States that the distribution of sample means approaches a normal distribution as the sample size increases, regardless of the population's distribution.
As the size of the sample increases, the nearer the sample means will be to the population mean, and the closer to normal will be the distribution
How do we use the ‘p-value’
‘Probability value’ - Relates to the null hypothesis; it is the probability of the results if the null were true.
If p > 0.05, we do not have sufficient evidence to reject the null hypothesis
If p < 0.05, we have sufficient evidence to reject the null hypothesis
Hypothesis testing process
Formulate a hypothesis and collect data to measure this.
Run statistical analyses on the data to produce a test statistic.
Compare the test statistic with a known distribution of values to determine likelihood if the null hypothesis were true.
If this calculated probability is small enough, it suggests that the pattern of findings is unlikely to have arisen by chance and reflects a genuine effect in the population - this is statistically significant
For a set of data, we have a standard deviation of 42 and a sample size of 16. What is the standard error?
A) 0.339
B) 2.95
C) 10.5
D) 21.68
C - 10.5
If we have a 95% confidence interval of 7 +/- 2, what does this mean?
A) The population mean is between 5 and 9
B) 95% confident that the population mean falls between 7 and 2
C) 95% confident that the population mean falls between 5 and 9
D) None of the above
C