FDA - Exploratory Data Analytics, week 1
1/28
There's no tags or description
Looks like no tags are added yet.
Name | Mastery | Learn | Test | Matching | Spaced | Call with Kai |
|---|
No analytics yet
Send a link to your students to track their progress
29 Terms
Categorical (qualitive) data
No numeric value
Categorical (qualitive) data → Nominal data
Two or more outcomes with no natural order (blond, brown, green hair)
Categorical (qualitive) data → Ordinal data
Two or more outcomes with a natural order (good, medium, bad)
Categorical (qualitive) data → Dichotomous data
Two possible outcomes (true/false, yes/no)
Numerical (quantitative) data
With a numeric value
Numerical (quantitative) data → Continuous data
Can attain any value
Numerical (quantitative) data → Continuous data → Interval data
No fixed zero point (clock time, birth year)
Numerical (quantitative) data → Continuous data → Ratio data
With fixed zero point (money, distance, time duration)
Numerical (quantitative) data → Discrete data
Can only attain certain values (number of...)
Cyclic data
Has a circular order and allows some numeric operations (days of week, wind direction)
One-dimensional data
One value
example: make a histogram of hight of people. There are 8 people with a hight of 1.80m, 1.80m is a value but 8 people is just a count and not a value.
Two-dimensional data
Two values
Example: temperature and ice cream sales. Temperature is one value and the amount of sales is the other value
Dot plot
One value, one-dimensional
To find clusters, ouliers
Scatter plot
Two values(numeric), two-dimensional
Investigates relations and used to see if there are outliers
Histogram
One value(numeric), one-dimensional
Data is split in bins(=staven)
To understand the distribution of the data
Bar chart
Two values(1 categorical, 1 numeric), two-dimensional
To look up and compare values
Mean
Average
(1 + 5 + 8 + 2) / 4 = 4
Median
The value separating the lower half from the higher half
100, 160, 200, 360: median = 180
10, 20, 30, 40, 50: median = 30
Mode
Most frequently occurring value
1, 3, 1, 5, 2, 3, 1: mode = 1
Range
maximum - minimum
60, 70, 75, 90, 95
→ 95 - 60 = 35, range = 35
Interquartile range
Median Q3 - median Q1
Sample variance
Tells you on average, how far the data values from the mean, squared
→ the higher the statistics the more spread/variability in the data
Sample standard deviation
Tells you how many units it is away from the mean
→ the higher the statistics the more spread/variability in the data
Median absolute deviation
Measures how far data values typically are from the median
→ the higher the statistics the more spread/variability in the data

Unimodal distribution (1 peak)
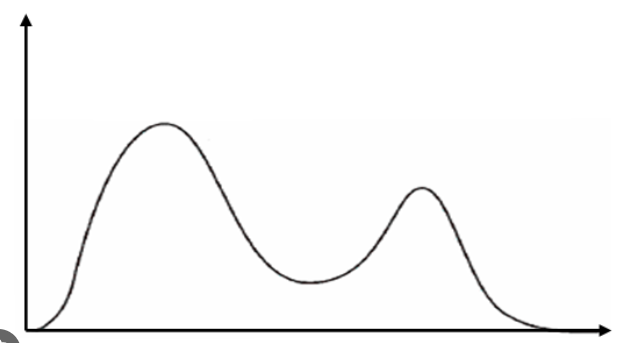
Bimodal distribution (2 peaks)
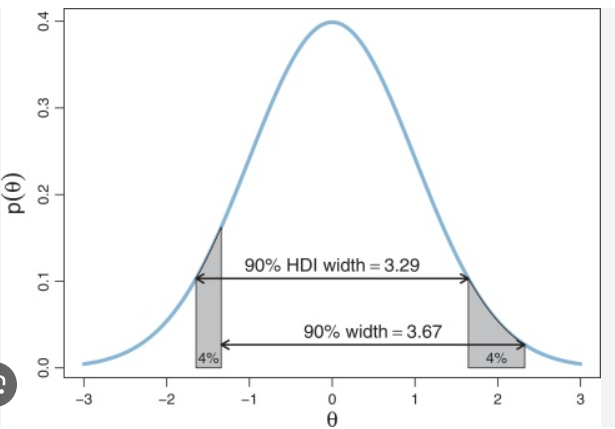
Symmetric distribution
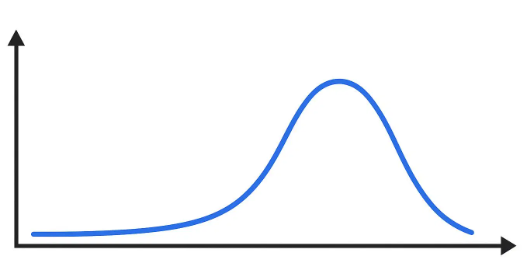
Left - skewed (negative)
mean<median<mode
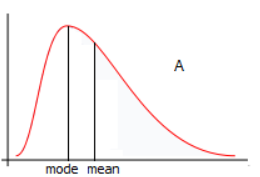
Right - skewed (positive)
mode<median<mean