Stars
1/16
Earn XP
Description and Tags
Name | Mastery | Learn | Test | Matching | Spaced | Call with Kai |
|---|
No analytics yet
Send a link to your students to track their progress
17 Terms
How is the surface temperature of a star is related to its colour?
Dull red = low temperatire (relatively)
Reddish-orange = medium
Blue-white = hottest
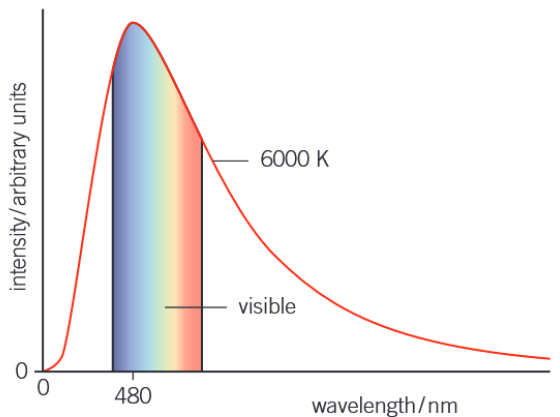
What is the graph of intensity of radiation against its wavelength for a black body?
This graph is for a black body at a temperature of 6000k
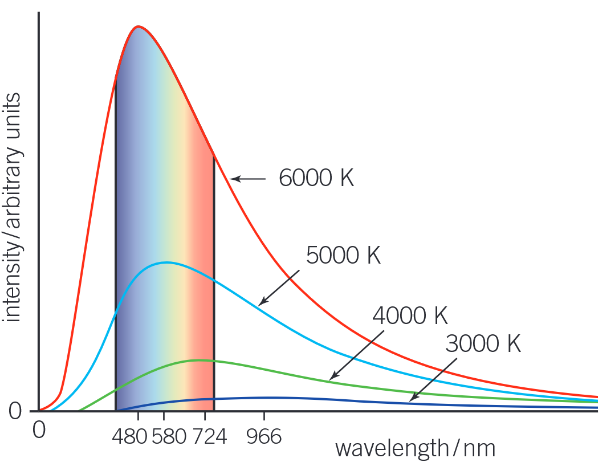
What happens to the graph of intensity of radiation against wavelength when the temperature is changed?
How can the surface temperature of a star be estimated?
By observing the wavelength of radiation at which maximum intensity occurs, and using the equation T = Wein’s constant / λmax
State Wien’s Displacement Law as an equation and in words
λmax ∝ 1 / T
The peak wavelength λmax at which the intensity of radiation from a black body is a maximum is inversely proportional to the absolute temperature T of the black body
Define intensity of radiation
The radiant power passing through a surface per unit area
Unit Wm-2
Define luminosity
The total radiant power output of a star
Symbol L, unit watts (W)
What equation relates the intensity of a star to its luminosity?
Intensity = luminosity / surface area of star
State the Stefan-Boltzmann Law, with the meaning and units for all terms
L = 4πr²σT⁴
L is the luminosity of the star in watts (W)
r is the radius of the star in metres (m)
T is the surface absolute temperature of the star in kelvin (K)
σ is the Stefan constant, 5.67x10⁻⁸Wm-2K-4.
What are the key feature of the energy levels?
An electron cannot have a quantity of energy between two levels.
The energy levels are negative because external energy is required to remove an electron from the atom. The negative values also indicate that the electrons are trapped within the atom or bound to the positive nuclei.
An electron with zero energy is free from the atom.
The energy level with the most negative value is known as the ground level or the ground state.
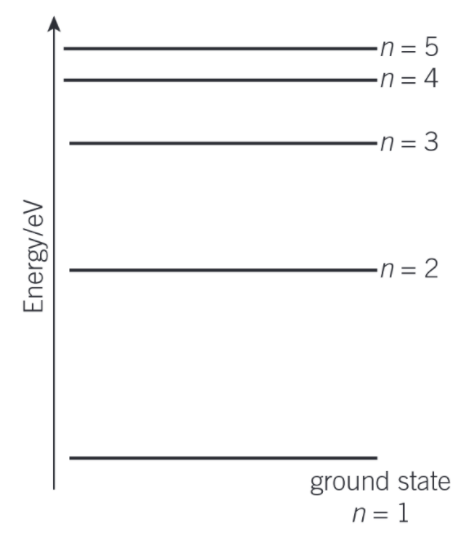
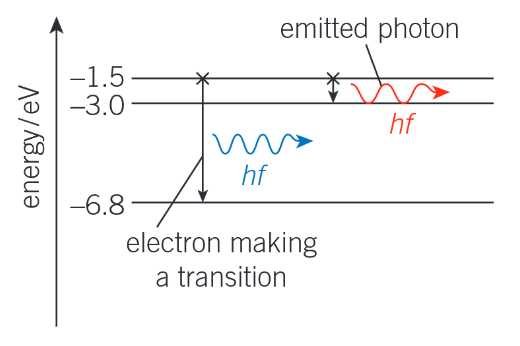
Draw an energy level diagram to show emission
Describe excitation
When an electron moves from a lower to a higher energy level within an atom in a gas
This requires external energy, for example, supplied by an electric field, through heating, or when photons of specific energy are absorbed by the atoms.
How can you work out the emission frequency of a photon for a given electron transition?
f = ΔE / h
f is the emission frequency
ΔE is the difference in energy between the two energy levels
h is planck’s constant
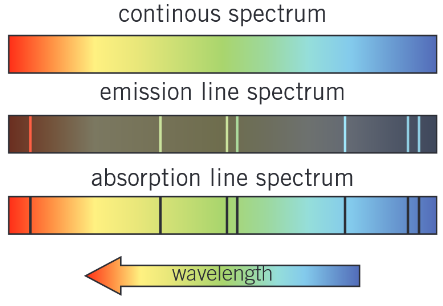
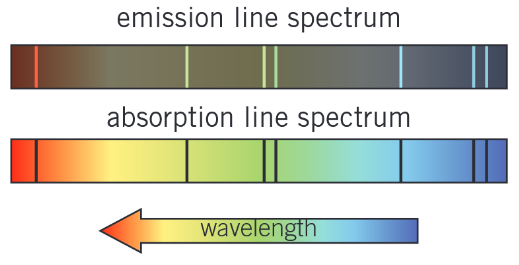
What is the difference between an emission line spectrum and an absorption line spectrum?
Emmision line spectra are a set of specific frequencies of electromagnetic radiation emitted by excited atoms as their electrons make transitions between higher and lower energy states.
Absorption line spectra show the frequencies of light absorbed by atoms. They have series of dark spectral lines (showing the frequencies that are absorbed) against the background of a continuous spectrum.
The dark lines of an absorption line spectrum have exactly the same wavelengths as the bright emission spectral lines of a emmision line spectrum for the same gas atoms.
Define spectroscopy
A technique in physics in which spectral lines are identified and measured in order to identify elements present within stars
What is a spectral line?
A line in an emission line spectrum or absorption line spectrum at a specific wavelength
Describe each of the following and how they are different from each other:
Emission line spectra
Continuous spectra
Absorption line spectra
Continuous spectra - all visible frequencies or wavelengths are present.
Emission spectra - only spectral lines at the frequencies or wavelengths emmited by the gas are present
Absorption spectra have a series of dark spectral lines at the frequencies that the gas absorbs against the background of a continuous spectrum.