Applied Multivariate Statistics - Multiple Linear Regression
1/27
Earn XP
Description and Tags
Multiple Linear Regression
Name | Mastery | Learn | Test | Matching | Spaced |
|---|
No study sessions yet.
28 Terms
Multiple Linear Regression (MLR)
A statistical technique used to predict the score of an interval variable from the scores of multiple interval variables using a linear model.
Simple Linear Regression (SLR)
A method to predict the score of an interval variable from the score of another interval variable with a linear model: ŷ = b0 + b1x, where b1 is the slope and b0 is the intercept.
Slope (b1)
In simple linear regression, the slope represents the direction of the relationship between the independent and dependent variable.
Intercept (b0)
In simple linear regression, the intercept is the expected value for y if x = 0.
Null Hypothesis (H0) in SLR
b1 = 0, indicating that when X changes, Y remains the same (no relationship).
Alternative Hypothesis (HA) in SLR
b1 ≠ 0, indicating that when X changes, Y also changes (there is a relationship).
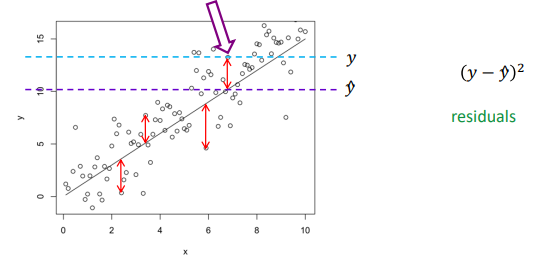
Error Term (e) or Residual
The difference between the actual value (y) and the predicted value (ŷ) in a regression model.
Multiple Linear Regression Equation
ŷ = b0 + b1x1 + … + bkxk, where k is the number of predictors in the model.
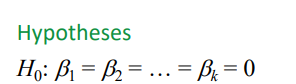
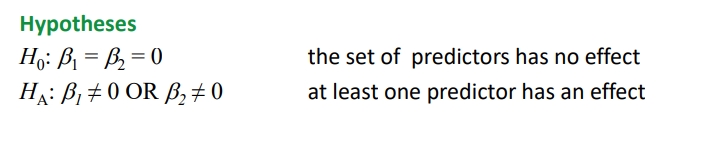
Null Hypothesis (H0) in MLR
b1 = b2 = … = bk = 0, meaning the set of predictors has no effect on the dependent variable.This hypothesis posits that changes in the predictors do not result in changes in the outcome variable, implying there is no relationship.
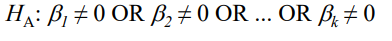
Alternative Hypothesis (HA) in MLR
b1 ≠ 0 OR b2 ≠ 0 OR … OR bk ≠ 0, meaning at least one predictor has an effect on the dependent variable.
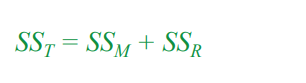
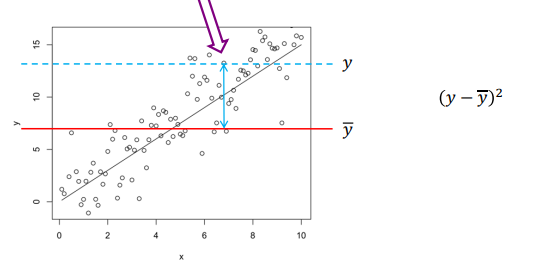
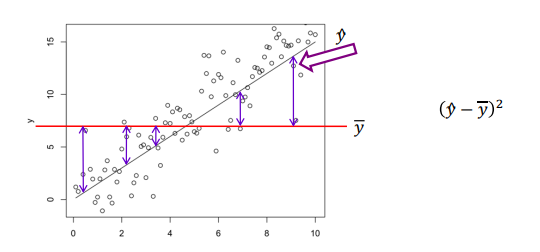
Total Sum of Squares (SST)
Measures the total spread in the dependent variable (Y).Squared deviations of scores from the grand mean ()
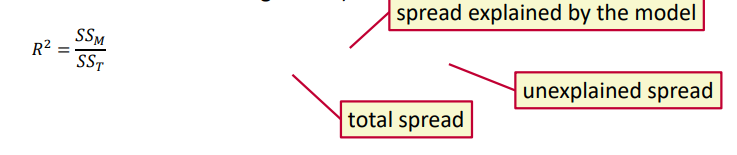
Model Sum of Squares (SSM)
Measures the spread explained by the regression model. Squared deviations of fitted values (ŷ) from the grand mean ()
Residual Sum of Squares (SSR)
Measures the spread not explained by the regression model, that remains unexplained. Squared deviations of scores (y) from the fitted values/regression line (ŷ)
Coefficient of Determination (R2)
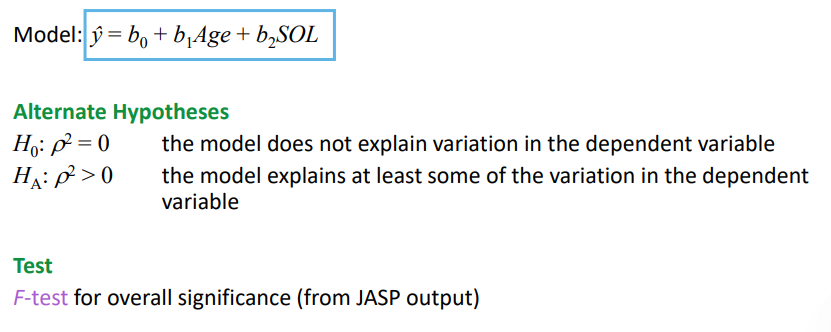
Measure of effect size for regression. Measures the proportion of the variation in the dependent variable (y) that is explained by the linear relationship with all the independent variables.
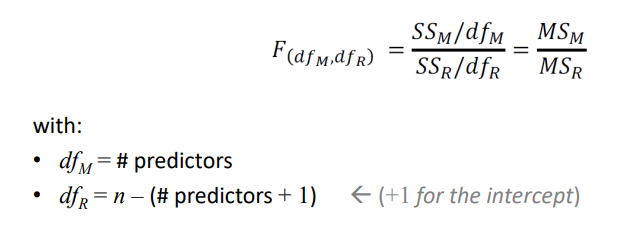
F-test - Is the regression model significant?
Ratio of explained and unexplained variance, used to determine if the regression model is significant.
RQ: predict happiness from age (control variable) and social life (SOL). Hypothesis for predictors:
As age increases, happiness will improve based on social life quality. Test t-tests for regression coefficients (from JASP output)
RQ: predict happiness from age (control variable) and social life (SOL). Hypothesis for variance:
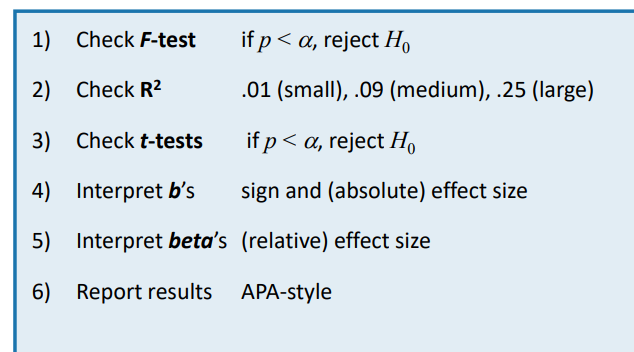
Steps in regression analysis
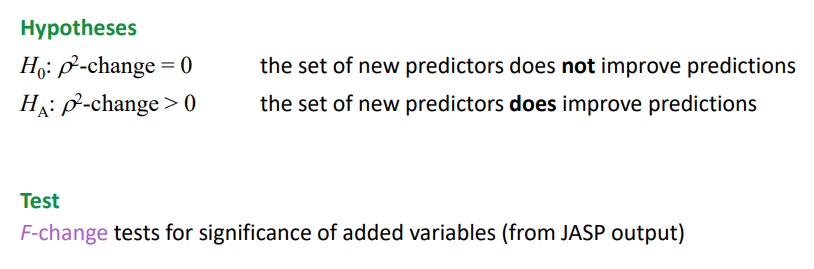
RQ2: Does the addition of the social network factors supportive children and supportive spouse improve the prediction?
We don’t test if these are good predictors, but if they improve the prediction given that age and social life are already in the model
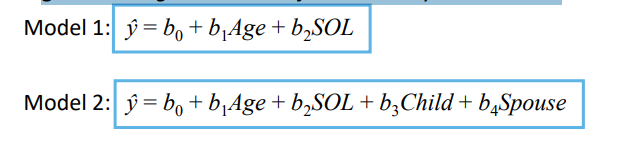
Hierarchical Regression (Sequential Analysis) and hyphtohesis
Adding predictors to the model in a sequence to see if the addition of new variables improves the prediction.
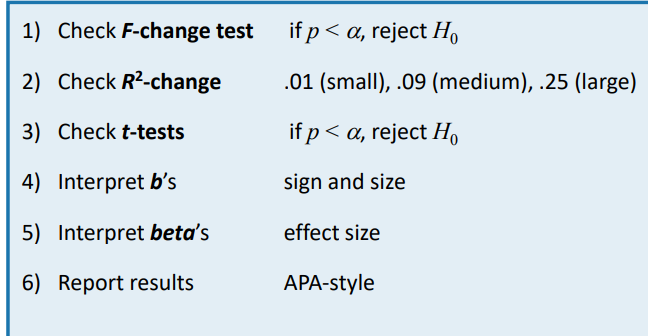
Steps in sequential analysis
Theory-driven approaches in variable selection
Recommended for deciding which variables to include in a regression model, as researchers often know more than computers.
The regression coefficients always depend
on the presence of other predictors in the model
Enter method
= Researcher decides (what we have done so far)
Backward method
start with all the variables, remove predictors with highest p-values one by one, stop when all are significant
Forward method
compute all SLR models and start with the model that has the lowest p-value, then add predictors one by one with ascending p-values, stop when none can be added
Stepwise method
at each moment you can go forward or backward (define p-in and p-out)
Regression Models
Do not allow for causal conclusions due to potential issues like reverse causality or omitted variables. Direction of the causal relationship: Does 𝑌 cause 𝑋, or does 𝑋 cause 𝑌?
Omitted variables: is there a third variable that causes both 𝑋 and 𝑌?