unit 5 - unit 6 mcq
1/29
There's no tags or description
Looks like no tags are added yet.
Name | Mastery | Learn | Test | Matching | Spaced | Call with Kai |
|---|
No analytics yet
Send a link to your students to track their progress
30 Terms
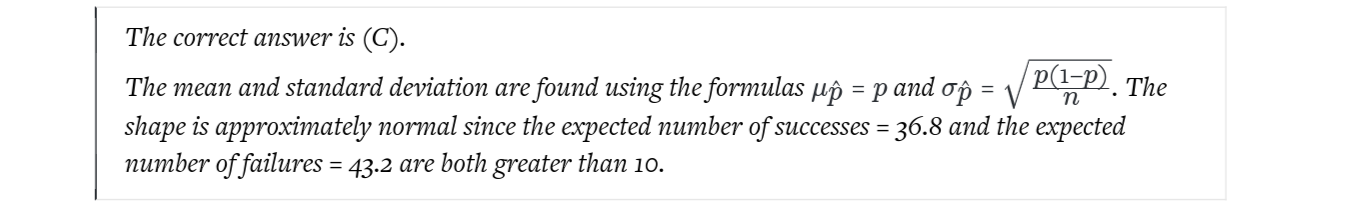
In a large city, 46% of adults support the local football team building a new stadium. If a poll is
taken from a random sample of 80 adults in the large city, which of the following properly describes
the sampling distribution of the sample proportion of adults who support the stadium?
(A) = 36.8, = 4.46, the distribution is approximately normal.
(B) = 36.8, = 4.46, shape of the distribution is unknown.
(C) = 0.46, = 0.056, the distribution is approximately normal.
(D) = 0.46, = 0.056, shape of the distribution is unknown.
(E) = 43.2, = 4.46, the distribution is binomial.
Which of the following statements is true?
(A) A parameter is a number that describes some characteristic of a sample.
(B) An unbiased estimator is any statistic that is taken from a sample chosen by random methods.
(C) A sampling distribution is the distribution of a statistic calculated from all possible samples of the same size from the same population.
(D) The variability of a population distribution will decrease as the sample size increases.
(E) A normal approximation can always be used for the sampling distribution of �^p^ as long as the sample size is greater than 30.
The correct answer is (C).
This is the definition of a sampling distribution.
The weight of a single bag checked by an airplane passenger follows a distribution that is right skewed with a mean of 38 pounds and a standard deviation of 6.2 pounds.
If a random sample of 96 bags is selected, what is the probability that the average weight of the bags exceeds 40 pounds?
(A) 0.0008
(B) 0.0011
(C) 0.3735
(D) 0.9992
(E) It is not appropriate to use a normal distribution to calculate probability in this situation.
The correct answer is (A).
A normal distribution should be used for the calculation. The z-score for a bag exceeding 40 pounds is 3.16 and P(z>3.16) = 0.0008.
The correct answer is (B).
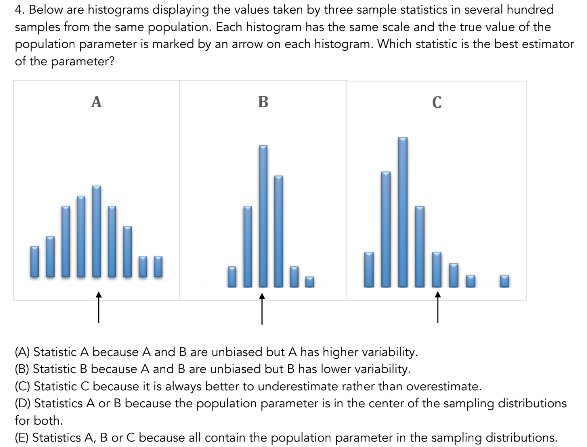
The best statistic is unbiased, with the lowest variability.
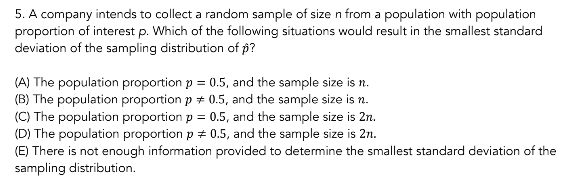
The correct answer is (D).
Any population proportion not equal to 0.5 will decrease the product of p(1−p). Also, increasing the sample size will decrease the variability of the sampling distribution.
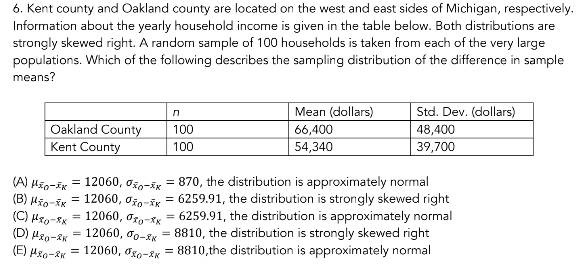
The correct answer is (C).
The mean and standard deviation are found using (sample means for two proportions formula) and the distribution is approximately normal since both samples are large (n>30).
A recent report states that 89% of Americans consider themselves above average drivers. A local newspaper is planning on conducting a survey to investigate whether this is true locally.
If the newspaper assumes that the 89% claim is true and plans to use the normal approximation to calculate probabilities associated with their sample proportion, which sample size would be most appropriate?
(A) 10
(B) 11
(C) 30
(D) 91
(E) The number depends on the size of the population.
The correct answer is (D).
The requirements for the normal condition np≥10 and n(1−p)≥10 are only satisfied with sample sizes of 91 or greater.
Daren and Josh are pretty good free throw shooters. Daren makes 75% of the free throws he attempts. Josh makes 80% of his free throws.
Suppose we take separate random samples of 50 free throws each from Daren and Josh, and record the proportion of free throws that are made by each. Which of the following best describes the sampling distribution of pD−pJ?
(A) Strong skew, with mean -0.05 and standard deviation 0.083
(B) Approximately normal, with mean -0.05 and standard deviation 0.083
(C) Shape cannot be determined, with mean -0.05 and standard deviation 0.083
(D) Strong skew, with mean -0.05 and standard deviation 0.118
(E) Approximately normal, with mean -0.05 and standard deviation 0.118

Donner Summit, California, is a popular ski resort area. Over the past 60 years, the annual snowfall totals of Donner Summit have followed a distribution that is strongly skewed right with a mean of 404 inches and a standard deviation of 129 inches.
If many samples of size 9 were taken, which of the following would best describe the shape of the sampling distribution of x?
(A) The shape is approximately normal since the sample size is reasonably large.
(B) The shape is skewed right since np≥10 and n(1−p)≥ 10p)≥10 has not been met.
(C) The shape is equally as skewed right as the population distribution.
(D) The shape is skewed right but less so than the population distribution.
(E) Cannot be determined from the given information.
The correct answer is (D).
The small sample size means that the shape of the sampling distribution will be similar to the shape of the population distribution, but the central limit theorem states that the sampling distribution will tend towards normal as the sample size increases.
The heights of all adult males in Croatia are approximately normally distributed with a mean of 180 cm and a standard deviation of 7 cm. The heights of all adult females in Croatia are approximately normally distributed with a mean of 158 cm and a standard deviation of 9 cm.
If independent random samples of 10 adult males and 10 adult females are taken, what is the probability that the difference in sample means (males – females) is greater than 20 cm?
(A) 0.3463
(B) 0.6537
(C) 0.6827
(D) 0.7104
(E) 0.8687
The correct answer is (D).
The sampling distribution of x1-x2 has a mean of 22 and standard deviation of 3.6055. P(z > -0.5547) = 0.7104.
An AP Statistics class surveys 24 randomly selected female students from their high school, and calculates a 95% confidence interval for the mean height of female students to be 63.4±1.6 inches.
Which of the following is a correct interpretation of this interval?
(A) There is a 95% probability that the true mean height of female students at the school falls between 61.8 and 65.0 inches.
(B) We can be 95% confident that the true mean height of female students at the school is 63.4 inches.
(C) 95% of the time, we can be confident that the mean sample height of female students will fall between 61.8 and 65.0 inches.
(D) We can be 95% confident that the true mean height of female students at the school is between 61.8 and 65.0 inches.
(E) There is a 95% probability that the true mean height of female students at the school is 63.4 inches.
The correct answer is (D).
Confidence intervals can always be interpreted as a level of confidence that the true parameter falls within the interval.
A random sample of 18 adults, chosen from the 1500 adults in the town, took a survey asking their opinion on a recent property tax change. 25% of those who responded said they were in favor of the change. The company running the survey wants to construct a confidence interval estimating the proportion of all adults in the town who support the change.
Which of the conditions for inference have been satisfied?
I. Random condition
II. Normal condition
III. 10% condition
(A) I
(B) II
(C) I and III
(D) II and III
(E) I, II, and III
The correct answer is (C).
The sample was a random sample and the sample (18) is less than 10% of the population (1500). The normal condition is not satisfied as np = 18(0.25) = 4.5 < 10.
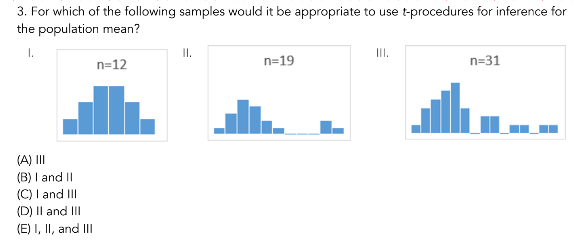
The correct answer is (C).
Sample I shows no strong skew or outliers, and sample III has a sample size at least 30.
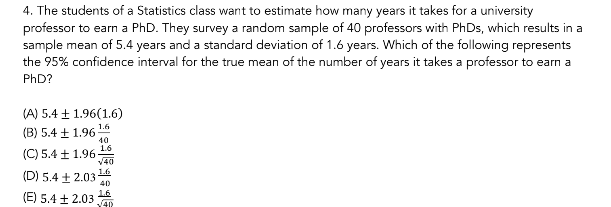
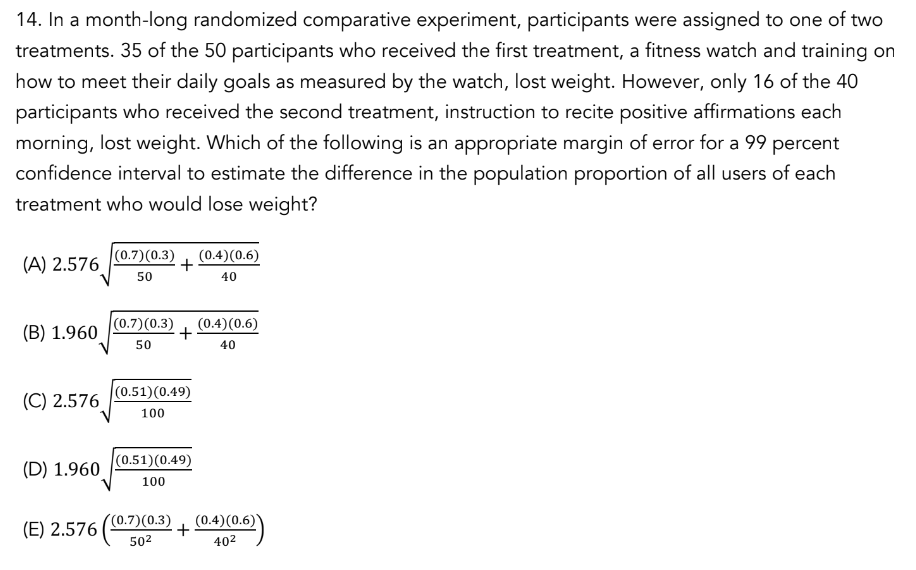
The correct answer is (E).
The t-distribution with df = 39 is used instead of a z-distribution since σ is unknown, resulting in t* = 2.03. The formula for the standard deviation of the sampling distribution is
A study intends to estimate a population mean with an unknown population standard deviation and a sample size of 15.
Which of the following is closest to the appropriate critical value to create a 98% confidence interval?
(A) 2.055
(B) 2.249
(C) 2.264
(D) 2.602
(E) 2.624
The correct answer is (E).
The t-distribution is used with df=14 and a 98% confidence level (0.01 upper tail probability).
A newspaper plans to conduct a survey for the upcoming presidential election in order to estimate the proportion of the population, p, who supports a certain candidate.
What is the smallest sample size needed to obtain an estimate that is within 4% of the true proportion p at the 96% confidence level?
(A) 26
(B) 376
(C) 601
(D) 660
(E) Cannot be determined from information given.
The correct answer is (D).
Since we don’t have an estimate for p, we use p=0.5, which gives us the largest possible margin of error, and the critical value for 96% confidence is z* = 2.054. Use algebra to solve for n and then round up to 660.
A random sample of size n is collected from a considerably larger population of size N. That sample is used to create a 95% confidence interval to estimate a population proportion.
Using the same sample proportion, the confidence interval would be narrower if:
(A) A smaller sample size was used.
(B) A t-procedure was used instead of a z-procedure.
(C) A higher confidence level was used.
(D) The population size N was larger.
(E) A lower confidence level was used.
The correct answer is (E).
With the sample proportion remaining the same, a lower confidence level results in a lower margin of error and a narrower interval.
A recent study examining the effects of sugar consumption on a middle school student’s ability to focus on a reading assignment used 18 volunteer subjects and divided them into 9 pairs based on their reading speeds. One randomly assigned member of each pair was given a beverage containing a substantial amount of sugar, and the other drank a sugar-free version of the beverage. Each subject was given a passage to read and the time (in seconds) it took to read was recorded.
The difference for each pair is calculated (sugar – sugar-free). A 90% confidence interval for the mean difference in reading times is (-5.8, 0.15).
Which statement is correct?
(A) Because the center of the interval is -2.825, we have convincing evidence that sugar causes faster reading times, on average.
(B) Because the confidence interval includes 0, we don’t have convincing evidence that sugar causes faster reading times, on average.
(C) Because the confidence interval includes 0, we have convincing evidence that sugar causes faster reading times, on average.
(D) Because the confidence interval includes more negative than positive values, we have convincing evidence that sugar causes faster reading times, on average.
(E) Causation should not be inferred because the subjects were volunteers.
Submit
The correct answer is (B).
Because 0 is contained in the confidence interval, it is plausible that the mean difference in reading times is 0. We do not have convincing evidence that sugar causes faster reading times, on average.
A social media developer wants to determine if the proportion of teenagers who use Facebook is the same as the proportion of teenagers who use Snapchat. She takes a random sample of 100 teenagers and finds that 75 of the 100 students use Facebook and 89 of the 100 students use Snapchat.
Would it be reasonable for the social media developer to construct a 95% confidence interval for the true difference in proportion of teenagers that use Facebook and Snapchat?
(A) No, the random condition is not satisfied.
(B) No, the normal condition is not satisfied.
(C) No, the two samples are not independent.
(D) Yes, all conditions have been met.
(E) Cannot be determined from the given information.
The correct answer is (C).
In order to perform inference for a difference in proportions, the two samples must be independent. In this context, there is only a single sample of 100 students.
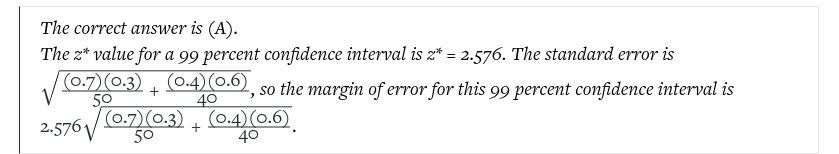
A political polling organization conducted a survey by selecting 100 random samples, each consisting of 500 registered voters. The registered voters in each sample were asked whether they planned to vote for the Republican or Democratic candidate in the next presidential election. For each of the 100 samples, the polling organization created a 99 percent confidence interval for the proportion of all registered voters who planned to vote for the Republican candidate.
Which of the following statements is the best interpretation of the 99 percent confidence level?
(A) We would expect about 99 of the 100 confidence intervals to contain the sample proportion of the registered voters who plan to vote for the Republican candidate.
(B) We would expect about 99 of the 100 confidence intervals to contain the proportion of all registered voters who plan to vote for the Republican candidate.
(C) We would expect the margin of error to be 0.01 because the polling organization constructed 99 percent confidence intervals.
(D) We would expect the margin of error to be less than 0.01 because the polling organization constructed 100 different 99 percent confidence intervals.
(E) We would expect only 1 of the 100 confidence intervals to reveal that the Democratic candidate is favored.
The correct answer is (B).
When we take multiple random samples of the same size from the same population, the confidence level tells us what proportion of the intervals we can expect to capture the population parameter.
A pharmaceutical company claims that side effects will be experienced by fewer than 20% of the patients who use medication X. A clinical trial with a random sample of 400 patients was conducted in which half of the patients were randomly assigned to take medication X and the other half received a placebo. Of those that received medication X they find 68 who experienced side effects.
Assuming all conditions for inference were met, which of the following is a 90 percent confidence interval for the proportion of patients that will experience side effects while taking medication X?
(A) (0.1391, 0.2009)
(B) (0.2744, 0.4057)
(C) (0.2849, 0.3951)
(D) (0.6257, 0.7343)
(E) (0.6416, 0.7184)
The correct answer is (C).
The correct inference procedure is a z-confidence interval for one proportion with = 68/200 = 0.34, z* = 1.645, and n = 200. The 90 percent confidence interval for the proportion of patients that will experience side effects while taking medication X is 0.34±1.6450.34(1−0.34)2000.34±1.6452000.34(1−0.34) = (0.2849, 0.3951).
Household income in the United States is strongly skewed to the right. The current presidential administration claims that the mean household income is greater than it has ever been in the past. An independent contractor will obtain a random sample of 100 households in the United States and will calculate the mean household income.
Which of the following statements is true?
(A) The sampling distribution of the sample mean household income is approximately normal because the sample size of 100 is greater than 30.
(B) The distribution of household income for the sample is approximately normal because the sample size of 100 is greater than 30.
(C) The sampling distribution of the sample mean household income is strongly skewed to the right because the population standard deviation is unknown.
(D) The distribution of household income is strongly skewed to the left because the population sample size of 100 is greater than 30.
(E) The sampling distribution of the sample mean household income is strongly skewed to the right because the population distribution is strongly skewed to the right.
The correct answer is (A).
The central limit theorem says that the sampling distribution of the mean of any independent, random variable will be normal or approximately normal, if the sample size is large. The central limit theorem makes no such claim about the distribution of any specific sample selected from the population.
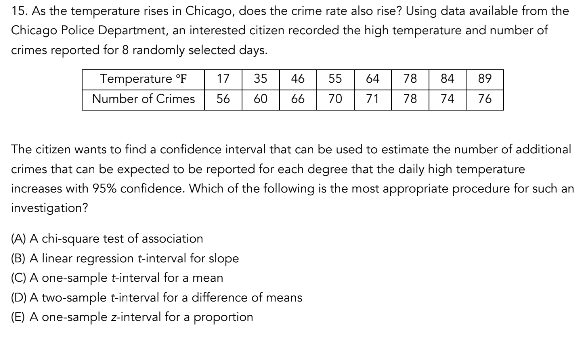
The correct answer is (B).
The correct procedure to estimate the slope of a least-squares regression line is a linear regression t-interval for slope.
A large-sample 95 percent confidence interval for the proportion of credit card customers that have reported fraudulent charges on their account is (0.028, 0.086).
What is the point estimate for the proportion of all credit card customers that have reported fraudulent charges on their account?
(A) 0.057
(B) 0.058
(C) 0.029
(D) 0.114
(E) 0.196
The correct answer is (A).
The point estimate for any confidence interval is exactly at the center of the interval and can be found by averaging the endpoints: �^p = (0.028 + 0.086) / 2 = 0.057.
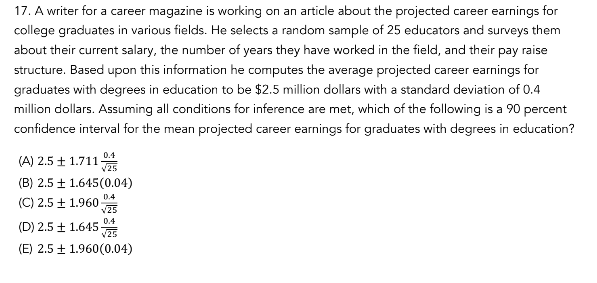
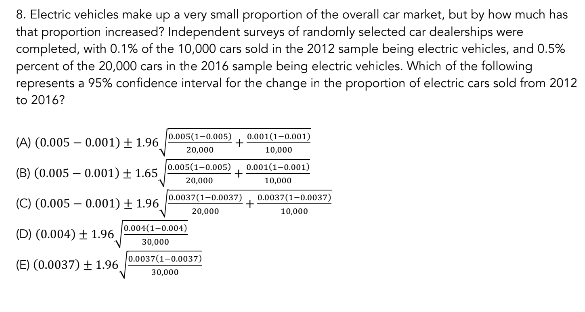
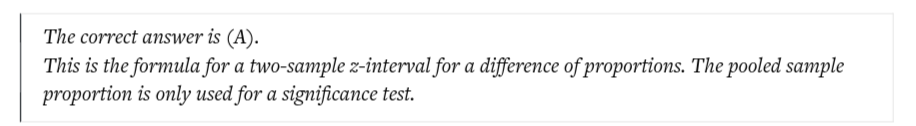
The correct answer is A.
The correct inference procedure is a t-confidence interval for one mean with = 2.5, t* = 1.711 (df = 24), s = 0.4 and n = 25. The 90 percent confidence interval for the mean projected career earnings for graduates with degrees in education is 2.5±1.7110.4252.5±1.711250.4.
A recent article claimed that women are waiting longer to have their first child. The article estimates that the average age of first-time mothers is 26 years old, which is up from 21 years old in 1970. The margin of error for the estimate was 1.5 years.
Based on the estimate and the margin of error, which of the following is an appropriate conclusion?
(A) 95% of the women in the study were 26 years old when they had their first child.
(B) The age of every first-time mother in the sample must have been between 24.5 and 27.5 years old.
(C) The age of every first-time mother in the sample must have been between 23 and 29 years old.
(D) This study proves that women are waiting longer to have their first child.
(E) It is plausible that the average age of first-time mothers is 27 years old.
The correct answer is (E).
The margin of error of 1.5 years indicates that we are confident the population mean age is captured in the interval 26 – 1.5 = 24.5 to 26 + 1.5 = 27.5 years old. Therefore, it is plausible that the average age of first-time mothers is 27 years old.
The correct answer is (C).
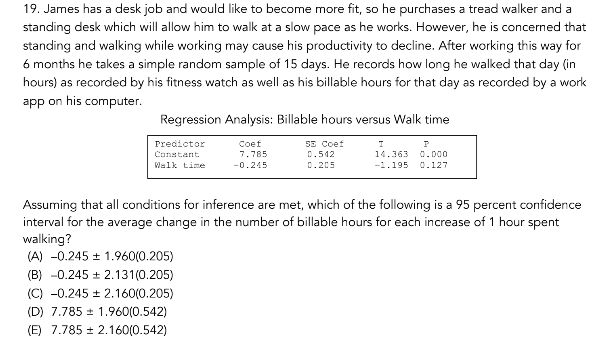
The correct inference procedure is a linear regression t-interval for slope. The slope of the least-squares regression line is –0.245 with a standard error of 0.205. Because he selected a random sample of 15 days, there are 13 degrees of freedom, so t* = 2.160. Therefore, the 95 percent confidence interval for the average change in the number of billable hours for each increase of 1 hour spent walking is –0.245 ± 2.160(0.205).
The correct answer is (A).
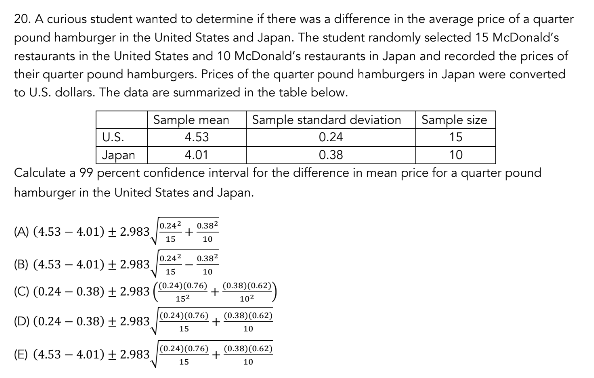
The correct inference procedure is a two-sample t-interval for a difference of means. The point estimate is 4.53 – 4.01. The value of t* based upon df = 13.8 (found using technology) is 2.983. The standard error is 0.24215+0.38210150.242+100.382. Therefore, the 99 percent confidence interval for the difference in mean price for a quarter pound hamburger in the United States and Japan is (4.53−4.01)±2.9830.24215+0.38210(4.53−4.01)±2.983150.242+100.382.