Theme 5 Module 3
1/29
There's no tags or description
Looks like no tags are added yet.
Name | Mastery | Learn | Test | Matching | Spaced | Call with Kai |
|---|
No analytics yet
Send a link to your students to track their progress
30 Terms
Why can’t geneticists study inheritance in humans the same way Mendel studied pea plants?
Back (Answer):
Mendel used pea plants because they:
Produce many offspring
Can be bred on purpose to observe traits
Studying humans is more difficult because:
Humans have few offspring
It is unethical to ask people to breed for experiments
To overcome these limits, geneticists:
Study family history
Create a pedigree (family tree)
Pedigrees allow scientists to:
Visually track traits across generations
Study inheritance patterns without unethical experiments
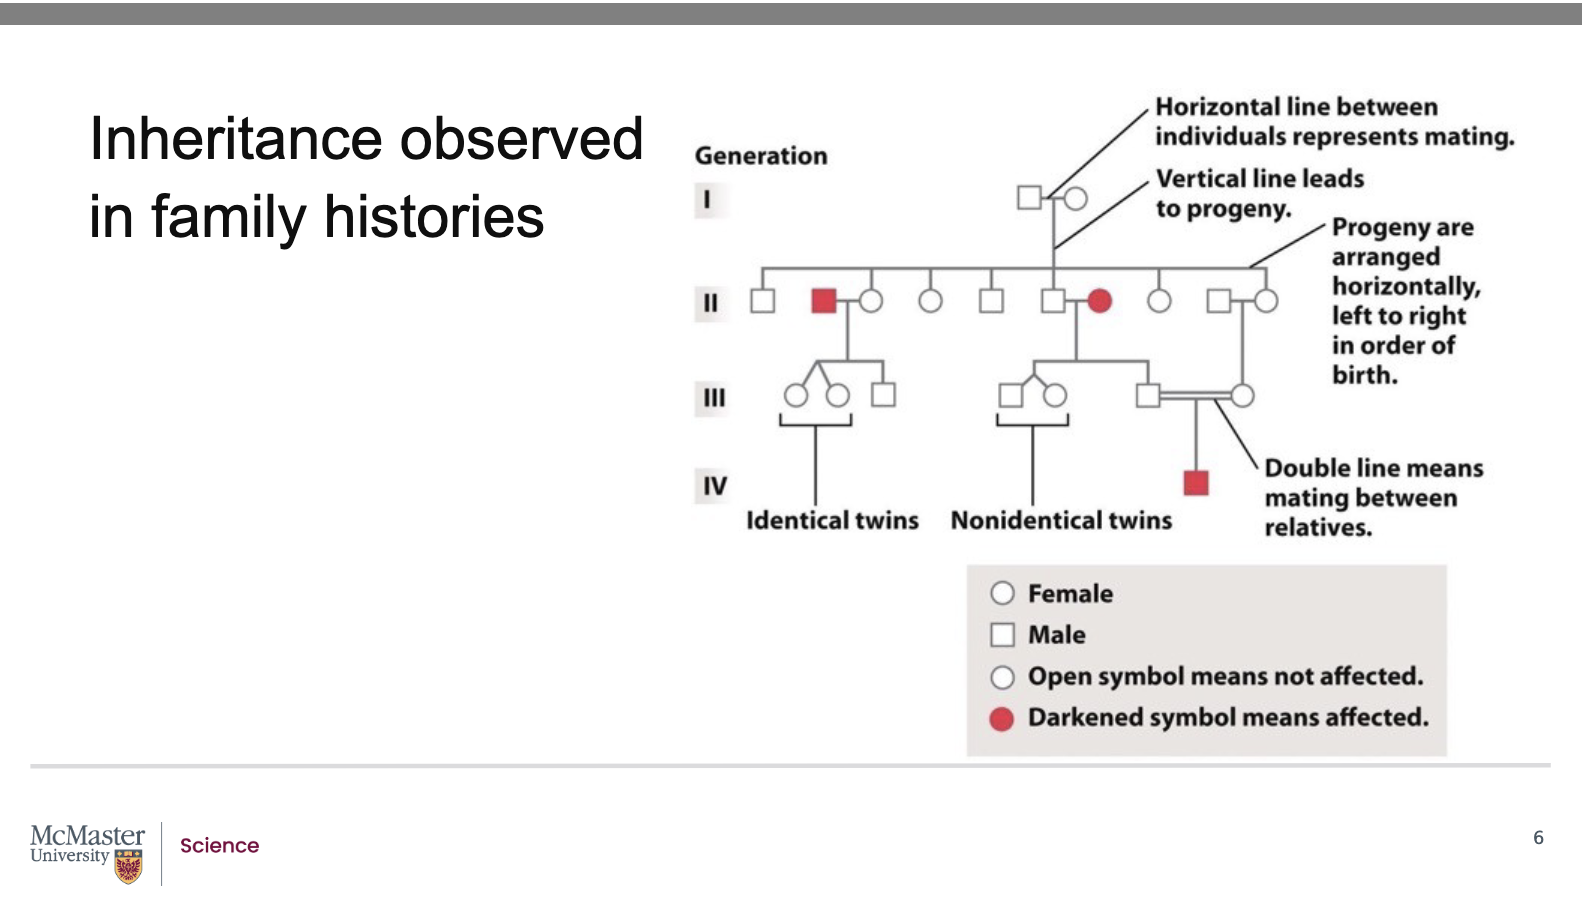
What do the symbols and lines in a pedigree represent? what are pedigrees for?
Back (Answer):
Symbols:
Square = Male
Circle = Female
Shaded symbol = Individual affected by the trait/disease
Relationships:
One horizontal line = Mating between unrelated individuals
Two horizontal lines = Mating between related individuals
Offspring (progeny):
Shown below the parents
Arranged left to right in order of birth
Purpose of pedigrees:
Track how traits are passed down
Identify dominant and recessive inheritance patterns
Observe the same inheritance rules Mendel found in pea plants
Pedigrees are visual tools that show how traits are inherited in families.

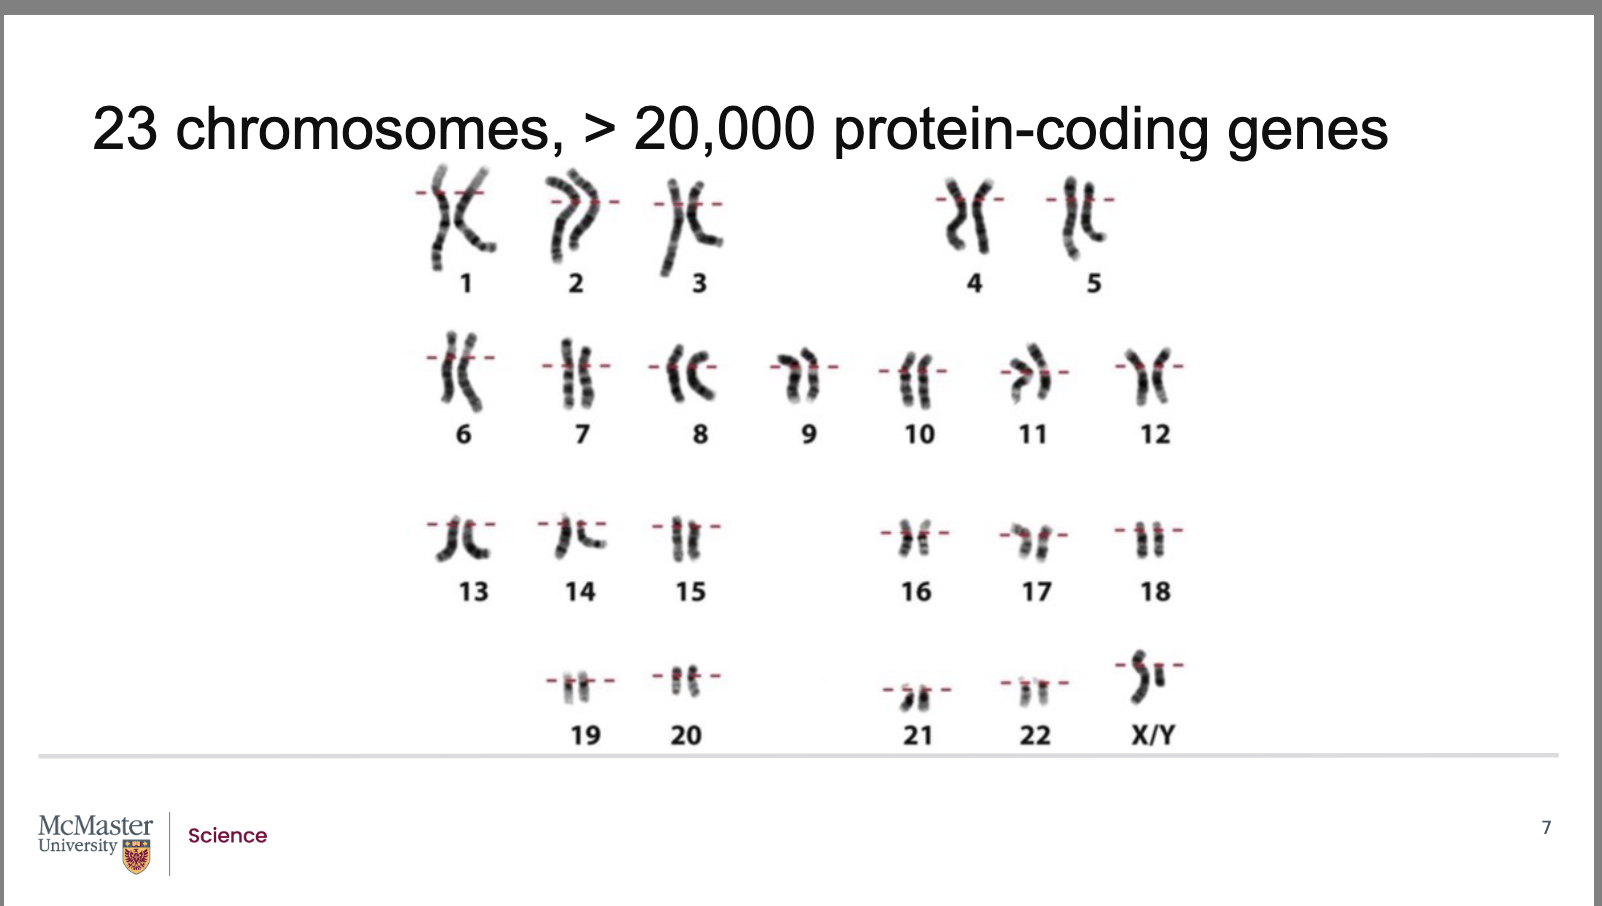
What is the structure of the human genome in terms of chromosomes, DNA, and genes?
Back (Answer):
Human cells contain 23 pairs of chromosomes
These chromosomes together contain over 3 billion base pairs of DNA
After sequencing the human genome, scientists discovered:
More than 20,000 protein‑coding genes
Additional genes that code for functional RNA molecules
This means:
Each chromosome must contain many genes
There is not just one gene per chromosome
🧠 Key idea to remember:
Humans have many genes spread across 23 chromosome pairs.
Are all genes on the same chromosome always inherited together?
Back (Answer):
Mendelian inheritance explains basic dominant and recessive traits
However, because chromosomes have many genes, inheritance is more complex
Important question:
Are all alleles on the same chromosome inherited as one fixed unit?
Observations show:
Plants and animals display many different trait combinations
This means:
Alleles on the same chromosome can separate
They can recombine into new combinations
Therefore:
Genes that are physically linked can become unlinked through recombination
🧠 Key idea to remember:
Linked genes can recombine, creating genetic variation beyond simple Mendelian rules.

How do sex chromosomes determine biological sex in humans?
Back (Answer):
Humans and other mammals have two sex chromosomes:
X chromosome
Y chromosome (much smaller than X)
Females (XX):
Carry two X chromosomes
One X inherited from each parent
Males (XY):
Develop from a gamete with one X and one Y chromosome
Even though males and females differ anatomically and physiologically,
The chromosomal basis of sex determination is unique
🧠 Key idea to remember:
XX = female, XY = male; Y chromosome triggers male development.
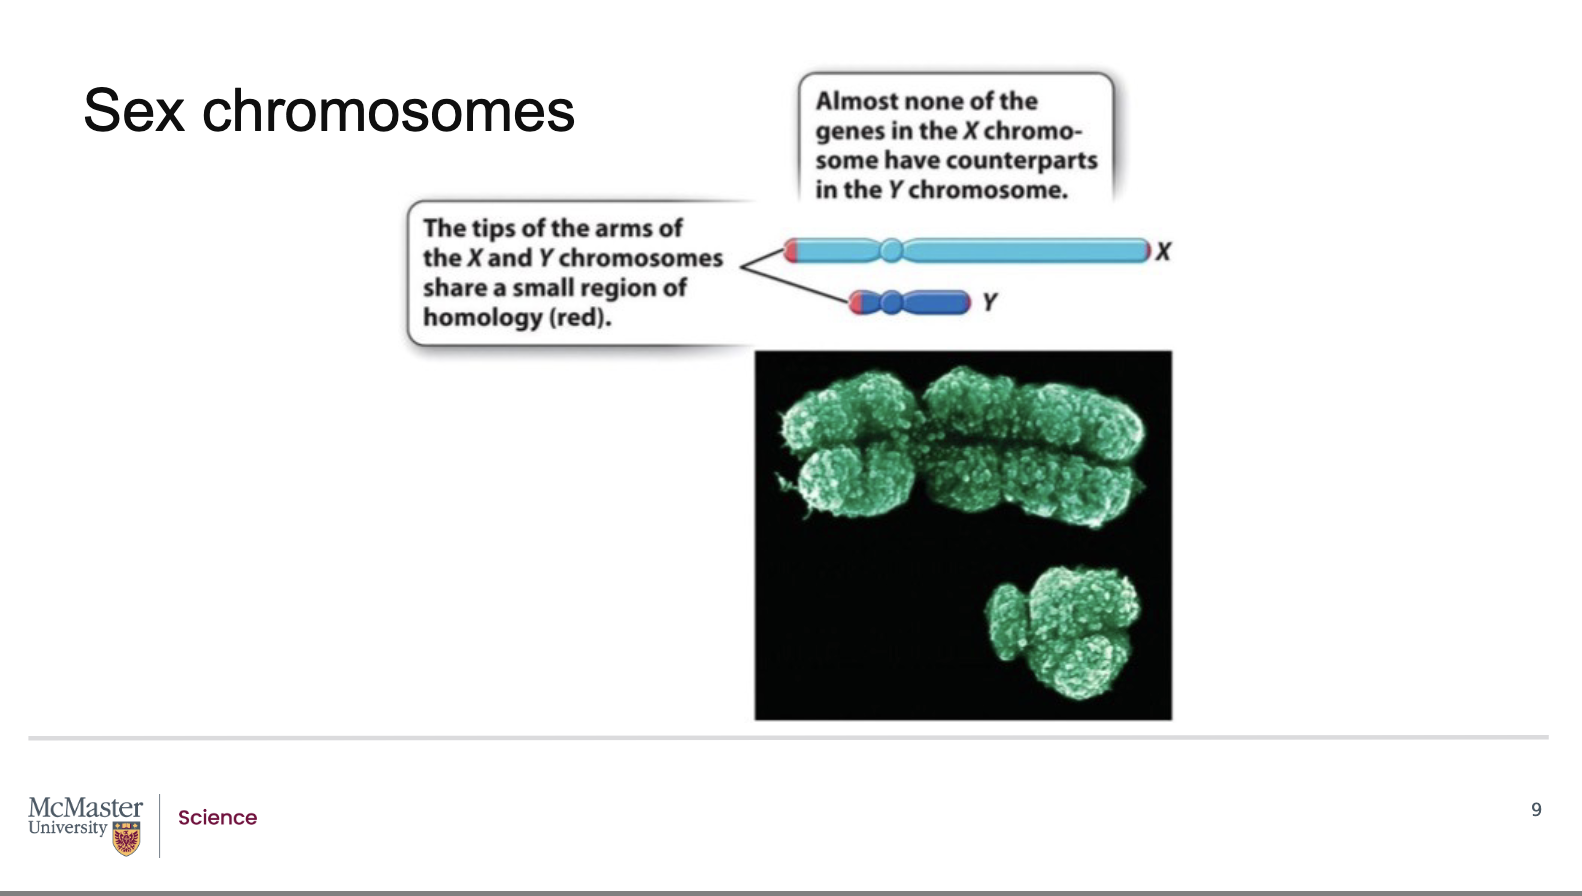
How are the X and Y chromosomes different in terms of genes and inheritance?
Back (Answer):
Most regions of the X and Y chromosomes are non‑homologous
They do not share matching genes
Therefore, recombination usually does not occur
Only small regions at the tips of X and Y:
Allow pairing and proper segregation during meiosis
Y chromosome:
Contains 78 genes
Codes for about 25 proteins
About half of these genes are involved in sex determination
X chromosome:
Contains about 1100 genes
Most genes have functions unrelated to sex
A gene located on the X or Y chromosome is called a sex‑linked gene
Expression of the trait may depend on the sex of the individual
🧠 Key idea to remember:
X has many genes, Y has few; sex‑linked traits depend on sex.

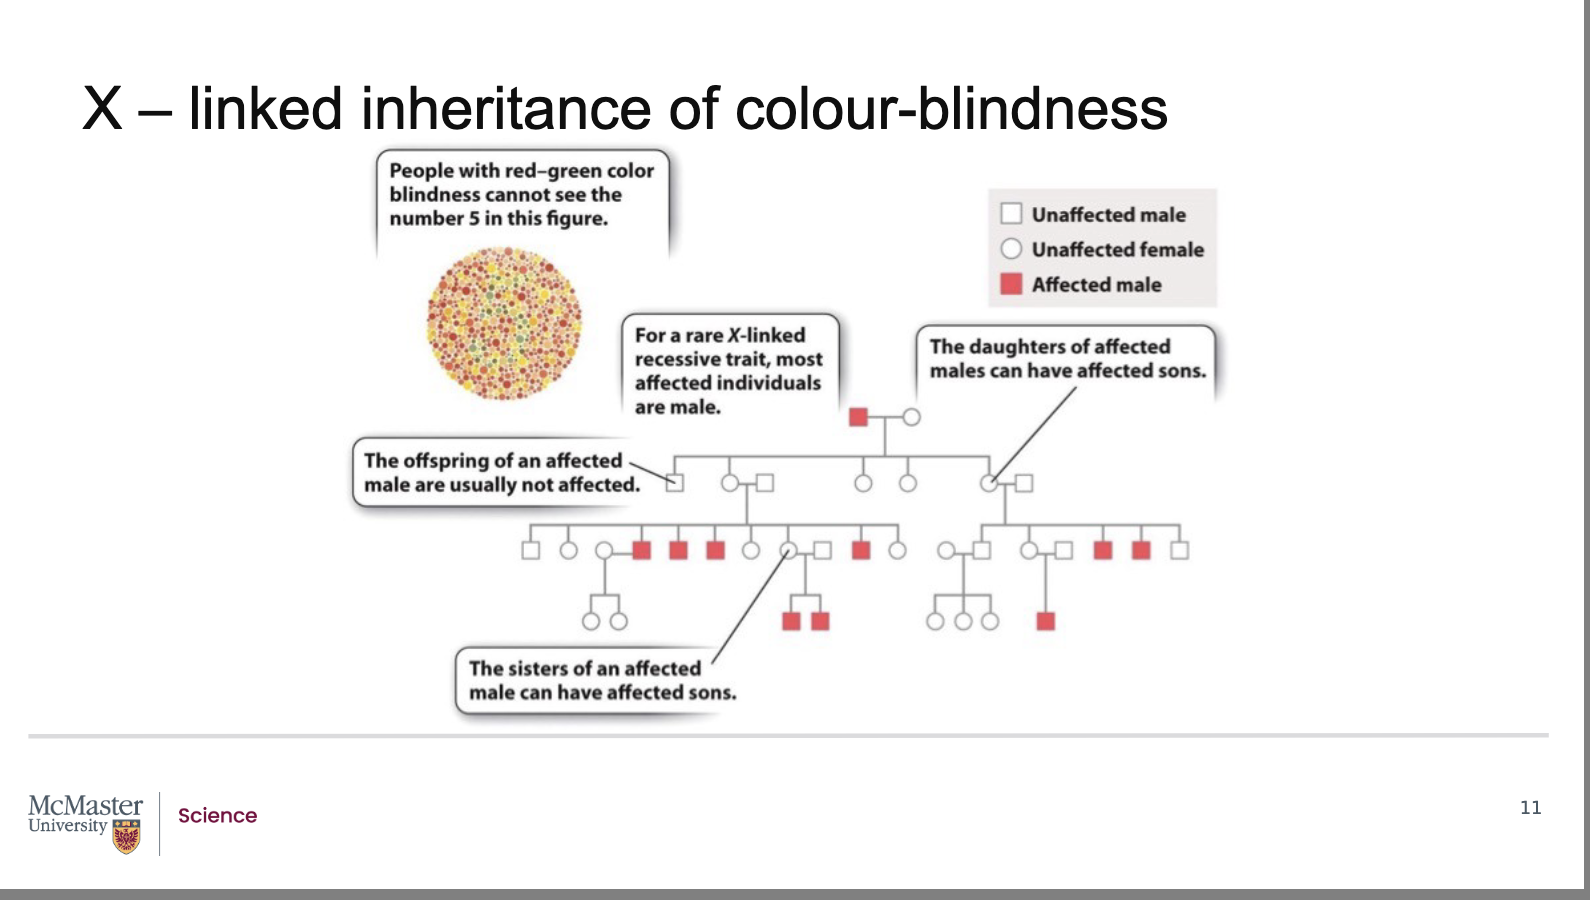
How is red/green colour‑blindness inherited in humans?
Back (Answer):
Red/green colour‑blindness is:
A recessive
X‑linked trait
Caused by a gene located on the X chromosome
Scientists track this inheritance using human pedigrees:
Follow traits from grandparents → parents → children
Can span multiple generations
Testing method: Ishihara colour test
Made of circles with coloured dots
Dots form numbers (e.g., 5)
Clearly visible to people with normal colour vision
Hard or impossible to see for colour‑blind individuals
🧠 Key idea to remember:
Red/green colour‑blindness is a recessive X‑linked disorder tracked using pedigrees and tested with Ishihara plates.
Why does X‑linked colour‑blindness affect males more often than females?
Back (Answer):
Females (XX):
Must be homozygous recessive to be colour‑blind
Heterozygous females are carriers
Carriers do not show the phenotype
Can pass the allele to their children
Males (XY):
Have only one X chromosome
If they inherit the recessive allele from their mother,
They will be colour‑blind
Males are called hemizygous:
Only one allele at the X‑linked locus
No second allele to mask its effect
In hemizygous individuals:
Rules of dominance vs. recessiveness do not apply
The single allele is always expressed
🧠 Key idea to remember:
Males are hemizygous for X‑linked genes, so one recessive allele is enough to show the trait.

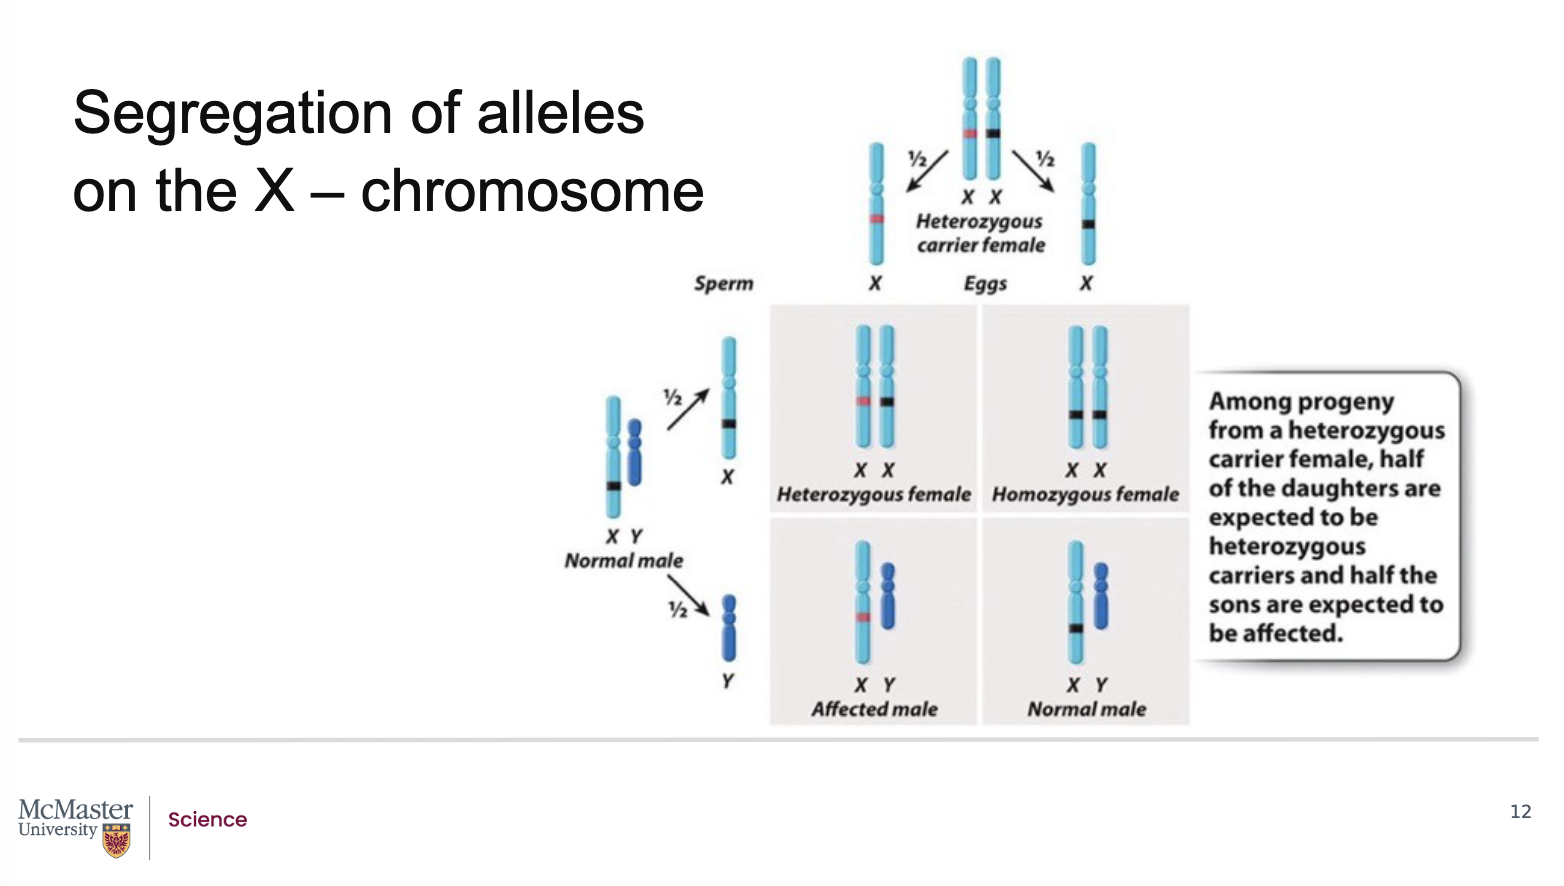
What is the probability of passing on the colour‑blindness allele from a carrier female?
Back (Answer):
Colour‑blindness follows Mendelian inheritance
A carrier female has:
One normal X chromosome
One X chromosome with the affected (colour‑blindness) allele
Because the trait is recessive:
She is not colour‑blind
She carries the allele
Each child has:
50% chance of inheriting the affected allele
50% chance of inheriting the normal allele
This 50% chance applies to all offspring, regardless of sex
🧠 Key idea to remember:
Carrier mothers pass the affected X allele to half of their children.
How does inheriting the colour‑blindness allele affect male vs. female offspring?
Back (Answer):
Males (XY):
Are hemizygous for X‑linked genes
Show the phenotype of the single X chromosome they receive
If they inherit the affected allele → they will be colour‑blind
Females (XX):
Can inherit the affected allele with 50% probability
If heterozygous:
They will not be colour‑blind
They become carriers
Punnett squares help visualize:
Affected males
Carrier females
Dominance rules do not apply in hemizygous males
🧠 Key idea to remember:
Affected X → colour‑blind males; carrier females do not show the trait.
Given the principles of Mendelian inheritance, there
is a 50% chance of passing on the allele that
determines colour-blindness. Consider the case of a
female with one X chromosome having the affected
allele (indicated by the red line in the figure) and one
X chromosome with the normal allele (indicated by
the black line). Because it is a recessive trait, she is
not colour blind but is a carrier for colour-blindness
and there is a 50% chance of her offspring inheriting
either the normal or affected allele. Because males
are hemizygous for genes on the X chromosome, they
will show the phenotype of the X chromosome
received from the mother. Using a Punnett square,
we can see that a male offspring that inherits the
affected allele will be colour blind. Female offspring
can inherit the affected allele, with a 50% probability,
but will not show the phenotype but will again be
carriers of it

How do carrier females contribute to the inheritance of X‑linked recessive traits, and how are they identified in pedigree?
Back (Answer):
In pedigrees, it is possible to trace females who do not show a phenotype but still carry a recessive allele
These females are heterozygous:
One normal X chromosome
One X chromosome carrying the recessive allele
Because the trait is X‑linked recessive:
A single normal allele masks the recessive allele
The female does not express the disorder
Even though they are unaffected, carrier females:
Can pass the affected allele to their children
Have a 50% chance of passing the recessive allele to each son
Sons who inherit the affected X chromosome:
Are hemizygous
Will express the disorder because they have no second X chromosome
Pedigrees allow scientists to:
Track these silent carriers across multiple generations
Predict inheritance patterns based on Mendelian principles
Key takeaway:
Carrier females play a critical role in maintaining and transmitting X‑linked recessive traits within families, even when they appear unaffected.
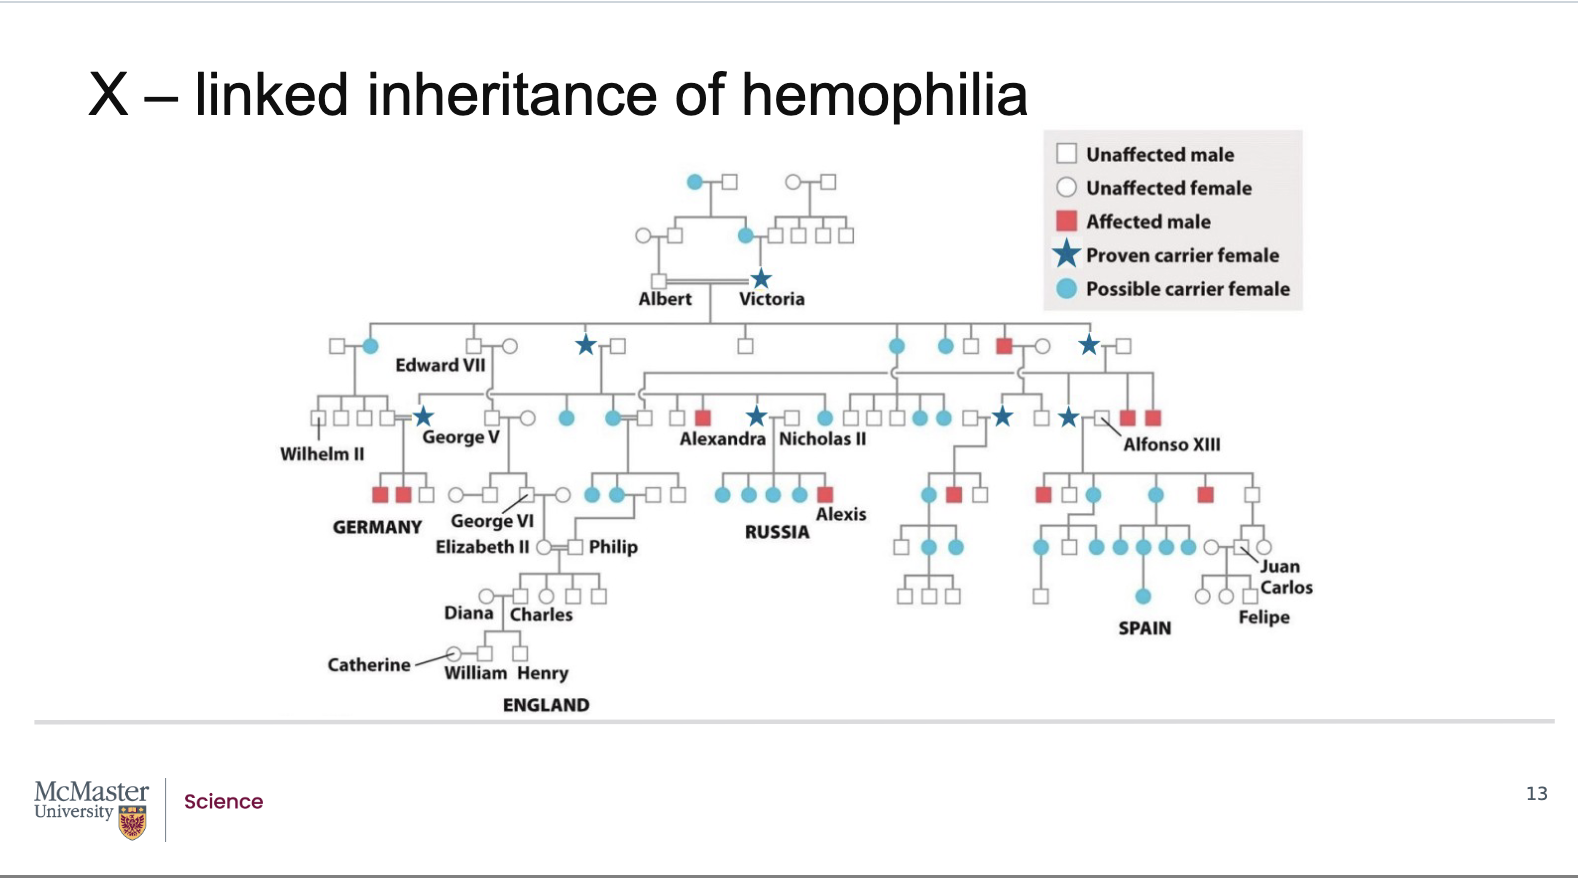
What is haemophilia, and how does it demonstrate X‑linked recessive inheritance through pedigrees?
Back (Answer):
Haemophilia is a blood‑clotting disorder
It is caused by:
A mutation in a gene that encodes a protein required for normal blood clotting
This mutation leads to:
Inability to clot blood properly
Increased risk of excessive or uncontrolled bleeding
Haemophilia is inherited as an X‑linked recessive trait
Historical example:
Queen Victoria was a carrier of the haemophilia allele
She did not show symptoms
She had a son affected by haemophilia
This occurred because:
She passed her affected X chromosome to her son
The son was hemizygous and expressed the disorder
In pedigrees:
Carrier females are often indicated separately
Affected males appear more frequently than affected females
These inheritance patterns follow:
The same Mendelian rules seen with other X‑linked recessive traits, such as colour‑blindness
Key takeaway:
Haemophilia clearly shows how X‑linked recessive disorders can be passed through unaffected carrier females and appear primarily in males.

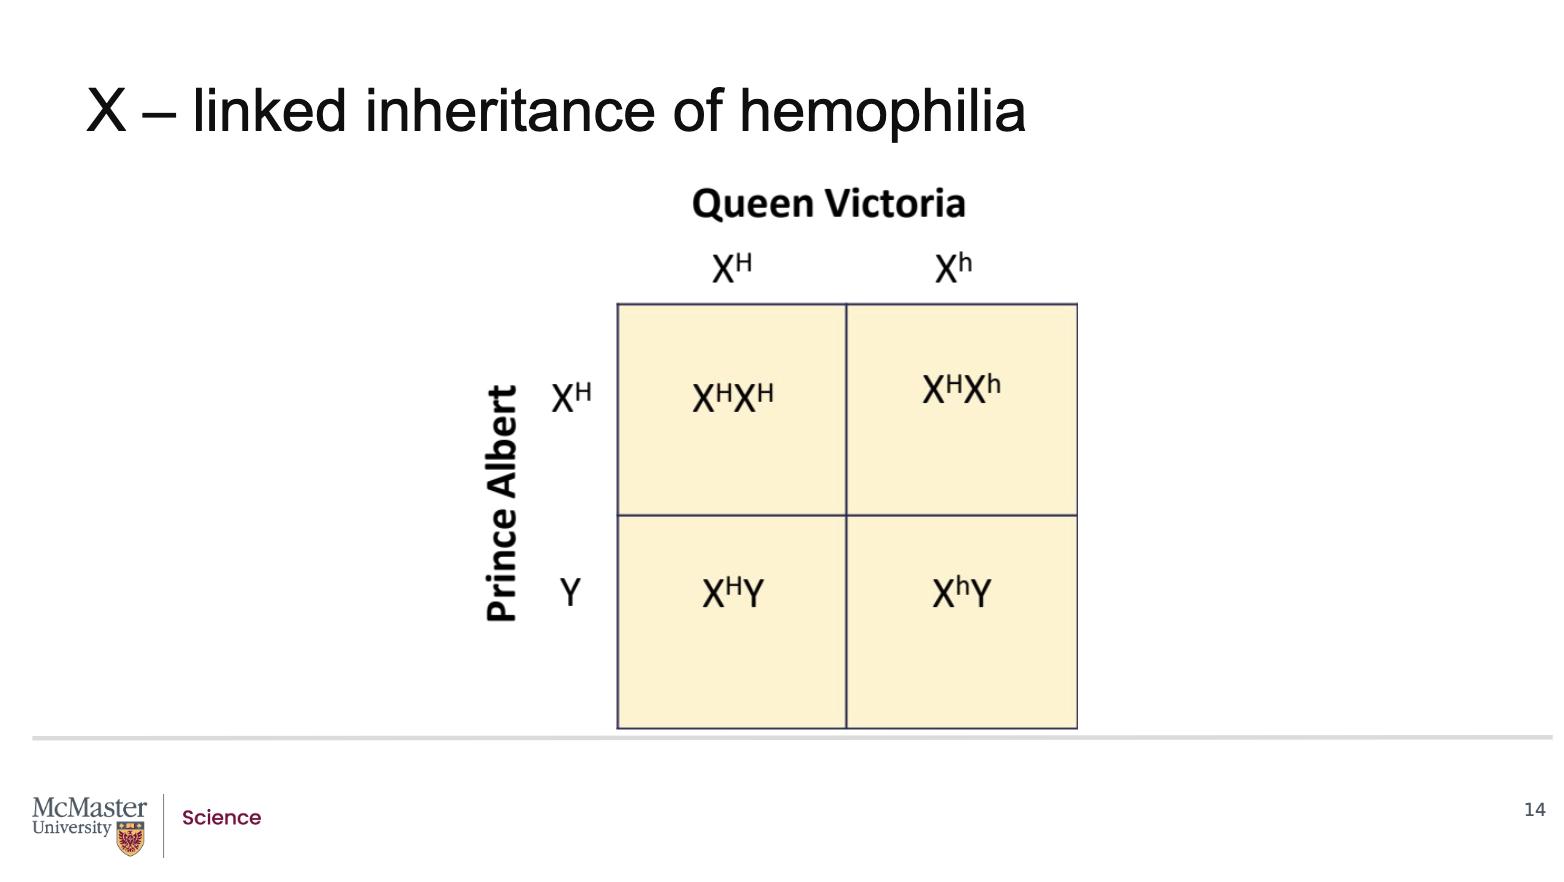
What does the Punnett square reveal about the inheritance of haemophilia in the children of Queen Victoria and Prince Albert?
Back (Answer):
Haemophilia is an X‑linked recessive disorder
Queen Victoria was a carrier for the haemophilia allele:
One normal X chromosome
One X chromosome with the mutant haemophilia allele
Prince Albert was unaffected:
He carried a normal X chromosome and a Y chromosome
A Punnett square analysis shows the following outcomes for their children:
Female offspring (XX):
50% will inherit the normal X from Queen Victoria and be completely normal
50% will inherit the affected X and be carriers
None are expected to be affected
Male offspring (XY):
50% will inherit the normal X and be unaffected
50% will inherit the affected X and will have haemophilia
These ratios follow Mendelian inheritance principles for X‑linked recessive traits
Key takeaway:
When a carrier female mates with an unaffected male, half the sons are affected and half the daughters are carriers.
Front (Question):
Why is haemophilia rare in females, and why is it no longer present in the modern British royal family?
Back (Answer):
For a female to be affected by haemophilia, she must:
Inherit an affected X chromosome from her mother
And an affected X chromosome from her father
This scenario is rare because:
Affected males often have reduced survival or reproduction
Females are usually carriers, not affected
Although haemophilia became well known due to its presence in European royal families, it is no longer found in the current British royal line
This is because:
The present royal family descends from King Edward VII
King Edward VII was a son of Queen Victoria
He was not affected by haemophilia
Therefore, he did not carry the mutant allele
Because he lacked the allele:
He could not pass it on to his children
The mutant allele was eliminated from that lineage
This demonstrates how X‑linked recessive alleles can:
Persist for generations through carriers
Be lost entirely if not transmitted further
Key takeaway:
Haemophilia disappeared from the British royal family because the unaffected male lineage no longer carried the mutant X‑linked allele.

Does Mendel’s second law of independent assortment always apply to all genes?
Back (Answer):
Mendel’s second law of inheritance states that:
Alleles of different genes assort independently during gamete formation
This law assumes that genes:
Are located on different chromosomes, or
Are far enough apart on the same chromosome
This raises an important question:
What if two genes are physically located close together on the same chromosome?
Genes that are physically attached to the same chromosome may:
Not assort independently
Be inherited together more often than expected
Such genes are referred to as linked genes
Therefore:
Mendel’s second law is not always true
It must be modified to account for gene linkage
Key takeaway:
Independent assortment applies only when genes are not physically linked on the same chromosome.
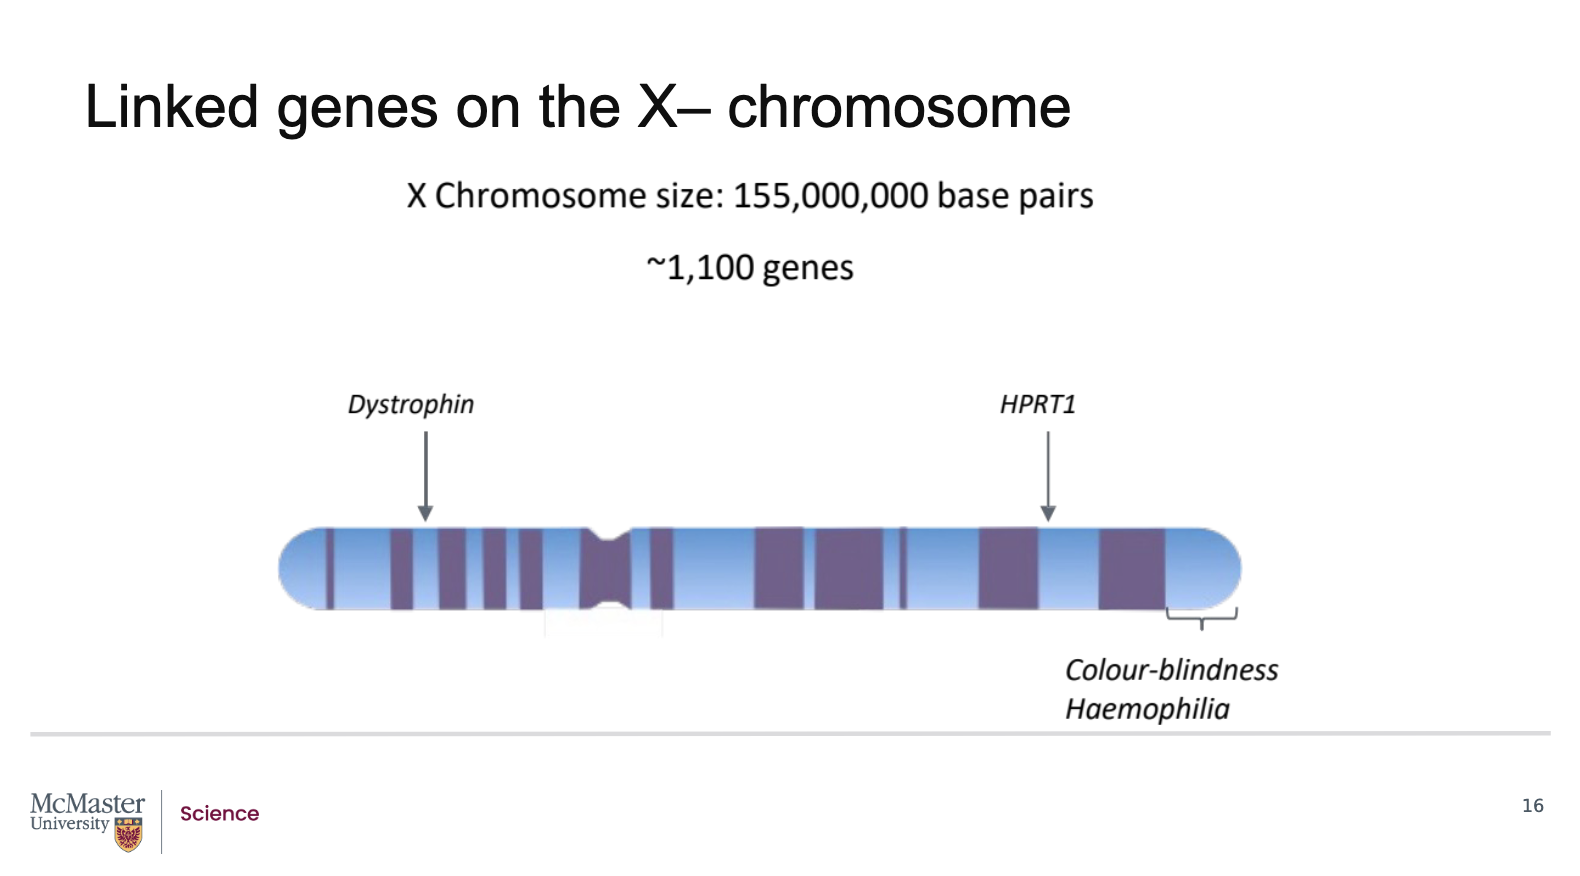
What evidence shows that some genes on the human X chromosome are linked?
Back (Answer):
In human females, the two X chromosomes pair during prophase I of meiosis I
Each X chromosome:
Is approximately 155 megabases (155 million base pairs) in length
Contains about 1100 genes
The X chromosome has two regions:
p arm (short arm)
q arm (long arm)
Several important genes are located on these arms, including:
Dystrophin gene: codes for a protein required for muscle cell development
HPRT1 gene: mutations cause severe, recurring acute arthritis
Colour‑blindness‑associated genes
Haemophilia‑associated genes
Genes located close together on the same chromosome:
Are called linked genes
Tend to be inherited together
Do not segregate independently during meiosis
Colour‑blindness and haemophilia genes are an example of linked genes on the X chromosome
This leads to the final question:
Will linked genes always be inherited together, or can they sometimes be separated?
Key takeaway:
Genes that are close together on the same chromosome are linked and tend to be inherited together, challenging Mendel’s second law

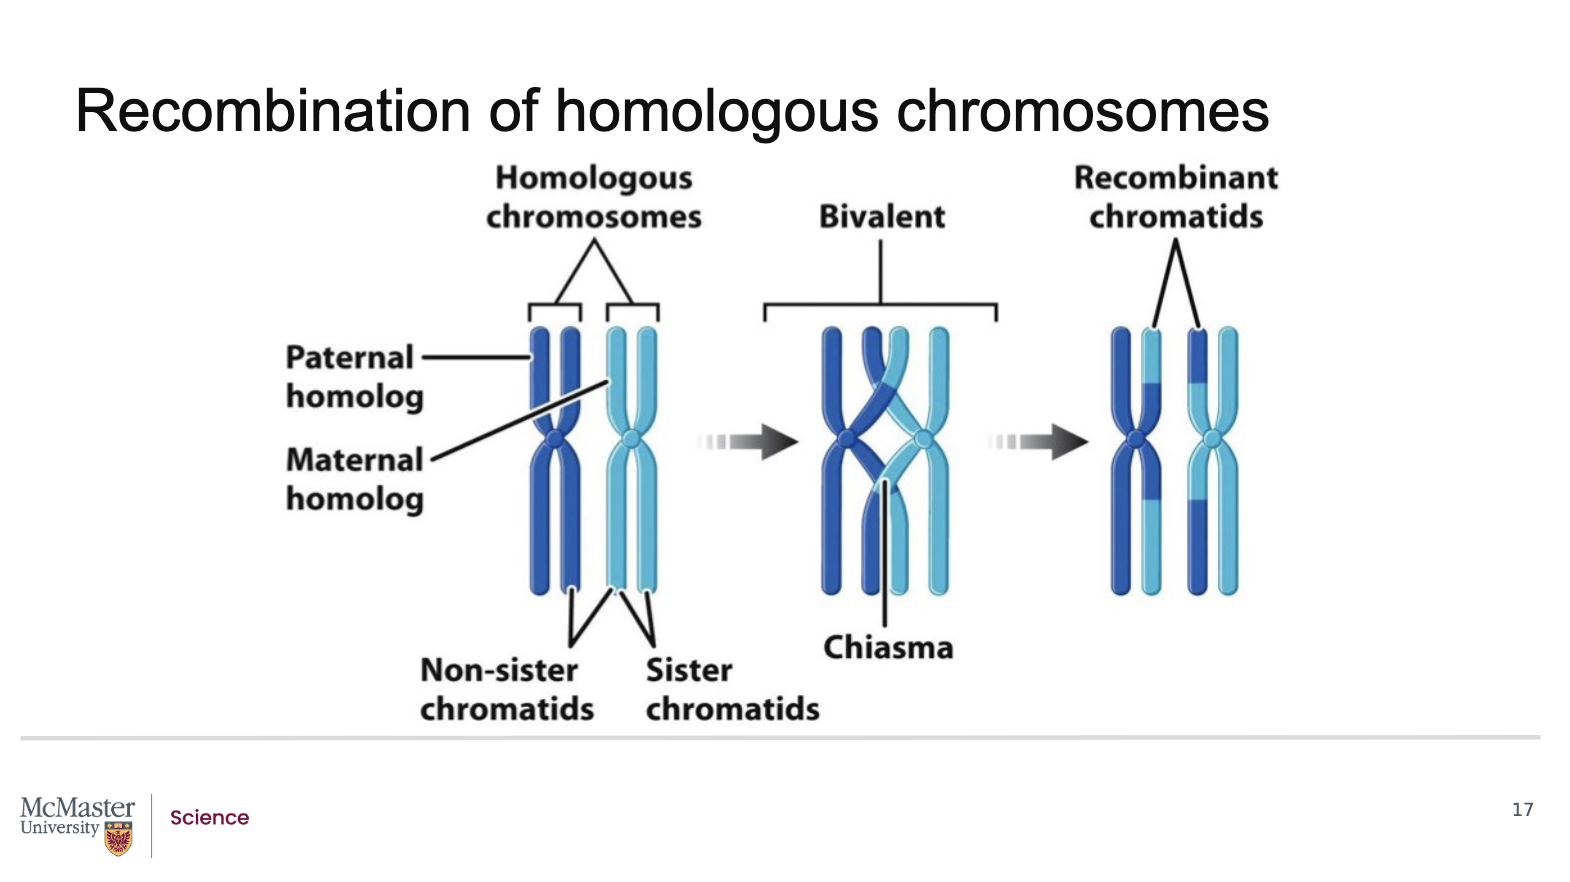
Will linked genes always be inherited together during meiosis?
No. Linked genes will not always be inherited together. In fact, the linkage can be broken. In prophase of meiosis, all homologous chromosome pairs line up beside each other and form chiasmata or crossovers. It is here that the linkage between neighbouring genes on a chromosome is broken. When alleles of neighbouring linked genes are separated from each other during recombination events in meiosis I during gamete formation, it is possible to see that what were once linked genes are inherited independently in subsequent offspring. As a result, some offspring may inherit only one of the genes due to these recombination events that occur between linked gene
Back (Answer):
No, linked genes are not always inherited together
Although linked genes are located close to each other on the same chromosome and tend to be inherited together:
Their linkage can be broken
This breaking of linkage occurs during meiosis, specifically:
Prophase I of meiosis I
During prophase I:
Homologous chromosomes pair up along their length
They form structures called chiasmata (points of crossing over)
At these chiasmata:
Physical exchanges of DNA occur between homologous chromosomes
These exchanges can separate alleles of genes that were previously linked
Key takeaway:
Gene linkage is not permanent; it can be disrupted by crossing over during meiosis.
How does recombination break gene linkage and change inheritance patterns?
Back (Answer):
Crossing over occurs during prophase I of meiosis
At this stage:
Homologous chromosomes exchange corresponding DNA segments
When a crossover occurs between two linked genes:
The alleles of those genes can be separated
This process is called genetic recombination
As a result:
Alleles that were previously inherited together may now be distributed into different gametes
This can lead to offspring that:
Inherit only one of the linked genes
Show inheritance patterns that resemble independent assortment
Therefore:
Linked genes can sometimes behave as if they are not linked, depending on where recombination occurs
Key takeaway:
Recombination during meiosis can separate linked genes, allowing them to be inherited independently in some offspring.

How does recombination affect linked genes, and why does the distance between genes matter?
Back (Answer):
During recombination, the physical position of genes on the chromosome does not change
What changes is:
The association of alleles carried on each chromatid
If two linked genes are far enough apart on a chromosome:
A crossover occurring between them can separate their alleles
This produces recombinant chromatids with new allele combinations
If two linked genes are very close together or immediately adjacent:
Crossovers are unlikely to occur in the region between them
Even if crossing over occurs elsewhere on the chromosome, it will not separate these genes
As a result:
Closely linked genes show little or no recombination
More distant linked genes show higher recombination frequency
Key takeaway:
The farther apart two genes are on a chromosome, the more likely recombination will separate their alleles.

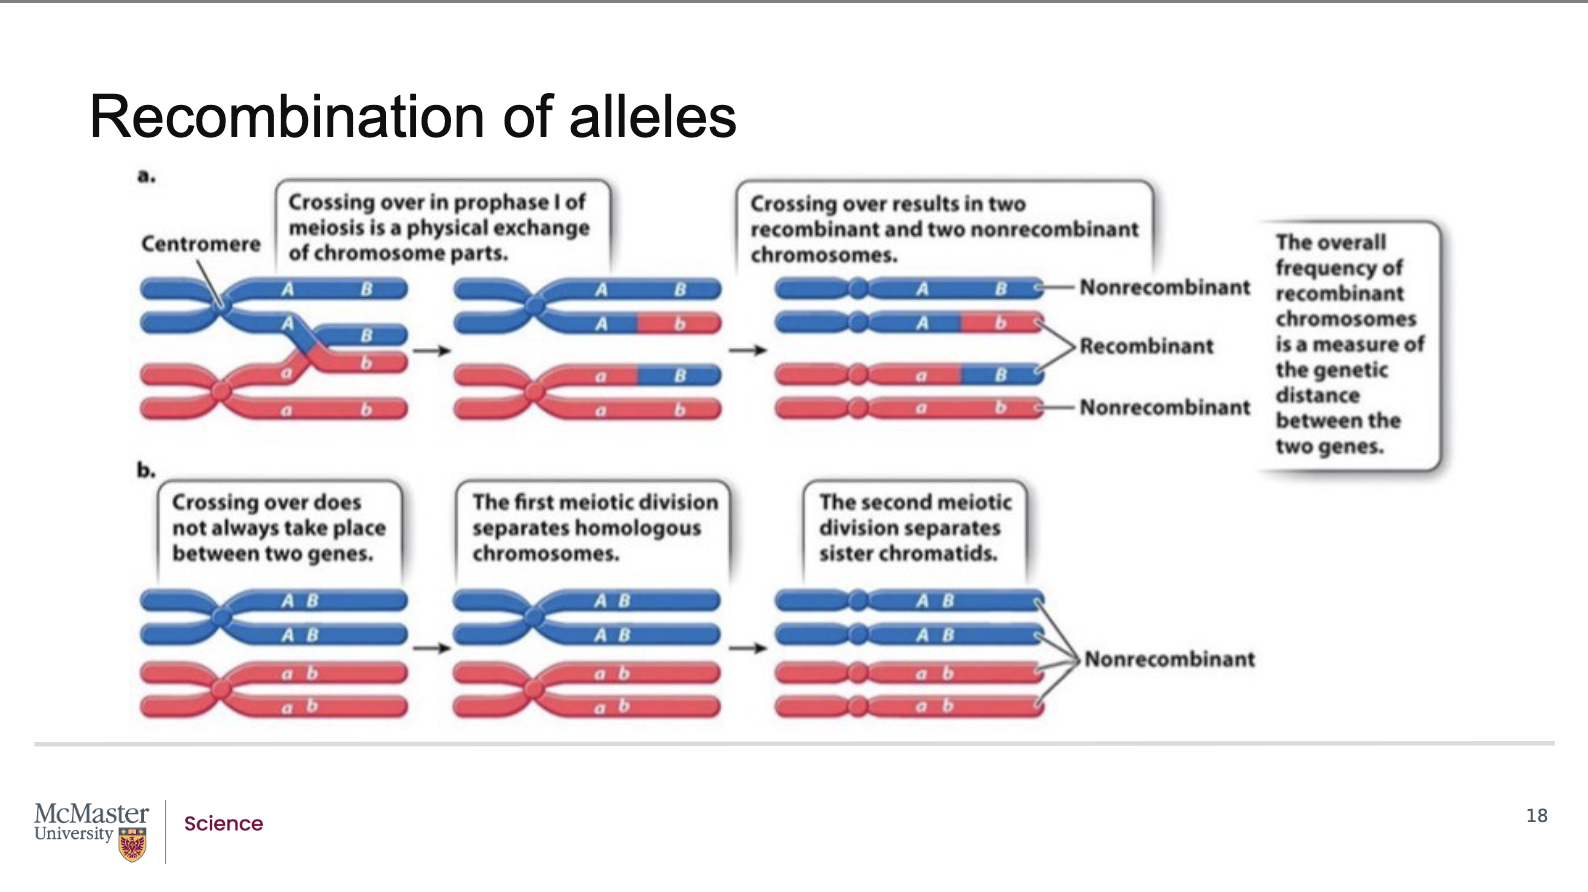
How does crossing over generate recombinant allele combinations using genes A and B as an example?
Back (Answer):
Consider two homologous chromosomes carrying genes A and B:
One chromosome has A B
The homologous chromosome has a b
These original allele arrangements are called parental (non‑recombinant) combinations
If a crossover occurs between genes A and B during meiosis I:
Alleles are exchanged between homologous chromatids
This produces four possible gamete types:
Parental (non‑recombinant):
A B
a b
Recombinant:
A b
a B
If genes A and B are very close together:
Crossovers are unlikely to occur between them
Recombinant gametes are rare or absent
Only parental combinations are usually produced
This principle allows geneticists to:
Use recombination frequency as a tool
Estimate the distance between genes on the same chromosome
Genes with low recombination frequency are close together
Genes with high recombination frequency are farther apart
Key takeaway:
Recombination frequency reflects gene distance and can be used to map genes along a chromosome.
During recombination of alleles, the position of genes
does not change, but the relative association of
alleles does. If the linked genes are far enough apart,
recombinant chromatids that carry alternate allele
combinations are generated during crossover events.
Consider the case of this sample set of two genes (A
and B), and the two homologous chromosomes that
carry different alleles of them. The chromosome from
one parent has big A big B and the chromosome from
the other parent has little a and little b. In the event
of a crossover occurring in the region between these
two genes the illustrated crossover would create the
recombinant gametes containing big A, little b and
little a, big B in addition to the parental non-
recombinant big A, big A and little b, little b allele
combinations. However, if the linked genes are
immediately adjacent to each other with very little
distance in between, there would be no crossing over
during meiosis I or any crossovers that did occur
would not be in the region between these two genes.
As a result, there would be no recombination of
alleles, and we would expect little or no cross-over
between these two genes, although a crossover is still
possible in other regions of the chromosomes. What
can we do with this information? Since the
recombination between linked genes is dependent on
the distance between them, genes that are closer
together show less recombination frequency than
genes that are located far apart from each other.
Recombination frequency is a convenient tool that
can be used to determine the distance between
genes along the same chromosome
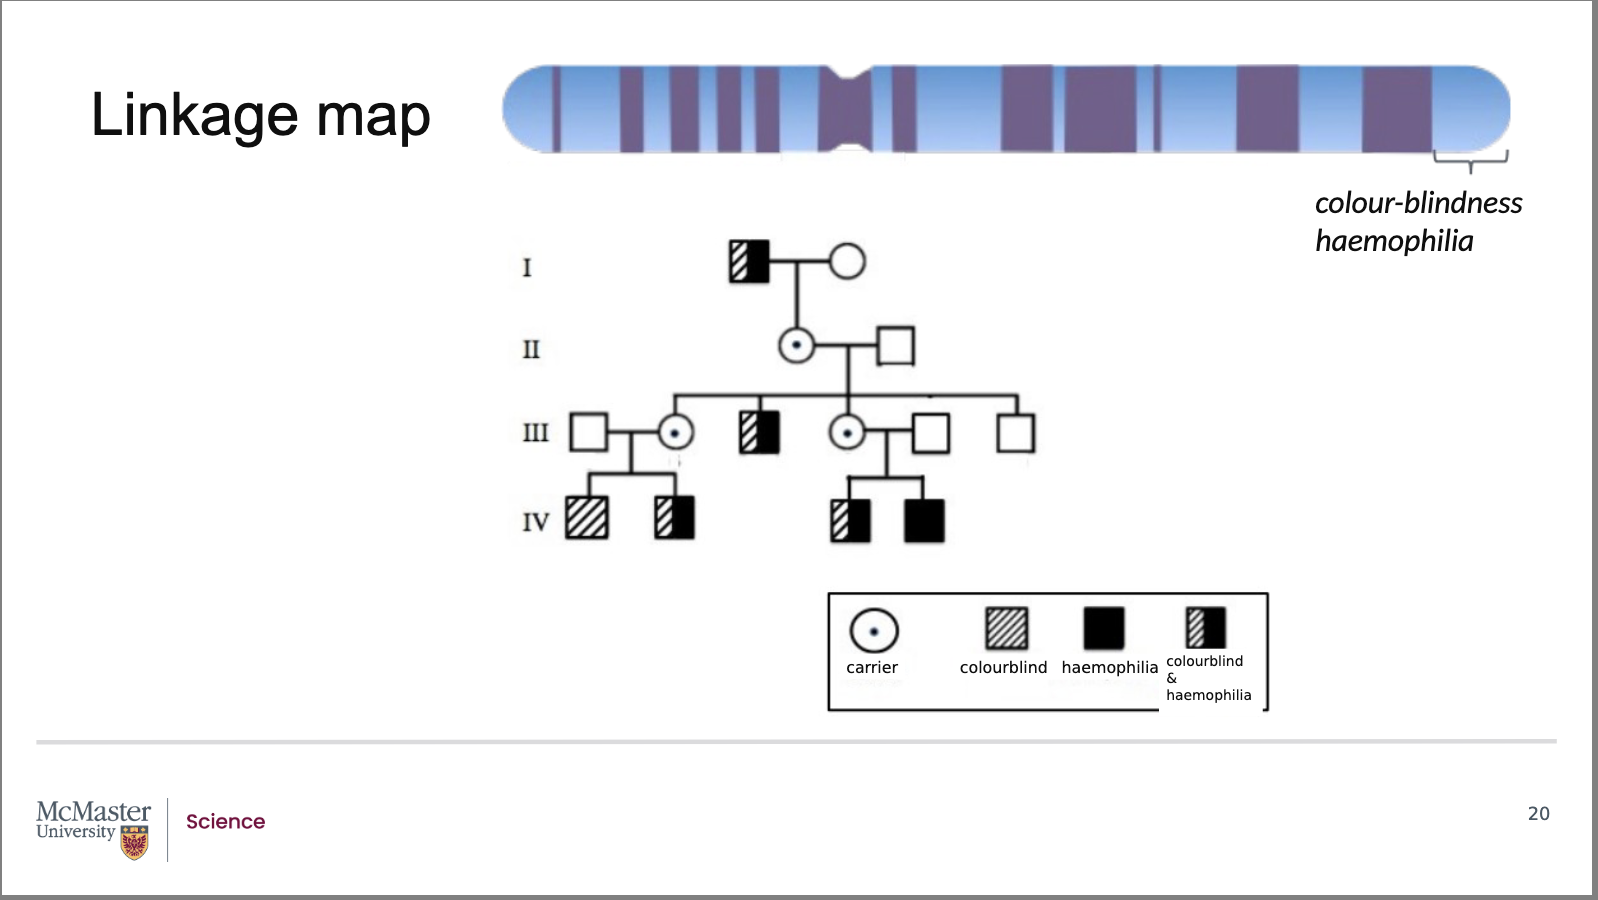
How does this pedigree demonstrate linkage and recombination between the colour‑blindness and haemophilia genes?
Back (Answer):
Genes that are in close proximity on the same chromosome tend to be inherited together
In this pedigree:
The inheritance of colour‑blindness and haemophilia generally occurs together
This indicates that the genes for these traits are linked on the X chromosome
Based on linkage:
If a person inherits one trait, they are expected to inherit the other
An important exception is observed:
An individual in generation IV has only haemophilia, not colour‑blindness
This outcome is unexpected because:
The individual’s mother was a carrier for both traits
Linkage would predict inheritance of both alleles together
The separation of these traits is explained by:
Crossing over (recombination) during meiosis
A crossover occurred between the haemophilia and colour‑blindness genes
This recombination event separated the alleles, allowing:
One gene to be inherited without the other
Key takeaway:
Pedigrees can reveal rare recombination events where linked genes are separated by crossing over.

How does recombination frequency allow scientists to determine gene distance and create linkage maps?
Back (Answer):
Recombination frequency measures how often linked genes are separated by crossing over
Individuals with unexpected trait combinations:
Are called recombinant individuals
Indicate that recombination has occurred between linked genes
The frequency of these recombinant individuals:
Reflects the distance between genes
Higher frequency means genes are farther apart
Lower frequency means genes are closer together
This information allows researchers to construct a linkage map
A linkage map:
Shows the relative distance between genes on a chromosome
Shows the order of genes along the chromosome
Analysis of this pedigree, along with many others, shows that:
The colour‑blindness and haemophilia genes are approximately 12 map units (12 centimorgans) apart
This corresponds to about 12 million base pairs of DNA
This distance is:
Large enough for crossing over to occur
Small enough that the genes are still considered linked
Key takeaway:
Recombination frequency is a powerful tool for mapping gene location and distance along chromosomes.
Genes that are in close proximity to each other on the
same chromosome are inherited together. Examining
this pedigree on the inheritance and segregation of
the colour-blindness and haemophilia traits through a
family shows us that these two traits are linked. But
note the exception in the individual with only
hemophilia in generation IV. Linkage between the
gene for haemophilia and colour-blindness would
lead to the prediction that these two genes should be
inherited together, especially since that male’s
mother was a carrier for both. The fact that they are
not in these individuals is explained by the fact that
the separation of these alleles must have occurred by
crossing over or recombination of alleles. The
frequency of these types of exceptions can certainly
tell us something about the distance between genes.
The relative distance between genes on a
chromosome then allows researchers to create a
linkage map. A linkage map will show not only the
distance between chromosomes, but can also show
the order of genes along the chromosome. Looking
at this pedigree and considering the relative
frequency of recombinant individuals (in accordance
with many other pedigrees), it has been found that
the colour-blindness and haemophilia genes are
roughly 12 map units (or centimorgan) apart on the X
chromosome. This is about 12 million base pairs
apart. As a result, this distance is large enough for
crossing over to occur between these two gene
How do high‑density linkage maps using SNPs help identify human disease genes?
Linkage maps for human genes are useful, but as we
just saw, genes can lie millions of base pairs apart and
we need to be able to visualize a phenotype such as a
disorder in order to identify alternate alleles. This
makes these linkage maps impractical for human
applications.
Back
Traditional linkage maps are impractical in humans because genes can be millions of base pairs apart and phenotypes are hard to visualize.
High‑density linkage maps use SNPs and other non‑coding markers spaced only thousands of base pairs apart.
High-density linkage maps identify genetic loci that are merely a few thousand base pairs apart.
Having a map of SNPs in non-coding regions of the genome may not seem
useful, but these linkage maps can then be used to map human genes that determine various characteristics. The principle is the same as before. We are looking at the frequency of recombination to determine the relative distance between two genetic loci, whether they are genes, markers, or a gene and a marker
Even though SNPs are non‑coding, they can be used to track nearby genes through recombination frequency.
Recombination frequency shows distance:
High recombination (≈50%) → loci far apart → unlinked
Low recombination (<50%) → loci close together → linked
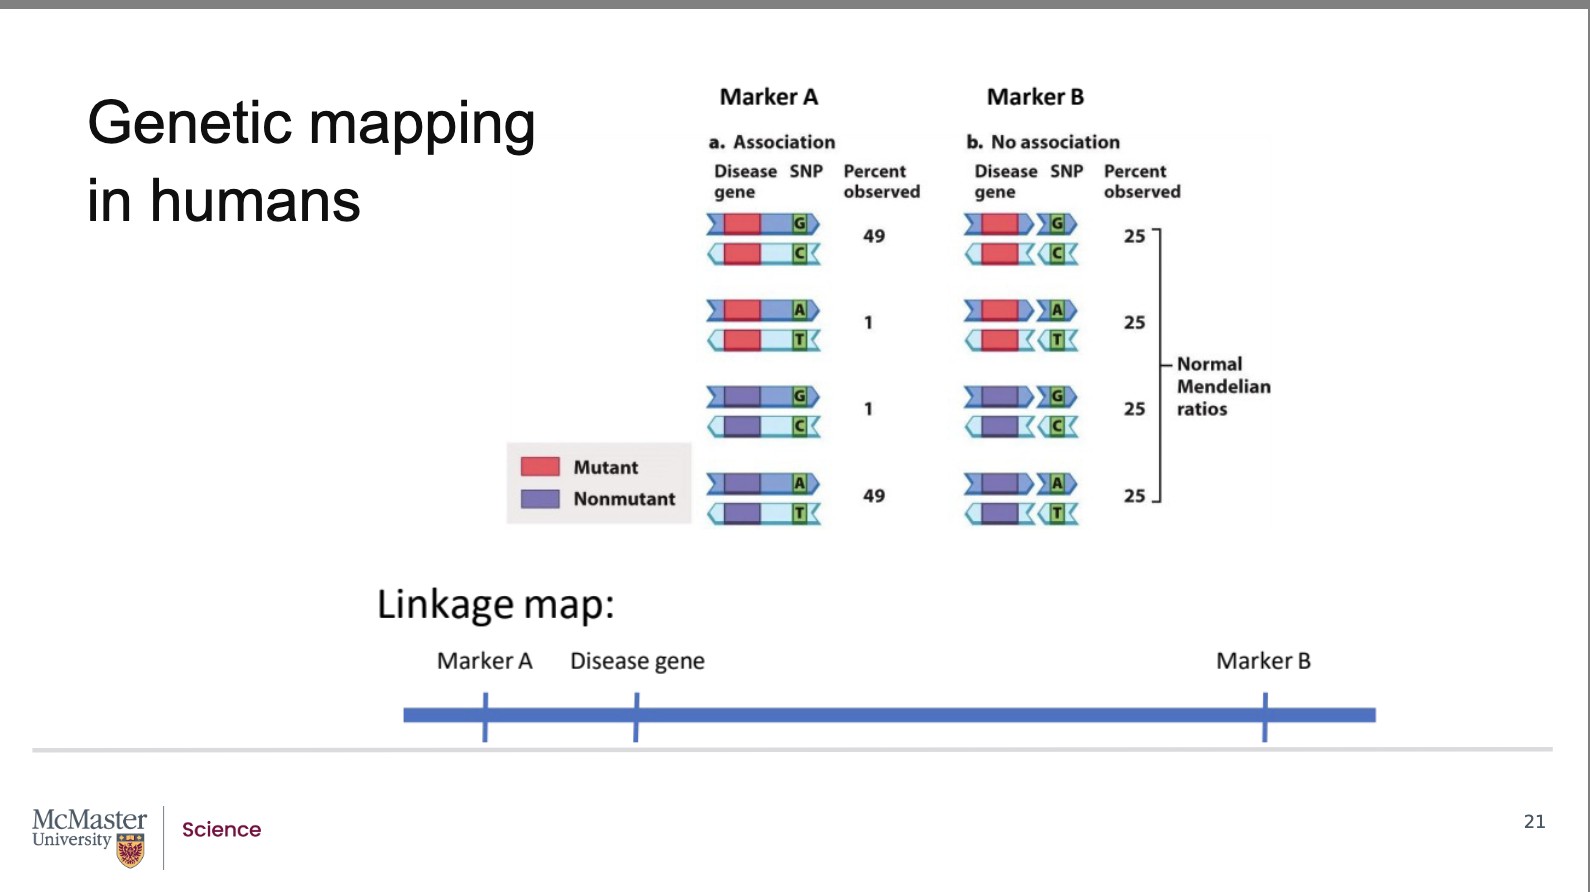
Marker B (far from disease gene):
All four allele combinations occur 25% each
No association → unlinked
Marker A (close to disease gene):
Mutant + G‑C and non‑mutant + A‑T occur ~49% each
Recombination is rare → linked
Because SNP locations are known, linkage to markers reveals the approximate location of the disease gene.

Why are traditional linkage maps impractical for human gene mapping, and what is used instead?
Back:
In humans, genes can be millions of base pairs apart, and phenotypes (like disorders) must be observed to identify alternate alleles.
This makes traditional linkage maps impractical for human applications.
Instead, scientists use high‑density linkage maps built from millions of SNPs and other non‑coding markers.
These markers are only a few thousand base pairs apart, providing much finer resolution than gene‑only maps.

How do SNPs in non‑coding regions help map human genes?
Back:
Although SNPs are in non‑coding regions, their positions in the genome are known.
High‑density linkage maps use these SNPs to identify genetic loci located close together.
The same principle as classic linkage mapping applies:
Scientists examine recombination frequency.
Lower recombination frequency means loci are closer together.
These maps can locate genes responsible for human traits or diseases, even if the markers themselves have no function.

How does recombination frequency show whether a disease gene is linked to a genetic marker?
Back:
The disease gene has two alleles: mutant and non‑mutant.
The marker also has two alleles: G‑C or A‑T.
Marker B (far from disease gene):
Recombination always occurs between them.
All four allele combinations appear 25% of the time.
There is no association → marker B and the disease gene are unlinked.
Marker A (close to disease gene):
Recombination is rare.
Mutant + G‑C and non‑mutant + A‑T appear ~49% each.
Unequal frequencies show linkage.
Because the marker’s genomic location is known, linkage reveals the approximate location of the disease gene.

How do high‑density SNP‑based linkage maps identify human disease genes using recombination frequency?
Back
Traditional linkage maps are impractical in humans because genes can be millions of base pairs apart, and identifying alleles requires visible phenotypes like disorders. Instead, scientists use high‑density linkage maps made from millions of SNPs and other non‑coding markers spaced only thousands of base pairs apart. High-density linkage maps identify genetic loci that are merely a few thousand base pairs apart. Although SNPs do not code for proteins, their genomic locations are known, allowing them to act as markers. Using the same principle as classic linkage mapping, recombination frequency is analyzed to estimate the distance between two loci (genes, markers, or a gene and a marker). A disease gene with mutant and non‑mutant alleles is compared to a marker with G‑C or A‑T alleles. When a marker (Marker B) is far from the gene, recombination always occurs, producing all four allele combinations equally (25%), indicating no association (unlinked). When a marker (Marker A) is close to the disease gene, recombination is rare, and parental allele combinations occur ~49% each, indicating linkage. Because marker positions are known, linkage reveals the approximate location of the disease gene.
How does recombination frequency show whether a disease gene is linked to a genetic marker (Marker A vs. Marker B)?
Back
The disease gene has two alleles: mutant and non‑mutant.
The marker also has two alleles: G‑C or A‑T.
Marker B (far from the disease gene):
The gene and marker are so far apart that recombination always occurs.
Marker alleles do not stay paired with specific gene alleles.
All four allele combinations appear in offspring at equal frequency (25% each).
This equal distribution shows no association → marker B and the disease gene are unlinked.
Marker A (close to the disease gene):
The marker is near the disease gene, so recombination is rare.
The mutant + G‑C and non‑mutant + A‑T combinations occur ~49% each.
Unequal allele frequencies indicate an association → marker A and the disease gene are linked.
Because marker locations are known from genome maps, linkage allows determination of the approximate location of the disease gene.
Above, the gene is represented by two alternate
alleles, a mutant and a non-mutant allele. The
marker is similarly represented by two alleles, a G-C
pair or an A-T pair. In image b, the gene is far away
from the marker, we will call this marker B. So far
away, that recombination will always occur in this
interval. As a result, the G-C marker allele does not
remain with the mutant allele and the A-T marker
allele does not remain with the G-C marker allele. We
see in the offspring, that the G-C allele is found with
the nonmutant alleles and that the A-T allele is found
with the mutant allele. Since we see all four of these
combinations of alleles with the same frequency, 25%
of the time each, we can say that there is no
association between the disease gene and marker B,
or they are unlinked. In contrast, in image a, we are
looking at a different marker, marker A. Here we see
that there is not an equal representation of the allele
combinations. The mutant allele with the G-C allele
and the nonmutant allele with the A-T allele occur
more frequently, 49% of the time each. This tells us
that recombination in between the disease gene and
marker A is rare and that the distance between these
two loci is relatively small. We can say that there is
an association between the disease gene and marker
A, of that they are linked. Since we know the exact
location of the markers from our human genome
maps, we now know the approximate location of the
disease gene

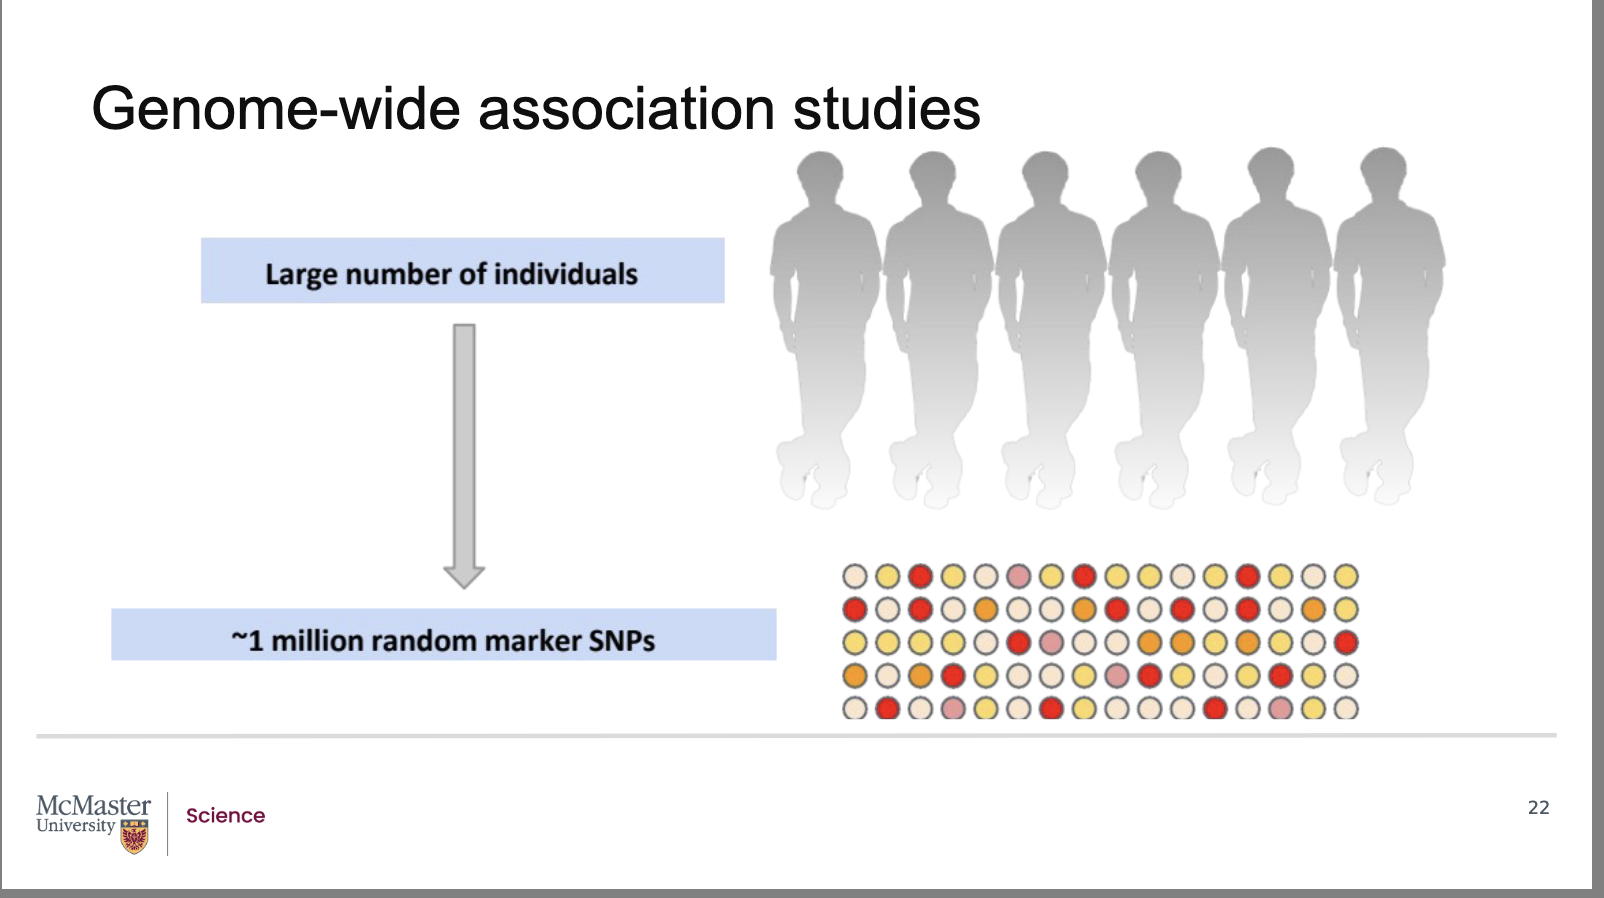
Why are Genome‑Wide Association Studies (GWAS) more powerful than pedigree analysis for mapping human genes?
Back:
Pedigree analysis is limited to a few hundred or thousand related individuals, restricting statistical power and genetic diversity.
With human SNP‑linkage maps and fast, inexpensive SNP genotyping, researchers can now analyze tens to hundreds of thousands of unrelated individuals.
A Genome‑Wide Association Study (GWAS) examines SNPs across the entire genome to find associations between specific SNP alleles and phenotypes.
Studying large, unrelated populations improves the ability to detect small genetic effects and increases mapping accuracy.
GWAS allows researchers to identify the genomic locations of genes influencing traits without requiring family ancestry data
Pedigree analysis limits our studies to a few hundred
or perhaps a thousand individuals that are related
through ancestry. With the advent of human SNP-
linkage maps and the technology to quickly and
cheaply identify SNPs, researchers are able to look at
tens of thousands or hundreds of thousands of
unrelated individuals in a population in order to map
the location of genes.

How does GWAS identify genes that contribute to human traits, illustrated by the HMGA2 height example?
Back:
GWAS detects statistical associations between a phenotype and specific SNP marker alleles.
Example: An association between human height and SNPs near the HMGA2 gene revealed its role in height variation.
HMGA2 has a small effect on height, contributing less than 1 cm of variation:
Individuals with two “C” alleles are 0.8 cm taller than individuals with two “T” alleles.
Heterozygous (C/T) individuals are 0.4 cm taller than individuals with two T alleles (intermediate effect).
This shows that many human traits are influenced by genes with small additive effects.
GWAS has been used to identify genes contributing to complex traits and diseases, including heart disease, cancer, and diabetes.
A Genome-Wide Association
Study (GWAS) looks across the entire SNP-linkage
map for an association between a particular
phenotype and a mapped SNP. For example, by
demonstrating an association between height and a
particular marker allele, researchers were able to
identify a gene that contributes to increased height in
humans. The gene, HMGA2 gene, contributes to less
than 1 cm variation in height. Individuals with two
“C” alleles of HMGA2 are 0.8cm taller than people
with two “T” alleles. Individuals heterozygous for the
“C” and “T” alleles are only 0.4cm taller than people
with the two “C” alleles. Such association studies
help researchers to identify genes that contribute to
various human characteristics including disease
phenotypes such as heart disease, cancer, and
diabetes