3.4 - Measures of Location
1/72
There's no tags or description
Looks like no tags are added yet.
Name | Mastery | Learn | Test | Matching | Spaced | Call with Kai |
|---|
No analytics yet
Send a link to your students to track their progress
73 Terms
Measures of Location
tell us the position of a score within a distribution
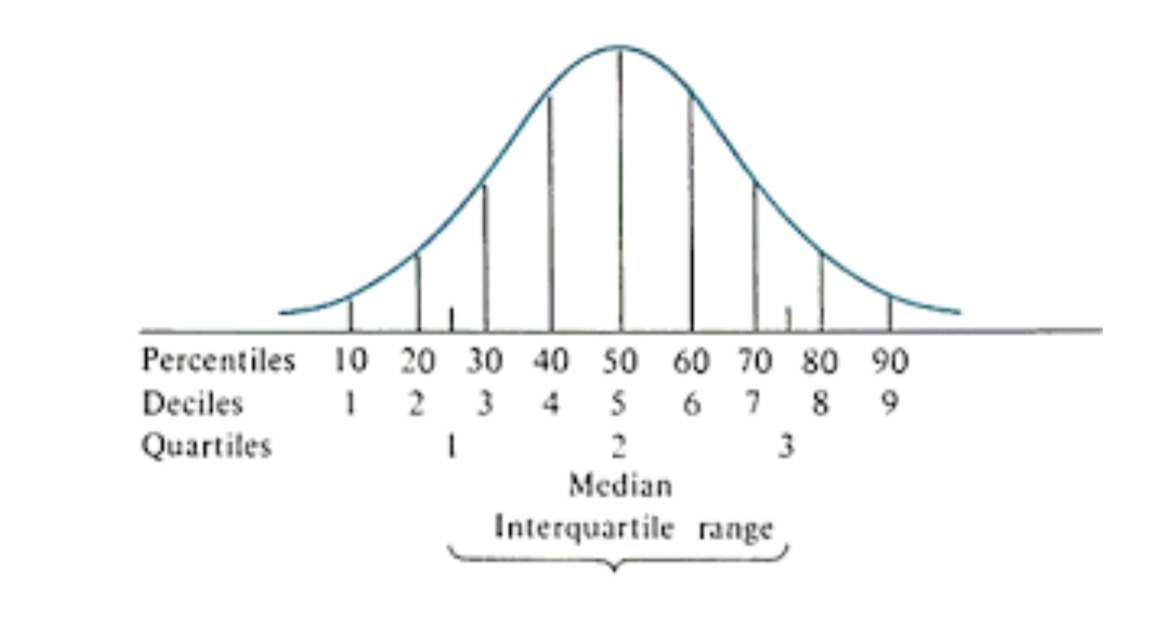
Percentile
Quartile
Decile/Sten
Measures of Location (3)
Percentile
divided the ordered observations into 100 equal parts
Quartile
three dividing points
Q1
25th Percentile
Q2
50th Percentile
Q3
75th Percentile
Decile
divide into 10 equal parts
Skewness
Kurtosis
Characteristics of DATA DISTRIBUTION (2)
Skewness
measures how asymmetric a distribution is around its mean.
Positively Skewed
Negatively Skewed
Skewness (2)
Positively Skewed
more test takers got low scores
difficult
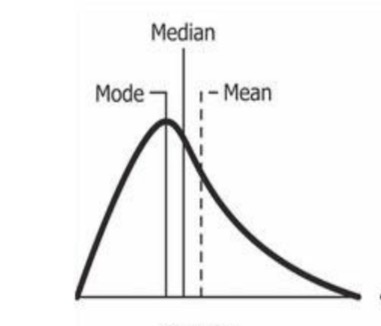
Positively Skewed
Mean>Median>Mode
Negatively Skewed
more test takers got high scores
easy
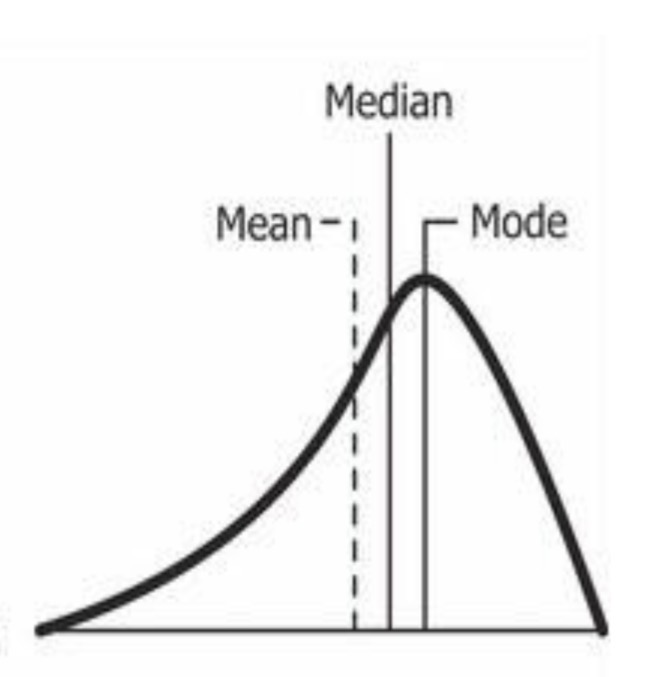
Negatively Skewed
Mode>Median>Mean
mean
To interpret the skewness, look at the tail. The ____ is the nearest to the tail
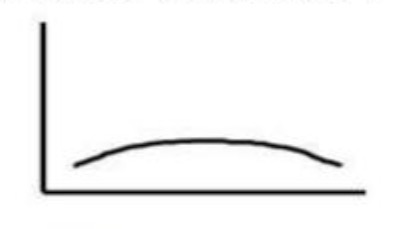
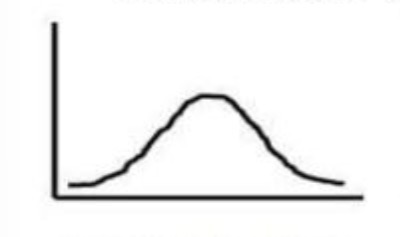
Kurtosis
refers to the “peakedness” of height of a distribution
Leptokurtosis
Platykurtosis
Mesokurtosis
Types of Kurtosis: (3)
Leptokurtic
tall & narrow peak | Less variation, scores cluster tightly around the mean, heavier tails |
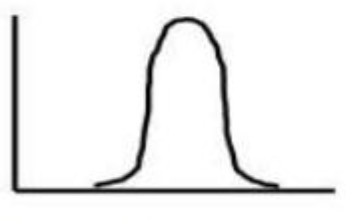
Platykurtic
flat & wide peak | Greater dispersion, scores spread out, lighter tails |
Mesokurtic
normal bell curve | Moderate peak & spread, standard normal distribution |
skewed
A curve is symmetrical if when folded into half, two sides coincide.
If curve is not symmetrical, curve is ____
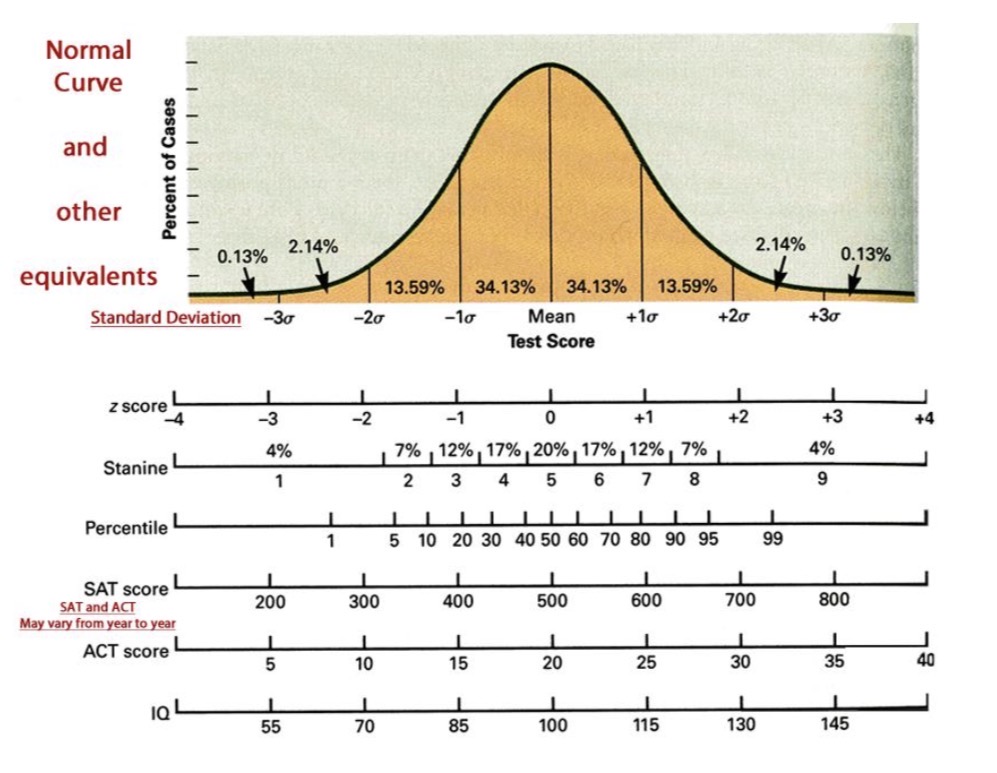
Normal Distribution
is a symmetric, bell-shaped distribution where:
Most scores cluster around the middle
Few scores are at the extremes
Normal Distribution
Mean = Median = Mode
Normal Distribution
Q1 AND Q3 have EQUAL DISTANCES TO THE Q2 (Median)
Standardized tests
_____ by nature are norm referenced
Norms
are established by administering the instrument to a standardization group and then referencing an individual’s score to the distribution of scores obtained in the standardization sample
Norms
are reference points that allow us to compare an individual’s score to a group
Norms
Establishing ___ (group data characteristics) allows us to compare an individual score with a comparison sample
Developmental Norms
Comparison of an individual’s score to the individual’s grade level or age group
Grade Equivalents
often used on educational achievement tests
to interpret how a student is progressing in terms of grade level
Age Comparisons
Refer to an individual being compared with others in his or her age group
Rank
A person’s ___ or standing within a group is the simplest norm-referenced statistic
with its interpretation based on the size and composition of the group
Rank
Used extensively for grades
Seldom used in describing psychological test results
Standard Scores
Score expressed as a distance
in standard deviation units, between a raw score and the mean
Standard Scores
A raw score that has been converted from one scale to another scale to make scores more understandable
statistically significant relative to other test takers
Z scores
T Scores
Deviation IQs
Stanines
Standard Error of Measurement (SEM)
Types of Standard Scores: (5)
Z score
Mean of 0 ; SD of 1
• Simplest standard score
Z score
A _____ of 0.05 suggests that the person slightly passes the middle score
Z score
A score that allows us to estimate where a raw score would fall on a normal curve
tests
If you convert raw scores to z scores, you can compare them across different types of ____ easily
Z score
produce both decimals and negative values
Z = X-M/SD
Z Score FORMULA:
X = raw score
M = group mean
SD = standard deviation
T scores
Most common standard score
used on a number of the most widely used educational and psychological tests
T scores
Mean of 50; SD of 10
MCCALL’s T of 50 Plus
Minus 10 Scale
T scores can be called as?
T scores
No Negatives
• Results of many aptitude, interest, and personality measures are profiled in terms of ___ scores
Deviation IQ Scores
Mean = 100 ; SD = 15 (1 standard deviation unit)
• Used for interpreting IQ
Deviation IQ Scores
Standard score on an intelligent test that approximates the SD of Stanford-Binet IQ Distribution
Deviation IQ Scores
Uses statistics to analyze a person’s intelligence relative to their age
Stanines
Based on the term standard nine; divides a data distribution into 9 parts
Infrequently used
Stanines
_____ | Description |
1-3 | Low |
4-6 | Average |
7-9 | High |
Sten
divides a distribution into 10 parts
Mean = 5.5, SD = 2
Similar to stanines but uses 10 categories instead of 9.
GRE (Graduate Record Exam) / SAT (Scholastic Aptitude Test)
A Score
Admission to graduate school or college
Scoring:
Mean = 500
SD = 100
GRE (Graduate Record Exam) / SAT (Scholastic Aptitude Test)
A Score
Administered to a large group of students to establish norms
Relationship between Standard Scores:
Bell shaped / symmetrical
Mean, Median, Mode EQUAL
Body and 2 infinite tails
Asymptotic
QUALITIES OF A NORMAL CURVE OR NORMAL DISTRIBUTION:
Asymptotic
tails (symptote) do not touch the X-Axis or Abscissa
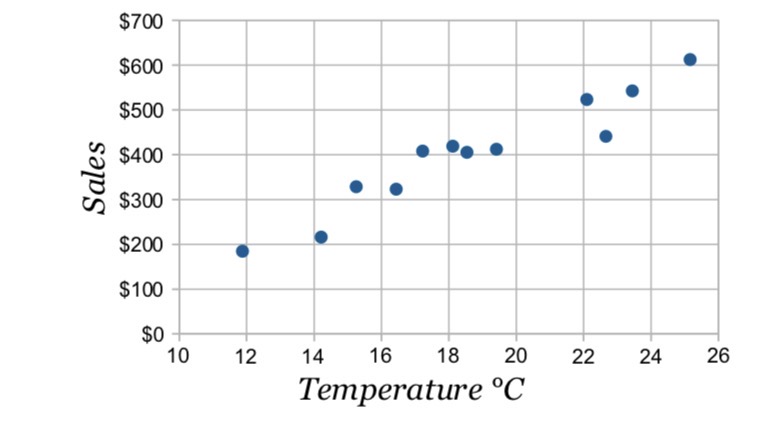
Scatter diagram
is a picture of the relationship between 2 variables
Correlation
we ask whether 2 variables covary. In other words, does Y get larger as X gets larger?
Correlation Coefficient
a mathematical index that describes the direction and magnitude of a relationship
Correlation Coefficient
(r) is a number from -1 to +1 that indicates the strength and direction of a relationship between two variables
1
The nearer to _, the STRONGER the correlation coefficient
±1
0
Perfect correlation is __
weak correlation is near __
Positive
Negative
No Correlation
Correlation (3)
Positive Correlation
High scores on Y go with high scores on X, and low scores on Y go with low scores on X.
Graph: Upward sloping scatter plot
Example: Hours studied ↑ → Exam score ↑
Negative Correlation
High scores on Y go with low scores on X, and low scores on Y go with high scores on X.
Graph: Downward sloping scatter plot
Example: Hours spent on social media ↑ → Exam score
No Correlation
Variables are not related; knowing X tells nothing about Y
Graph: Random scatter of points
Example: Shoe size ↔ IQ
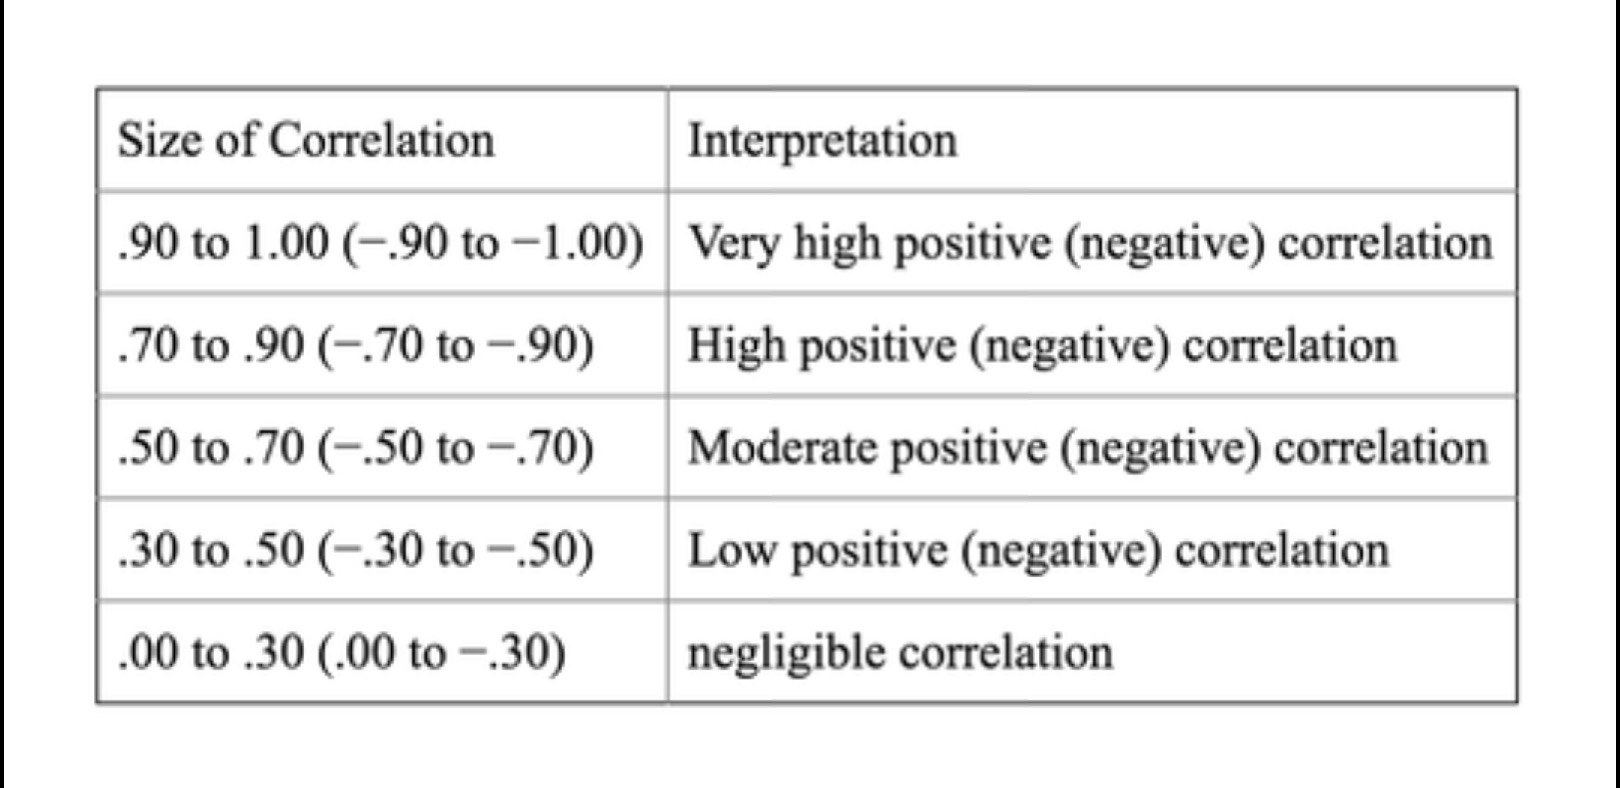
Size of Correlation & Interpretation:
Regression
is a statistical method used to predict scores on one variable (Y) from scores on another variable (X)
Predictions are based on the regression line
Regression
Related to correlation, but correlation only shows strength and direction, while _____ predicts actual values
Regression Line
best-fitting straight line through a set of points on a scatter diagram/plot
Regression Line
Simple Example
Variable X = hours studied
Variable Y = exam score
If a student studies 5 hours, the ______ __ predicts their likely exam score.