ECONS- 2. FREE TRADE AND PROTECTION
1/21
There's no tags or description
Looks like no tags are added yet.
Name | Mastery | Learn | Test | Matching | Spaced |
|---|
No study sessions yet.
22 Terms
Define Specialisation
when countries choose to produce certain g and s that are suited to them
how is spec and trade possible
Uneven distribution and quality of resources between countries
Eg. Japan specs in high quality manufactured goods due to lack of natural resources

Which goods should countries produce?
G and s that are most efficient and then export surplus production and import less efficent produced g and s

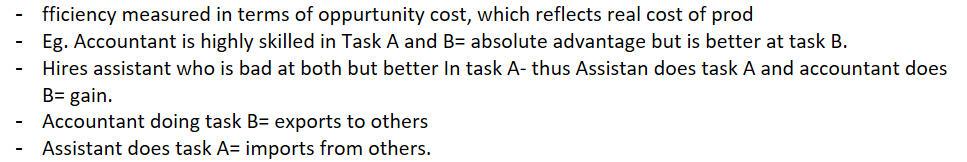
define RELATIVE EFFICIENCY
and give example
fficiency measured in terms of oppurtunity cost, which reflects real cost of prod
Eg. Accountant is highly skilled in Task A and B= absolute advantage but is better at task B.
Hires assistant who is bad at both but better In task A- thus Assistan does task A and accountant does B= gain.
Accountant doing task B= exports to others
Assistant does task A= imports from others.
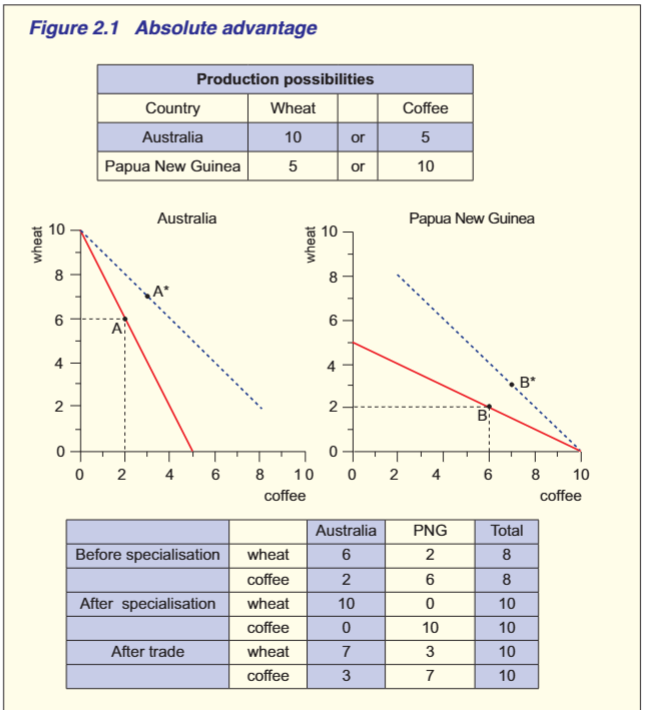
Absolute advantage
define
which should each country spec in
what happens before trade and after
how does it increase living stds?
Define- a country has absolute advantage over another country if it can produce a greater quantity of that good with its resources
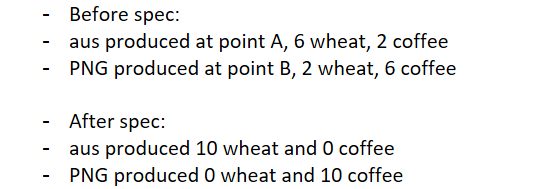
Before spec:
aus produced at point A, 6 wheat, 2 coffee
PNG produced at point B, 2 wheat, 6 coffee
After spec:
aus produced 10 wheat and 0 coffee
PNG produced 0 wheat and 10 coffee
No extra resources used by either country, but able to have outside the PPF of each


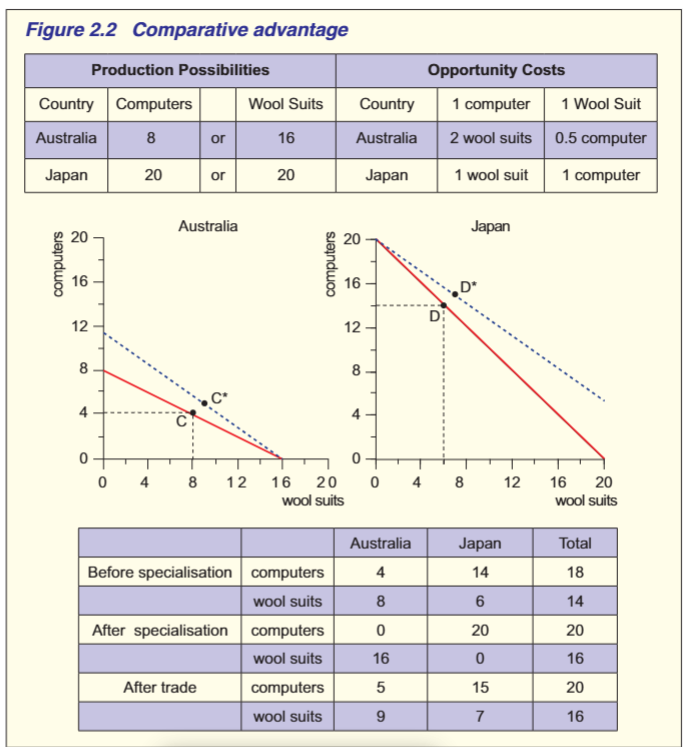
Comparative advantage
define
which has comparative advantage
what happened before and after?
When a country has absolute advantage in production of both goods, comparative advantage occurs where its absolute advantage is greatest of absolute disadvantage is lowest.
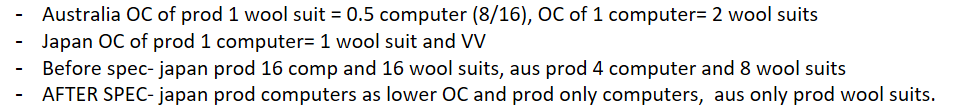
Australia OC of prod 1 wool suit = 0.5 computer (8/16), OC of 1 computer= 2 wool suits
Japan OC of prod 1 computer= 1 wool suit and VV
Before spec- japan prod 14 comp and 6 wool suits, aus prod 4 computer and 8 wool suits
AFTER SPEC- japan prod computers as lower OC and prod only computers, aus only prod wool suits.
Comp advantage using inputs
determin OC of each country
Sources of comp advantage
determined by
examples
quantity and quality of a nations, labour, natural, capital and econ progress
eg. Brazil in coffee and sugar due to geographics
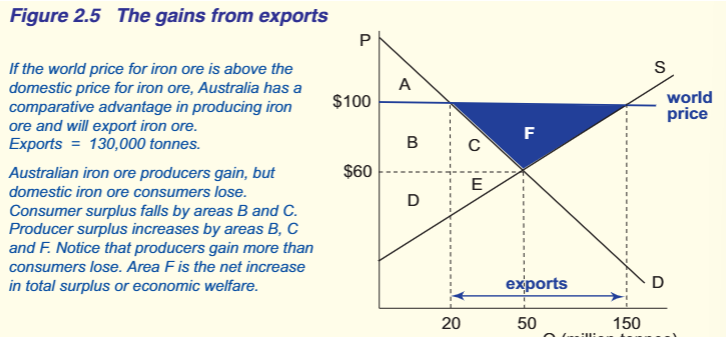
GAINS FROM EXPORTS ON D AND S OF COMP ADVANTAGE
explain the graph ie. what is the exports
what happens to producers and consumers?
domestic price lower than WP
aus has comp and should export
supply increases, demand decreases
Aus iron ore producers gain. Producer surplus increases by areas B, C, and F.
Aus domestic consumers lose as CS decreases to just A.
Areas B C and F are greater than area lose by CS= gains exceed losses.

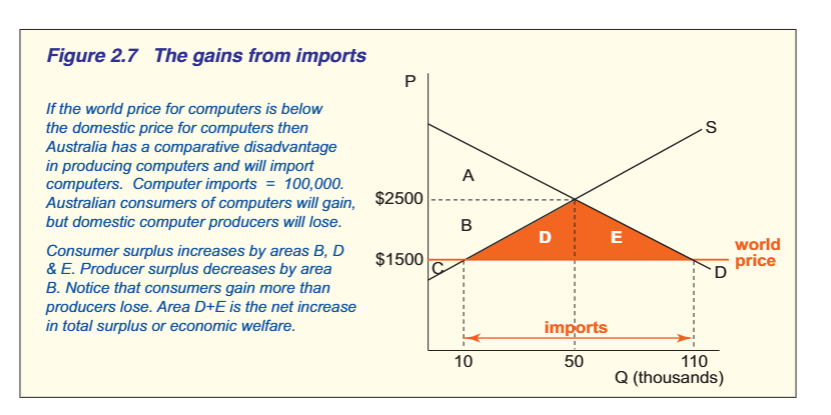
GAINS FROM IMPORTS OF D AND S
explain the graph
what happens to producers and consumers
WP is lower than domestic= not comp advantage
imports of 100
supply decreases but demand increases
Domestic producers lose as PS decreases to just C, but CS increases + DE, thus gains from CS exceed losses from PS.
D+E= net gains

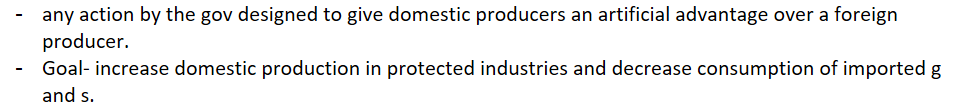
Protection
define
goal
any action by the gov designed to give domestic producers an artificial advantage over a foreign producer.
Goal- increase domestic production in protected industries and decrease consumption of imported g and s.
Types of protection and eg.
Increasing domestic price of foreign products- tariffs
Providing domestic prod with COP advantage- subsidies
Quantative restriction on imports- quotas
who benefits from protection?
Owners and workers in protected industries
Government as tarrifs= increased rev.

who loses from protection
Non protected industries- pay more for imported inputs = increased COP and less recources
Consumers- decreased imports and exports mean they pay more for international g and s but decrease consumption
ALL FORMS OF PROTECTION = NET WELFARE LOSS FOR ECON AS LOSSES>GAIN
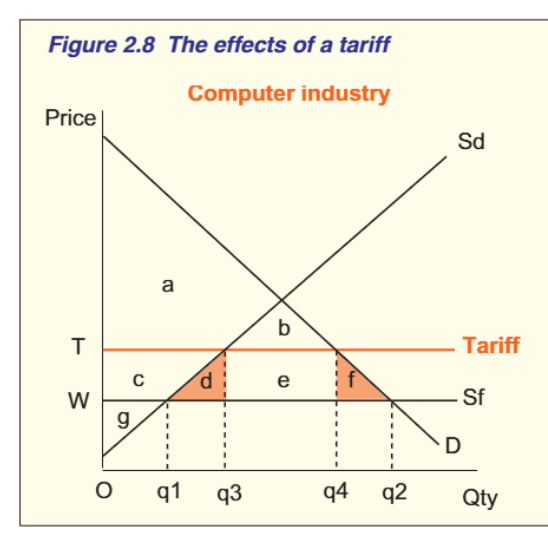
Tariffs
define
explain the graph
what happens to consumers and producers
thus
WP is initially at SF
Tarrif = increased supply from q1 to q3, but consumption decrease from q2 to q4.
Imports decrease to Q3Q4
Gov rev= e.
CS decrease from abcdef to ab.
PS increase from g to gc.
e= gov rev
D+F= DWL.
Thus, domestic industries and govs gain but consumers lose as they pay more but receive less.
Total surplus decreases and econ welfare decreases.
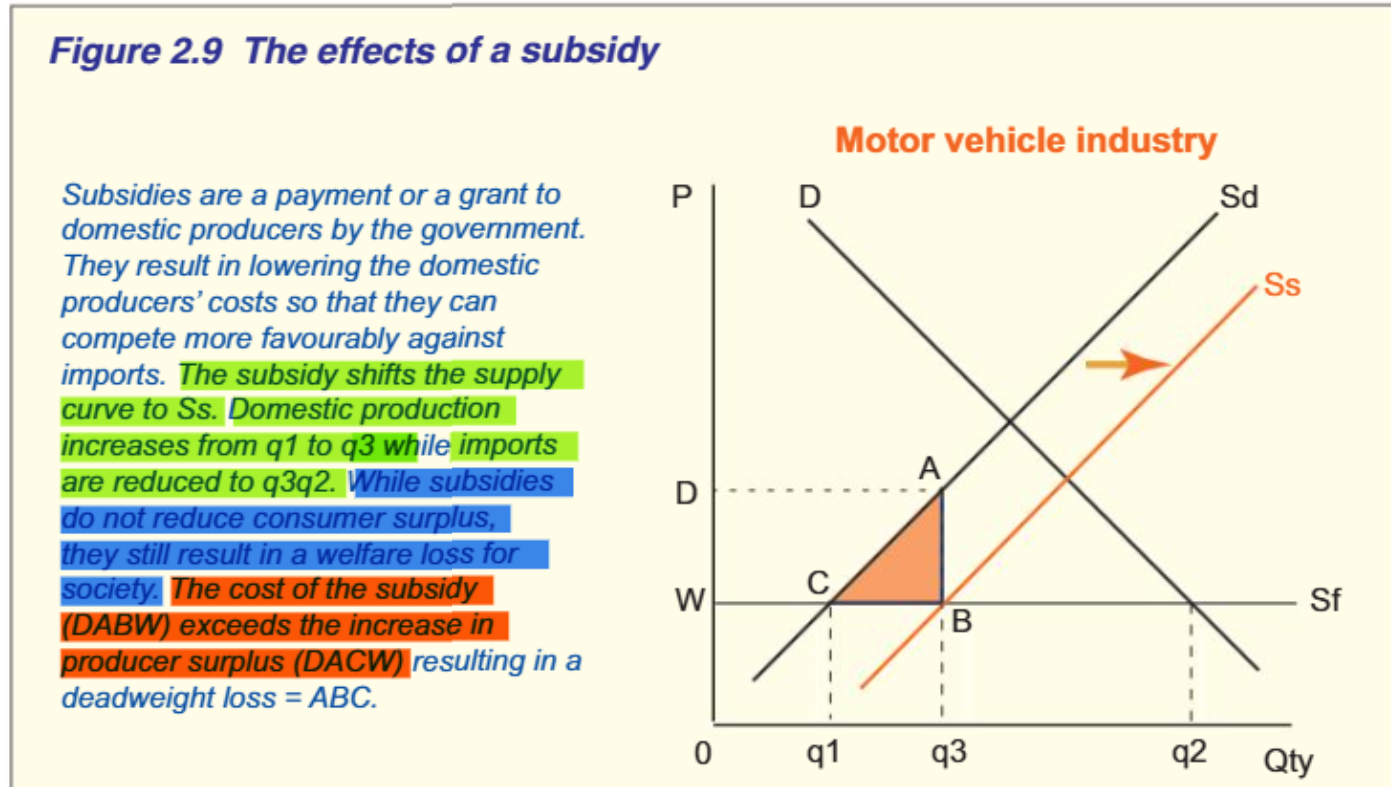
subsidies
define
explain the graph
what happens to consumers/ producers
grants or payments made by gov to producers to decrease a producers COP
Shifts supply curve from Sd to Ss= increase production but same COP from q1 to q3
Imports decrease to q3q2.
Cost of subsidy= DABW
PS= DACW.
THUS, cost of subsidy> PS= DWL of ABC.
Subsidy does not increase CS but increase PS, regardless welfare loss.
why are subsidies favoured> tarrifs?

seen less restrictive as
1. they don’t raise prices
2. dont decrease overall consumption
3. favour local producers without upsetting consumers

ARGUMENTS FOR PROTECTION
list like 3
antidumping
infant industry
national security
Describe antidumping
when a company exports a product at a lower price than it normally is domestically
foreign firms aim to drive out domestic firms as they may be big enough to run at a loss temporaily
they do this as they may have large surplus of supply that are unable to be sold in their countries, thus they attempt to reduce losses
by protecting against this, attempting to keep domestic business and jobs
Describe infant industry
New firms may become accustoms to protections put in place to help them grow
BUT decrease competition and may only be short term protection, also decreases incentive for innovation and efficiency
describe national security
argued that import barriers are nessencary to protect vital industries in case of war time emergencys
Problem is identifying which are nessecary as eveeryone could present a case
most recent trade war
2018- trump applied 25% tariffs on canada an mexican imports, 10% on china.
why? to protect for national security, antidumping, to increase employment and decrease trade deficit.
consumers paid more and increased COP= decreased prod and employ= potential recession