Business 212: Business Statistics Ch 1. Introduction to Business Statistics
1/130
There's no tags or description
Looks like no tags are added yet.
Name | Mastery | Learn | Test | Matching | Spaced | Call with Kai |
|---|
No analytics yet
Send a link to your students to track their progress
131 Terms
business statistics
a specialty area of statistics which are applied in the business setting
descriptive statistics
used to describe the total group of numbers
infernal statistics
infers relationships from the population of numbers
mean
the average number
mode
the most frequent number
median
the middle number
ratios
numbers representing relationships
sample size (sampling)
the number of people to ask
statistical model (modeling)
a representation of what will probably happen
probablity
the likelihood of something happening
just-in-time
reduces waste by organizing good delivered as needed, based on accurately forecasted demand
Six Sigma
a term used in business to describe a process that results in no more than 3.4 defects out of a million
control chart
a statistical graph that shows process changes over time
Why would a statistical model be used?
To report last month's average sales
To summarize data
To predict what probably might happen
To calculate turnover ratios
To predict what probably might happen
What is a tool used in Six Sigma that graphs process changes over time?
Probability
Control chart
Just-in-time inventory
Sample size
Control chart
What does Six Sigma refer to?
Using descriptive statistics to make inferential decisions
Creating a statistical model based on probabilty
Having enough in your sample size to have accurate statistics
Having no more than 3.4 defects out of a million
Having no more than 3.4 defects out of a million
How are descriptive statistics used?
Use historical data
To summarize numbers
All of these
To provide an average
All of these
What is an example of probability?
The number of cars sold last month
The likelihood that a product will be defective
The total profit of a company
The average production time
The likelihood that a product will be defective
qualitative variables
categories that result in descriptive values or labels
nominal variables
qualitative variables that only refer to information by name and do not have to be listed in any order
ordinal variables
results that are listed in a certain order or follow some type of ranking system
binary variables
categories that will only result in one of two options
quantitative variables
categories that result in numerical values or real numbers
continuous variable
a measurement that can assume an endless number of values
discrete variable
used when there is a rating system or scale of measurement to follow

Looking at the chart of quantitative variables below, which variable is continuous?
Rating
Salary
4-Somewhat likely
No continuous variable is listed.
Salary

Looking at the data listed under the Position variable, why would the Position variable be considered a nominal variable?
The label lists the positions in order.
The label ranks the positions.
The label describes the position by name.
The label rates the positions.
The label describes the position by name.
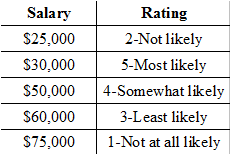
Looking at the data given for the Rating variable, what type of variable is being used?
A discrete variable
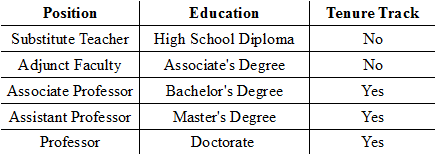
Using the chart of qualitative variables below, which variable is binary?
Tenure Track
Position
Education
No binary variable is listed.
Tenure Track

Looking at the chart of qualitative variables below, what type of variable is 'Education'?
Discrete
Ordinal
Nominal
Binary
Ordinal
Population
a group that has been designated for gathering data from
Data
information collected from the population
Descriptive Statistics
give information that describes the data in some manner
Inferential Statistics
makes inferences about populations, using data drawn from the population
probability distributions, hypothesis testing, correlation testing and regression analysis
Sample
a set of data taken from the population to represent the population
What are two examples of inferential statistics?
mean and probability distributions.
Regression analysis and hypothesis testing.
Range and percentiles.
Variance and correlation.
Regression analysis and hypothesis testing.
What is statistical estimation?
Methods for rounding answers in statistical calculations.
Methods for reducing errors in descriptive statistics.
Methods for reducing errors in inferential statistics.
Methods to determine the best graph to represent statistical data.
Methods for reducing errors in inferential statistics.
How do descriptive and inferential statistics differ?
Descriptive statistics only attempt to describe data, while inferential statistics attempt to make predictions based on data.
Descriptive statistics are more computationally sophisticated than inferential statistics.
Inferential statistics are more computationally sophisticated than descriptive statistics.
Inferential statistics only attempt to describe data, while descriptive statistics attempt to make predictions based on data.
Descriptive statistics only attempt to describe data, while inferential statistics attempt to make predictions based on data.
Which two are examples of descriptive statistics?
Mean and standard deviation.
Hypothesis testing and histograms.
Variance and regression analysis.
Median and correlation.
Mean and standard deviation.
In statistics, a sample:
Can be used for inferences but not for predictions.
Is another word for population.
Is a set of data taken from the population to represent the population.
Is only used in descriptive statistics.
Is a set of data taken from the population to represent the population.
Statistical Model
a combination of inferences based on collected data and population understanding used to predict information in an idealized form
Correlation
the relationship between two variables or sets of data
Response Variable
the observed variable, or variable in question
Dependent Variable
a condition or piece of data in an experiment that is controlled or influenced by an outside factor, most often the independent variable
Explanatory Variable
a variable, or set of variables, that can influence the response variable
Independent Variable
a condition or piece of data in an experiment that can be controlled or changed
Nominal Data
categorical data that assigns numerical values as an attribute to an object, animal, person or any other non-number
Ordinal Data
is data that can be ordered and ranked, but not measured
Discrete Data
data that cannot be divided, it is distinct and can only occur in certain values
Continuous Data
data that can be divided infinitely, it does not have any value distinction
Variables are collected in the form of data. What are the two major forms of data?
categorical and quantitative
numerical and ordinal
measurable and non-measurable
explanatory and response
categorical and quantitative
Sheila is a baker experimenting with a cake recipe. Specifically, she is monitoring how changes in the volume of cream affect the moistness of the cake. What kind of variable is the volume of cream, and why?
it is the response variable, because it has an influence on the dependent variable
it is a response variable, because it is a condition in the experiment that is being changed.
it is an independent variable because it is a condition in the experiment that can be changed.
it is an independent variable, because it can be divided infinitely
it is an independent variable because it is a condition in the experiment that can be changed.
Jim is studying how differences in the screen color of electronic devices make an impact on eye strain experienced by the user. In these experiments, which is the response variable and which is the explanatory variable.
the response variable is eye strain; the explanatory variable is screen color
the response variable is screen color; the explanatory variable is eye strain
the response variable is eye strain; the explanatory variable is not mentioned
the response variable is eye strain; the explanatory variable is the electronic device
the response variable is eye strain; the explanatory variable is screen color
Why do different types of statistical models exist?
to determine which variables should be controlled or changed
because there is no way to find relationships between all of the variables that exist
because there are many different types of variables and the models provide ways to analyze them
to explain why a set of variables incur a response in the variable in question
because there are many different types of variables and the models provide ways to analyze them
The _____ is a condition or piece of data in an experiment that is controlled or influenced by an outside factor, most often the independent variable.
independent variable
dependent variable
explanatory variable
statistical model
dependent variable
Bivariate Data
deals with two variables that can change and are compared to find relationships
Independent Variable
condition or piece of data in an experiment that can be controlled or changed
Dependent Variable
a condition or piece of data in an experiment that is controlled or influenced by an outside factor, most often the independent variable
Univariate Data
one variable in a data set that is analyzed to describe a scenario or experiment
Positive Correlation
dependent variables and independent variables in a data set increase or decrease together
Negative Correlation
dependent variables and independent variables in a data set either increase or decrease opposite from one another
When you find a relationship in bivariate data, you are looking at a positive or a negative _____.
bivariate
correlation
dependent
independent
univariate
correlation
One variable in a data set that is analyzed to describe a scenario or experiment is called _____
correlation
independent
dependent
univariate
bivariate
univariate
What type of data uses two sets of variables that can change and are compared to find relationships?
Dependent
Bivariate
Univariate
Correlation
Independent
Bivariate
A condition or piece of data in an experiment that is controlled or influenced by an outside factor is considered what type of variable?
Univariate
Correlation
Dependent
Bivariate
Independent
Dependent
A scientist is conducting an experiment on mice, seeing how their weight is affected by the volume of cheese they're given. What is the independent variable in this experiment, and why?
The volume of cheese is the independent variable, because it's being affected by the weight of the mice.
The volume of cheese is the independent variable, because it's being changed to measure the effect on weight.
The weight of the mice is the independent variable, because it's being changed to measure the volume of cheese.
The weight of the mice is the independent variable, because it's being affected by the volume of cheese.
The volume of cheese is the independent variable, because it's being changed to measure the effect on weight.
Data
information that is collected for analysis
Nominal data
categorial data that assigns numerical values as an attribute to an object, animal, person or any other non-number
Ordinal data
data that can be ordered and ranked, but not measured (levels of achievement, prizes, rankings, and placements)
Interval Measurement
data that is grouped in evenly distributed values and measured based on the group to which the variable is attributed
Ratio
a mathematical comparison between two numbers
What is information that is collected for analysis?
Ordinal Data
Ratio
Interval measurement
Data
Nominal Data
Data
What is a mathematical comparison between two numbers?
Nominal Data
Interval measurement
Ordinal Data
Ratio
Data
Ratio
The numbers on lacrosse jerseys are an example of _____ data.
Nominal
Ordinal
Ratio
Discrete
Interval
Nominal
A coach records the levels of ability in martial arts of various kids. What type of data is this?
Interval
Discrete
Nominal
Ordinal
Ratio
Ordinal
What is data that is grouped in evenly distributed values and measured based on the group to which the variable is attributed?
Ratio
Ordinal Data
Nominal Data
Data
Interval measurement
Interval measurement
Variable
an alphabetical character that represents an unknown number
Random Variable
a variable that is subject to randomness, which means it can take on different values
discrete random variable
when the variable represents isolated points on the number line
X is discrete
the numbers that X represents are isolated points on the number line
probability distribution
all the possible values of the random variable and the associated probabilities
X is continuous
X represents an infinite number of values on the number line
density curve
a plot of the relative frequencies of a continuous random variable
An agency decides to conduct a survey on household incomes in their county. Let x = the household income. What type of variable is x?
x is a discrete random variable.
x is a continuous random variable.
x is a binomial random variable.
x is both discrete and continuous.
x is not a random variable.
x is a continuous random variable.
You decide to conduct a survey of families with two children. You are interested in counting the number of boys (out of 2 children) in each family. Is this a random variable, and if it is, what are all its possible values?
No, it is not a random variable, since it is not random.
Yes, it is a random variable, and its values can be 1 and 2.
Yes, it is a random variable, and its values can be 2 or 4.
Yes, it is a random variable, and its values are 0, 1, or 2.
Yes, it is a random variable, and its values are 0, 1, or 2.
You decide to collect a bunch of cans of soda and measure the volume of soda in each can. Let x = the number of mL of soda in each can. What type of variable is x?
x is a continuous random variable.
x is a discrete random variable.
x is a constant.
x is not a random variable.
x is a continuous random variable.
Which of the following is NOT a property of a random variable?
A random variable can be discrete or continuous.
The sum of the probabilities of a random variable is equal to 1.
A random variable cannot be negative.
A random variable represents numerical outcomes for different situations or events.
A random variable cannot be negative.
You conduct an experiment where you want to measure the number of rolls it takes to get two 6's in a row when you roll a fair six-sided die. State whether the random variable is discrete or continuous and give a summary of its values.
Discrete with values ranging from 0 to 1
Discrete with values 2, 3, 4, 5, 6, etc.
Continuous with values ranging from 1 to 6
Discrete with values ranging from 1 to 6
Discrete with values 2, 3, 4, 5, 6, etc.
Bias
the intentional or unintentional favoring of one group or outcome over other potential groups or outcomes in the population
selection bias
response bias
selection bias
non-representative sample
nonresponse bias
voluntary bias
Non-representative Sample
when the method with which a sample is collected specifically excludes certain groups from the research, whether intentionally or unintentionally
Nonresponse Bias
the members of a sample that do not choose to respond or participate in the research and the characteristics of those members
Voluntary Bias
the members of a sample that choose to respond or participate in the research, whether intentionally or unintentionally
response bias
leading questions
social desirability
Leading Questions
questions that encourage the answer expected from the researcher
Social Desirability
the tendency of participants to answer inaccurately, based on the way they feel they should answer rather than the truth
Why is it important to avoid a non-representative sample when conducting a survey?
A non-representative sample means the survey results will be diverse
It is harder to identify the characteristics of a non-representative sample
The survey will reflect the characteristics only of the group that was sampled
The survey will reflect the characteristics only of the group that was excluded
The survey will reflect the characteristics only of the group that was sampled
A survey is handed out by loud volunteers on a street corner. Some people are suspicious of the volunteers and choose to not participate in the survey. This is an example of:
Non-representative sample
Nonresponse bias
Leading questions
Voluntary bias
Social desirability
Nonresponse bias
A political group invites people in the local communities to participate in a survey about prayer in schools. This is an example of:
Nonresponse bias
Leading questions
Social desirability
Non-selection bias
Voluntary bias
Voluntary bias
In a survey, people on average responded that they floss seven times a week despite the fact that the actual averages are drastically lower. Which form of bias likely accounts for this discrepancy?
Social desirability
Nonresponse bias
Cultural desirability
Voluntary bias
Selection bias
Social desirability