13.4 Data Quiz
1/11
There's no tags or description
Looks like no tags are added yet.
Name | Mastery | Learn | Test | Matching | Spaced | Call with Kai |
|---|
No analytics yet
Send a link to your students to track their progress
12 Terms
What is data?
I. Computer readable information
II. Information collected about the physical world
III. Programs that process images
IV. Graphs and charts
1. II, IV
2. I, II
3. I, II, IV
4. I, II, III, IV
I, II
Which of the following statements is NOT a benefit of using computers to process data?
1. People can use computers to find patterns in data and make predictions.
2. Computers help people visualize data so that it is easy to extract useful information.
3. Websites can spy on people and gather large amounts of personal data without the user knowing.
4. Computers are able to easily process, manipulate, and display large amounts of data in a short amount of time.
Websites can spy on people and gather large amounts of personal data without the user knowing.
Which of the following statements is an example of computer-readable data?
1. A handwritten note
2. Brain waves
3. A physical photograph
4. A digital spreadsheet filled with measurements about the air quality of different major cities
A digital spreadsheet filled with measurements about the air quality of different major cities
Which of the following statements is true about data visualizations?
1. Visualizing data has only been possible since computers have become widespread.
2. Visualizations take many forms, from tables to charts to images.
3. There is always one exact visualization that should be used to show a particular aspect of a dataset.
4. The only way to extract information from data is by using a visualization.
Visualizations take many forms, from tables to charts to images.
Suppose you want to make a visualization that shows how many students bought certain quantities of candy from the vending machine during the month of September. Of the choices below, which chart would best convey this information to the person looking at the graph?
1. Pie chart
2. Histogram
3. A map where the colors represent the number of candy bars bought
4. Line chart
Histogram
In which of the following would using a chart to visualize data make sense?
1. You want to track the number of times you say "hello" today.
2. Your school wants to track how many people attend the football games over time throughout the school year.
3. You are trying to figure out what happens when different colors are mixed.
4. You need instructions on how to bake a cake.
Your school wants to track how many people attend the football games over time throughout the school year.
A natural science museum opened a new display that lets the visitors view animations of how the health of a coral reef varies based on water temperature, pollution levels, and the number of fish living around the reef. The visitors are able to choose a numerical value for each of the conditions. The exhibit's animations are determined by using a database to look up how healthy the coral reef is at the particular settings the visitor chooses and displaying a corresponding picture.
What is one advantage of using an interactive exhibit like this instead of showing a poster with the same information?
1. The visitors will be more entertained by the exhibit, but won't learn any more than they would have from just looking at a poster.
2. By allowing the visitors to interact with the exhibit, the visitors will be able to understand coral reefs better since they will see the impacts of many different conditions in an easy-to
By allowing the visitors to interact with the exhibit, the visitors will be able to understand coral reefs better since they will see the impacts of many different conditions in an easy-to
Polly and Sergei are working on a project to explain how the rise in oil prices is leading to a rise in lunch prices at their school.
Polly wants to have a chart showing the oil prices every day over the past 18 months and a different chart showing the lunch prices every day over the past 18 months. Sergei argues that having two separate charts won't show the relationship between oil prices and lunch prices. He also thinks that the charts are showing too many data points. Instead, he wants to use a program to make a chart that shows both the oil prices and the lunch prices on the same chart. In addition, rather than plotting the prices for every day, he only wants to chart the average monthly prices for oil and lunch.
Why would Sergei's approach make it easier for other people to analyze the data than Polly's approach?
Sergei's approach makes the data easier to analyze by combining both oil and lunch prices into one chart, making trends and relationships clearer. Using monthly averages instead of daily prices reduces clutter, making patterns easier to see, while Polly's separate charts with too many data points could make analysis more difficult.
Which of the following statements are true about using visualizations to display a dataset?
I. Visualizations are visually appealing, but don't help the viewer understand relationships that exist in the data
II. Visualizations like graphs, charts, or visualizations with pictures are useful for conveying information, while tables just filled with text are not useful.
III. Patterns that exist in the data can be found more easily by using a visualization
1. I and II
2. II and III
3. III only
4. I, II, and III
III only
News reporting agencies often want to find the public's opinion on current events. One particular agency is considering two different strategies to collect this data by collecting responses to online surveys. The two strategies are outlined below.
Strategy One:
1. Uses a database to store all of the survey responses
2. Stores some data as text and some data as numbers
3. Will track extra information about the survey taker that won't be publicly visible
Strategy Two:
1. Uses a single spreadsheet to store all of the survey responses
2. Stores all data as numbers
3. Will not track any information other than the survey responses
Which of the following statements is the most accurate comparison of these strategies?
Strategy One will allow the agency to conclude more about the public's opinion because it tracks extra metadata, while Strategy Two will make it hard to find trends and access particular pieces of the data.
Which of the following statements describes how mobile devices, the use of computers in more and more everyday interactions, and the ability to connect with other devices almost anywhere are changing society?
I. People are able to use mobile devices for new applications such as finding directions or finding restaurants
II. Data can be collected from thousands of sources and can be combined to provide new services to individuals and companies
III. Buildings, cars, classrooms, and offices can now be engineered with sensors to automate tasks like adjusting the thermostat or even driving
IV. Data that is collected can be used to identify social problems
1. II, IV
2.III
3. I, III
4. I, II, III, IV
I, II, III, IV
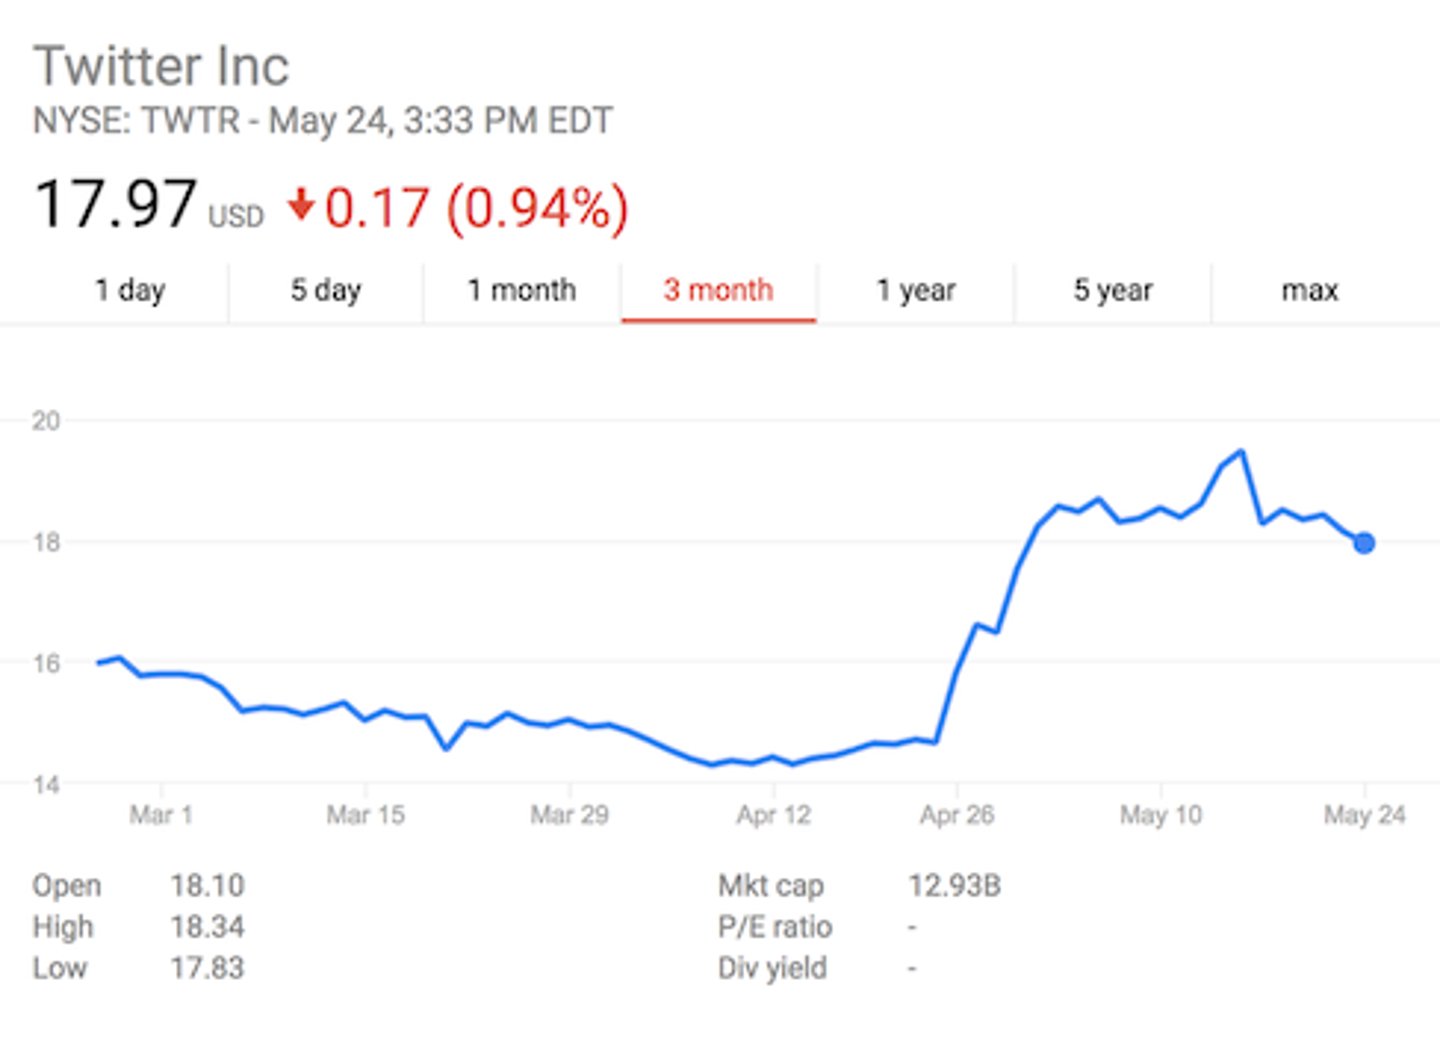
Shown here is a line graph showing the stock prices for Twitter, Inc.
Source: Ryan McCready https://venngage.com/
What is misleading about this visualization?
1. The y-axis is upside down, so larger values are at the bottom and smaller values are at the top.
2. The y-axis is truncated making the graph seem like it is increasing a lot more than it actually is.
3. The graph is omitting data.
4. The graph makes it seem like the increase in stock prices are caused by the month that they are sold/bought.
The y-axis is truncated making the graph seem like it is increasing a lot more than it actually is.