Fundimentals of GIS - Exam 1 Study Guide
1/31
There's no tags or description
Looks like no tags are added yet.
Name | Mastery | Learn | Test | Matching | Spaced | Call with Kai |
|---|
No analytics yet
Send a link to your students to track their progress
32 Terms
Geographic Information Systems
GIS: system that capture, store, manipuate, visulize geoggraphic data
Urba planning
Enviormental management
Agriculture
Transportation
Public heath
ESRI/ArcPRO
Software in GIS -
ESRI develops GIS tools
ArcPro latest desktop GIS software
Physical entity
actual geographic object
spatial object
identifiable entities in space characterized by specific attributes, boundaries, and processes
cartographic object
computer representation of a physical entity
thematic layers
Contains all fo the same “type of data”
later for river, layer for roads, layer for elevation
cartesian coordinate system
Two-three dimensional grid system using linear distances (X-axis= hori, Y-axis = vert)
geographic coordinate system
GCS - global reference system that defins location using ANGLES
degreese, minuents(‘), and seconds (“) or decimla degrees
Uses latitude and longitude
attribute data
Non-spatial data about spatial objects (names, values, numbers)
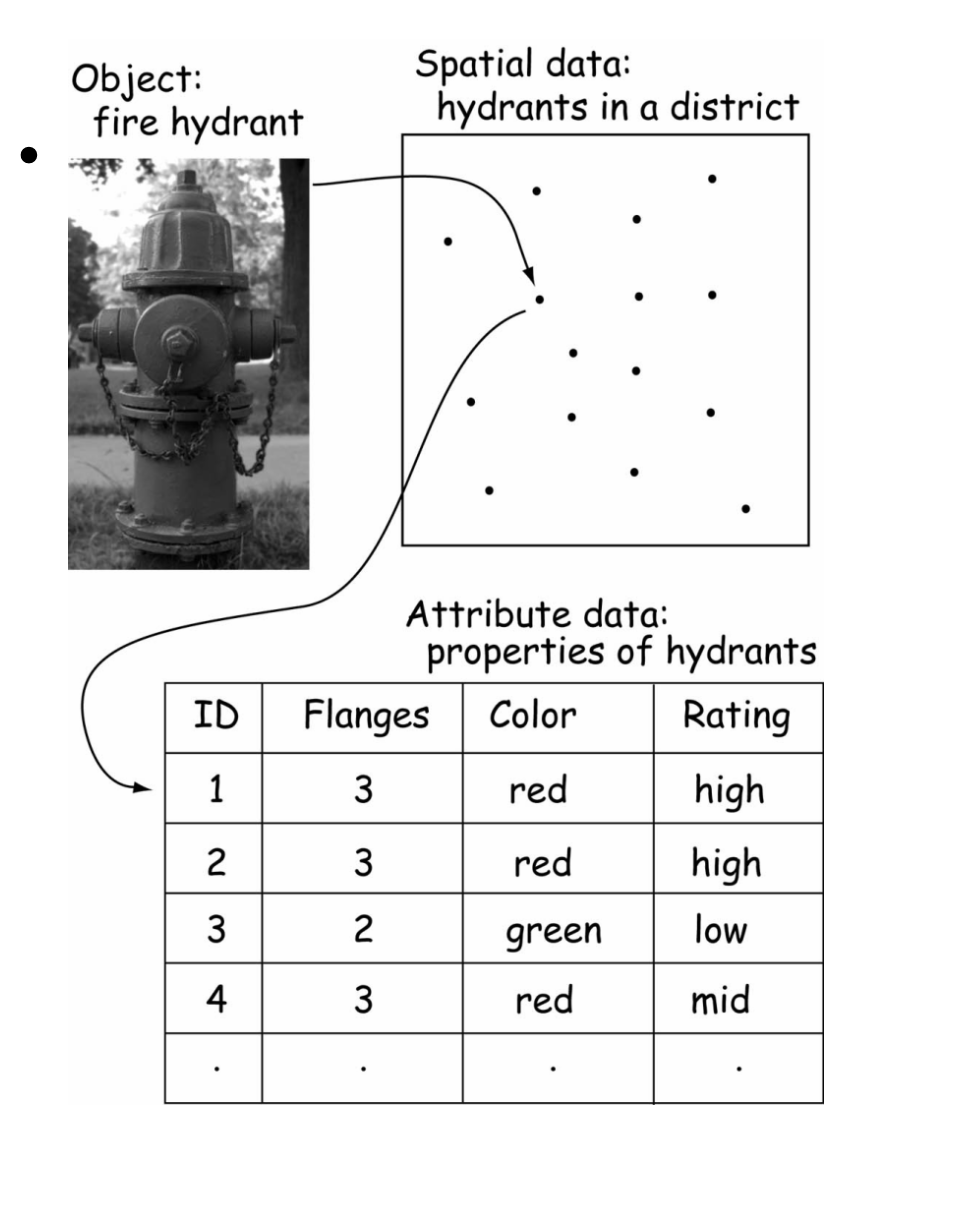
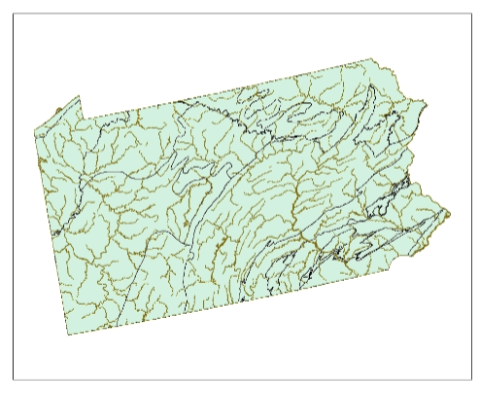
vectors
Model with points, lines, and polygons (roads, streams, points)
LINES HAVE NO DIMENSIONS
CAN: store spatial relationship + high precision graphs + support tradiitional cartography
CANT: difficult to update, complicated file strucutres
rasters
Grid cells to represnt a region (aerial/topographic maps) each cell is a value (square cel)
Can be both discrete + continute data
CAN” simple, easy spatial analysis
CANT: file very large, pixleated if close
USGS quadrangle
Very common (1:24000), covers around 7.5 min rectangle. Elevation derived from pairs of air photos.
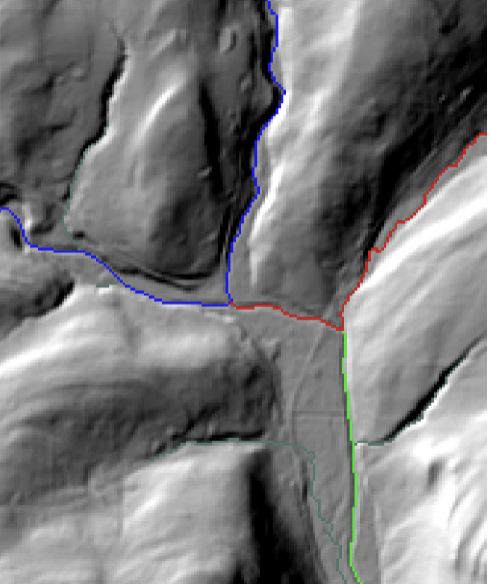
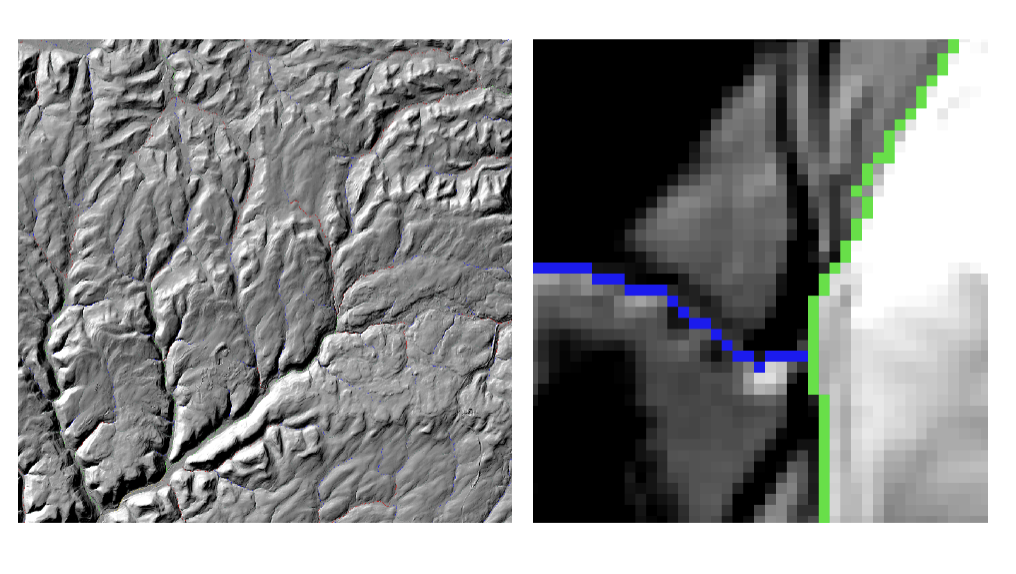
contour lines
Lines that show elevation on a map (closer lines = stepper slope)
If lines cross stream, V’s in contour line point upstream
map scale
ratio of distance on the map corresponding to the distance on the ground
discrete data
Clearly bounded features, SHARP BOUNDARIES, roads, land, houses
continuous data
Values change contunously across surface (gradient, elevation, temp)
resolution
Level of detail in spatial data
Raster = pixel sixe
Vector = cordinate precision + gemogetry detail
dataframe
container that holds one or more layers of spatial data (vector/raster), organizes how it looks
inclusion/generalization errors
Vector: feature incorrectly included/excludede in a dataset (present or absent)
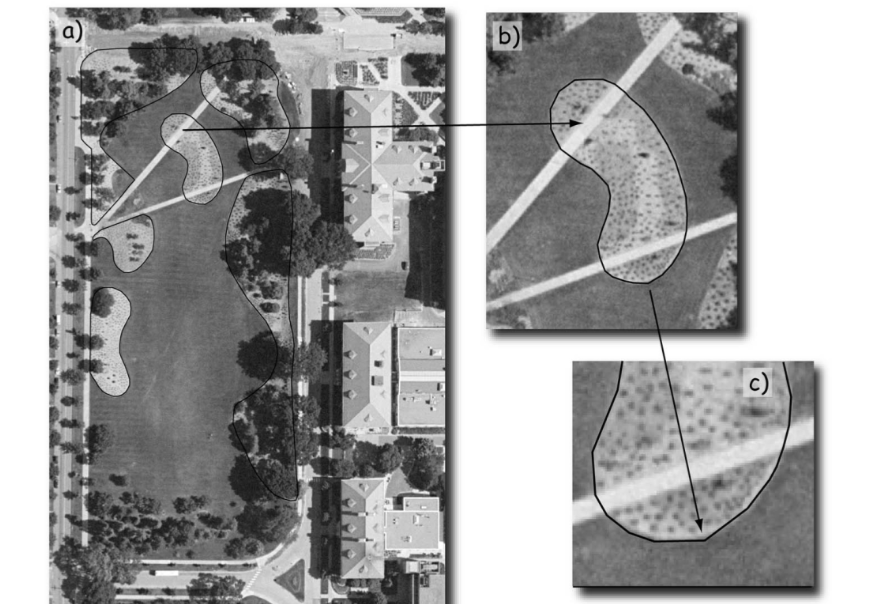
mixed pixel problem
Raster: pixel contain mutiple land over types but raster shows one value
Nominal Attributes
Descriptive information (text, words, color, names)
Ordinal Attributes
Ranking (text or number)
Interval/Ratio Attributes
numbers (area, height, weight)
MATH DD from DMS (EX) DMS = 32°45’28’
DD = D + M/60 + S/3600
32 + 45/60 + 28/3600
=32 + 0.75 + 0.0077778
=32.7577778
MATH DMS from DD (EX) DD = 24.93547
D = ineger part
M = integer of decimal part X 60
S = 2nd decimal x 60
D=24
M = 0.93547 × 60 = 56.1282
M = 56
S = 0.1282 × 60 = 7.692
24°,56’,7.692’
Datum
mathematical model of the Earth (many cuz each about specific stuff)
Projection
Different ways to flatten Earth so it can be seen
distort in Area Direction Shape Distance
Geoid
Three dimensional surface along which the pull of gravity is a constant
Ellipsoid
Modle of Earth - flat at poles an round at equator
Prime meridian
starting line for longitude in GIS
UTM
UTM is a meter-based projected coordinate system that divides the Earth into zones to minimize distortion (global)
Zones are numbered 1–60, starting at 180°W
Zone number (1–60)
Hemisphere (N or S)
units meters
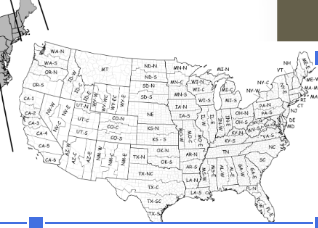
State Plane
State Plane is a high-accuracy, U.S.-specific coordinate system designed for surveying and engineering.
-meters