Week 4-Between groups one-way analysis of variance ANOVA
1/17
There's no tags or description
Looks like no tags are added yet.
Name | Mastery | Learn | Test | Matching | Spaced |
|---|
No study sessions yet.
18 Terms
between participants
each participant only provides a score for one condition
experimentwise Error rate/Family wise error rate
increased chance of ‘making a mistake’ by running more than one t-test
ANOVA controls for these errors
when to use ANOVA
with more than two groups
parametric assumptions met
assumptions for ANOVA
normal distribution
homogeneity of variance- Levene’s for between groups, Mauchly’s Test of Sphericity for within groups
independent random samples
do not need equal numbers of score in each group
Mauchly’s test of sphericity
W=, x2(df)=, p=
ANOVA
looks for differences between the means of the groups
where the means are very different, there is a greater degree of variation between the conditions
takes account of the variance within the conditions and compares this to the variance between conditions.
between groups variance
treatment/condition effects
individual differences to the condition
experimental error
the variation between mean scores in each condition
within groups variance
differences or variation within a group
individual differences
experimental error
logic of ANOVA
participants in different groups should have different scores because they have been treated differently but participants within the same group should have the same score.
We want to know if our different treatment groups have different scores because of the treatment condition they have been exposed to.
The variability in the groups not produced by the experiment is error variance.
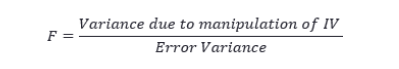
F ratio
if the manipulation of the IV is responsible for the differences between scores
fisher ratio is the ratio of variance
if the error variance is small compared to variance due to manipulation of the IV, the f-ratio will be greater than 1
if the effect of the IV is small or the error variance is large, the F-ratio will be less than 1 (the effect of the IV is not significant)
the greater the F-ratio, the better
the p value needs to be less than 0.05 to be significant
factors
These are the independent variables (IVs). In our study, the Factor is Condition.
levels of factors
In our study we have three levels of factors. Our IV (condition)has been manipulated into
(1) Constant low level of music,
(2) No music and
(3) Intermittent music.
independent measures one-way ANOVA/one way between participant
e.g. people with high blood pressure were randomly allocated to one of three groups to reduces their blood pressure
null hypothesis: there will be no difference in the reduction of blood pressure among the three treatments
alternative hypothesis: there will be a difference among the three treatments
SPSS ANOVA between participants reporting
report test used
F ratio
suggests that the observed variance among the three groups is over 9 times what we would expect if the null hypothesis is true, therefore reject/accept null hypothesis (p value)
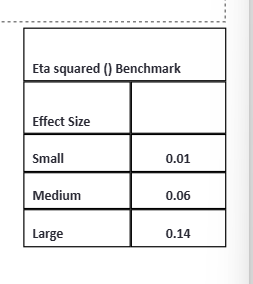
effect size (eta squared) n2=, % of the variation can be accounted for different groups, benchmarks
planned (a priori) comparisons
Conducted when the researcher has predicted which means will differ from each other, after you have conducted the ANOVA analysis
SPSS uses linear contrasts technique and assigns weights
unplanned (post hoc) comparisons
Differences in means explored after data has been collected but have no prediction of where the means will differ from each other
Equal Variances Assumed: Bonferroni (conservative, widely reported)
Equal Variances Not Assumed: Games-Howell (widely reported)
planned comparisons in SPSS
using contrast tab
read ‘assume equal variances’ row
t(df)=, p=
effect size using cohens d, does not overlap 0, talk about both even if not significant
unplanned comparisons SPSS
mean difference and p value
signposted with an asterisk
mention all outcomes even if not significant
cohen’s d