L2 Life tables and population parameters
1/44
There's no tags or description
Looks like no tags are added yet.
Name | Mastery | Learn | Test | Matching | Spaced | Call with Kai |
|---|
No analytics yet
Send a link to your students to track their progress
45 Terms
What does population growth depend on?
Numbers this year = Numbers last year +births +immigration - Deaths - Emmigration
Depends on processes and mechanisms
What is the fundamental equation of population biology?
The size of a population at an initial time [Nt] will change at the following time [Nt+1] as follows:
Nt+1 = Nt + (B + I) - (D + E)
How can you work out the change in population size?
Change in population size:
ΔN = Nt+1 - Nt
ΔN = B-D
How do you know when the population is increasing or decreasing?
B + I > D + E Population is Increasing
B + I < D + E Population is Decreasing
What does the size of a population depend on?
- Births
- Immigration
- Deaths
- Emmigration
What is population growth?
the intrinsic capacity of all life for exponential growth
What is semelparity?
Species that reproduce only once before death. It is also known as the "big bang" reproduction
eg. salmon, dandelions
What is iteroparity?
Species that have multiple reproductive cycles
What 2 processes effect population growth?
- Density dependent regulation
- Density independent limitation
What mechanisms are from density dependant regulation?
•Food supply
•Refuge
•Mating opportunity
What mechanisms stem from density independent limitation?
•Predation
•Disease
•Dispersal
What are life tables used for?
• Used to study populations in an organized way.
• Helpful to follow births and deaths.
• Individuals can be grouped in all sort of classes: age, size, larvae stages, etc.
What are the 2 classes of life tables?
• Horizontal or Dynamic or Cohort: we follow a cohort along its whole life.
• Vertical or Static: we observe the whole population to get an approximation of its dynamic within a particular time
What does the way you group a life table depend on?
The needs and ecology of the species
What is a cohort?
Cohort is a group of individuals in a population that are born (or enter the population) at the same time and are followed through their life.
• Example: All baby turtles hatched on the same beach in June 2024 form a cohort.
• Commonly used in life table analyses.
• Important for studying survivorship, fecundity, and age-specific dynamics
What is a generation?
Generation is the average time between the birth of individuals and the birth of their offspring.
• Also called generation time (T).
• Can be calculated from life tables (e.g., via the mean age of reproduction).
• Species with short generation times (e.g., fruit flies) will grow faster than those with long generation times (e.g., elephants), all else being equal.
What are the parameters in life tables?
1. ax - Number observed (surviving) individuals at start of eachstage
2. Ix - Survival rates: proportion of original cohort surviving to startof each stage
3. dx - Standardize mortality: proportion of original cohort dying during each stage (absolute loss)
4. qx - Mortality rate per stage/age (considering only those alive)
5. Fx - Total number of offspring produced per stage/age
6. mx - Fecundity rate: mean number of offspring produced persurviving individual per stage/age
What is R0?
Basic reproductive rate
mean number of offspring produced per original individual by the end of the cohort. In annual species, the overall extent by which the population has increased or decreased over time.
What is R?
net growth rate
or net replacement rate per generation - ONLY FOR ITEROPAROUS SPECIES
• It reflects stepwise multiplication, not continuous growth
• Every time step, the population jumps up by a factor of R. There's no in-between
What is r?
Intrinsic rate of increase
ONLY FOR ITEROPAROUS SPECIES
• Growth rate per individual (or per capita) per time unit
• It measures how fast the population is growing at any moment.
• Measures the probability of a birth minus the probability of a death occurring in the population during a particular time interval
How do you estimate Ix?
ax+1 / a0
How do you estimate dx?
Ix - Ix+1
How do you estimate qx?
dx / lx (from the same category)
How do you estimate mx
Fx / ax (from the same category)
What do life tables help us to do?
help us estimate these parameters that will determine population growth
What is λ?
λ = finite rate of increase. When measuring growth per specific time period (usually per year)
What does an R0 of 0.51 mean about the reproduction for that species?
It means that the population will be halved as there is only have the number of offspring (2 parents - 1 offspring)
What 2 parameters does R0 describe in semelparous species?
1. The number of offspring produced on average by an individual over the course of its life
2. The multiplication factor that converted an original population size into a new population size one generation later
What is R0 measured across?
R0 is a rate measured across a lifespan: the average lifetime production of offspring.
In semelparous species what does R0 equal? Why do we have to estimate it in iteroparous species?
R0 = R, but not in iteroparous species, that is why we have to estimate R
What does R combine?
R combines the birth of new individuals with the survival of existing individuals
When does λ = R?
λ = R if the growth rate per year and the growth per generation are the same. This is the case in semelparous species or species that live only one year (R ≠ λ when T ≠ 1 year)
What does Tc approximate?
Tc only approximates the true generation time T because it doesn't allow for some offspring to develop and reproduce during the reproductive life of the parent.
So we can measure R as:
R = er
λ = er
r = lnR
r = lnλ
What would R0 = 2 mean and why?
R₀ is a multiplier per generation. Example: R₀ = 2 means each female replaces herself with two daughters, so the population doubles every generation
What does r = 0.05 mean about the population and why?
r is a continuous per-capita rate of increase. Example: r = 0.05 means the population grows at about 5% per year, continuously
If r = 0.05 then what does R equal and why?
R is the continuous-time multiplier derived from r. Example: if r = 0.05, then
R = eʳ ≈ 1.05, meaning the population is 5% larger each year in continuous time
What does λ = 1.1 mean about the population and why?
λ is a multiplier per time step. Example: λ = 1.1 means the population increases by 10% each year
When does population grow?
Population grows when:
R or λ > 1
r > 0
When is population stationary?
Population is stationary when:
R or λ = 1
r = 0
When does population decrease?
Population decreases when:
R or λ < 1
r < 0
What is the difference between a cohort and a static life table?
A cohort life table follows a specific group of individuals (a cohort) throughout their lives to observe their mortality rates over time, while a static (or period) life table provides a snapshot of mortality rates for different age groups at a single point in time using cross-sectional data
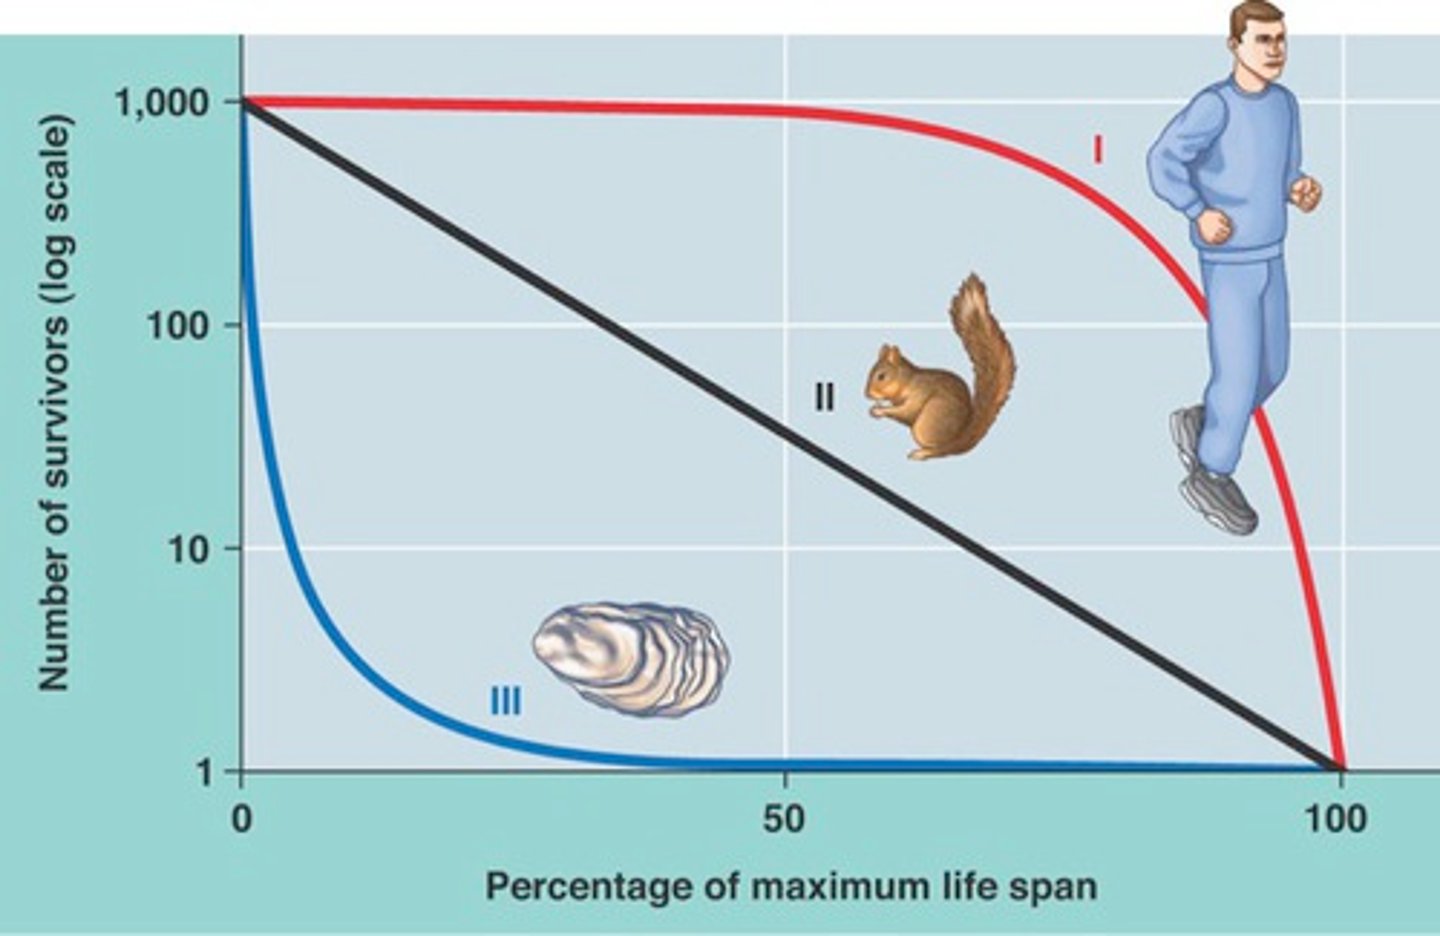
How many types of survivorship curves are there?
3
Type I
Type II
Type III
What is a type 1 survivorship curve?
Mortality is concentrated toward the maximum ages of individuals
High juvenile survival, typical of mammals that invest in somatic growth over reproductive output
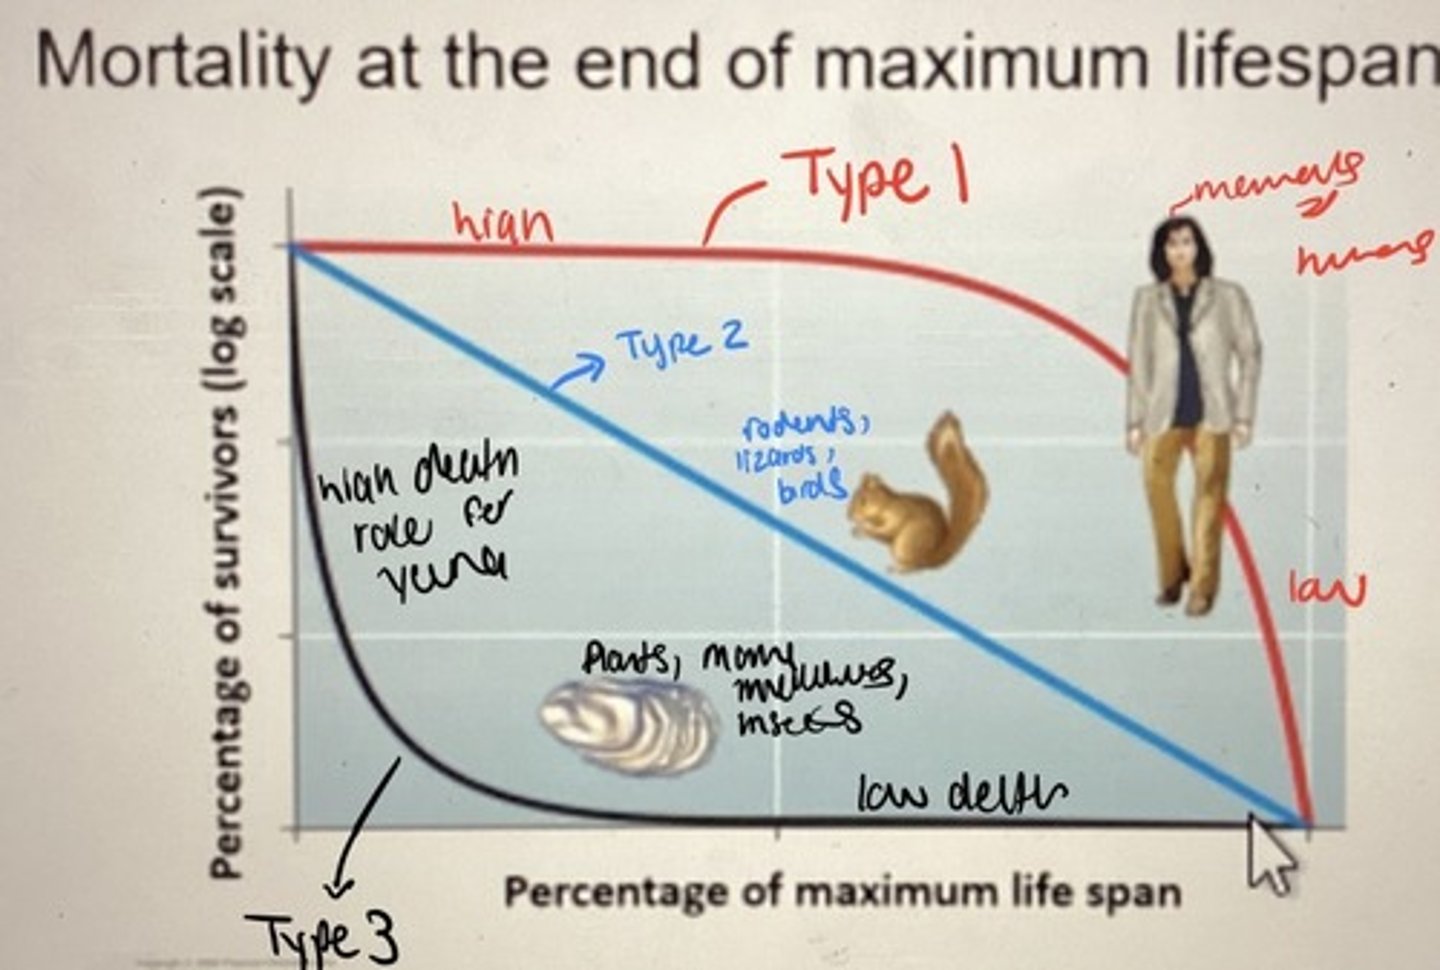
What is a type II survivorship curve?
Mortality is spread more equally
Age-independent probability of dying, typical of birds and plants with seed banks (exampleshows constant ~85% mortality from 0-2, 2-4, etc)
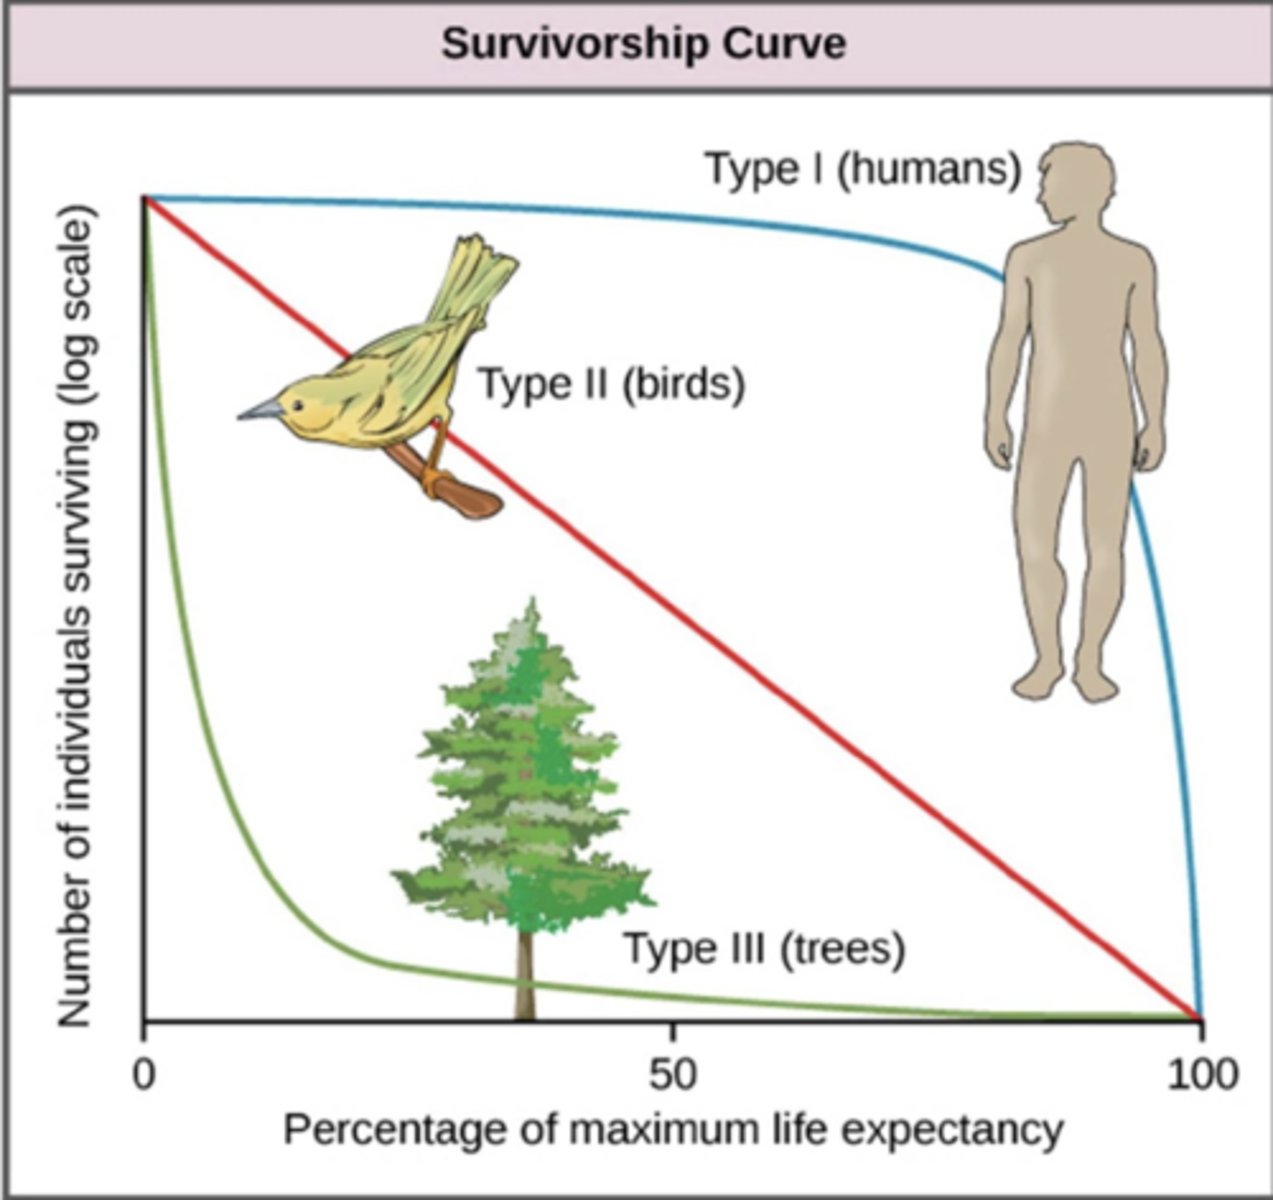
What is a type III survivorship curve?
High early-stage mortality but a relatively low death rate after that
Low juvenile survival, typical of insects and marine species that invest in reproductive output over somatic growth