SSCI 125 Final Exam
1/62
There's no tags or description
Looks like no tags are added yet.
Name | Mastery | Learn | Test | Matching | Spaced | Call with Kai |
|---|
No analytics yet
Send a link to your students to track their progress
63 Terms
Geographic Information System (GIS)
A computer system that stores, analyzes, and displays geographic data
Geographic Information Science (GISc)
Field that redefined geographic concepts and their use in the context of geographic information systems
GISc also examines the impacts of GIS on individuals and society, and the influences of society on GIS
Spatial Sciences
study of spatial patterns and relationships, and environmental interactions
interdisciplinary field including disciplines like geography, cartography, and urban planning, as well as other environment-adjacent disciplines, like logistics, security, ecology, health, and archaeology
Base Maps
the foundational, reference map layer on which other data layers are overlaid in a geographic information system (GIS)
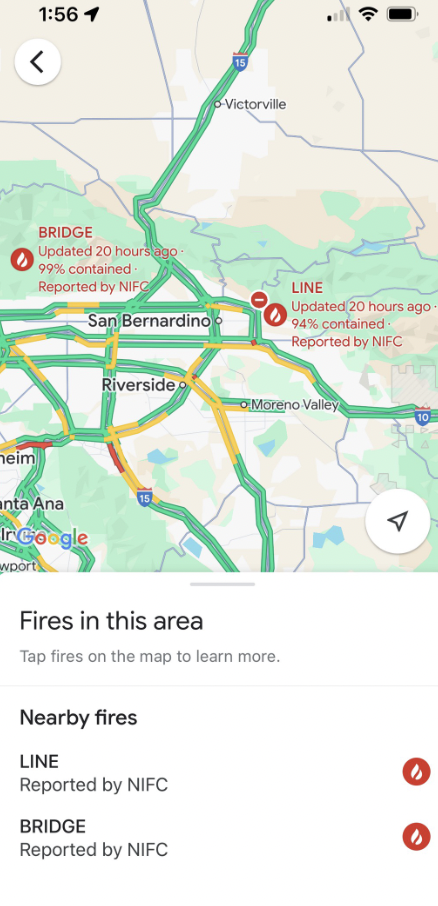
Reference Maps
a type of map that displays the location and boundaries of geographic features and political divisions for the purpose of providing a general overview of a place (like traffic maps)
Thematic Maps
a type of map designed to showcase a specific theme or subject within a geographic area—>a map that tells a story
Geoenrichment
the process of enhancing existing geographic data by adding location-based information, like demographics, lifestyle data, or consumer behavior, to it.
Representational model
simplification of reality
in spatial sciences: representational models are used to visually convey spatial information and geographic phenomena
used to understand/depict complex interactions between human activities and the social/political/physical environment
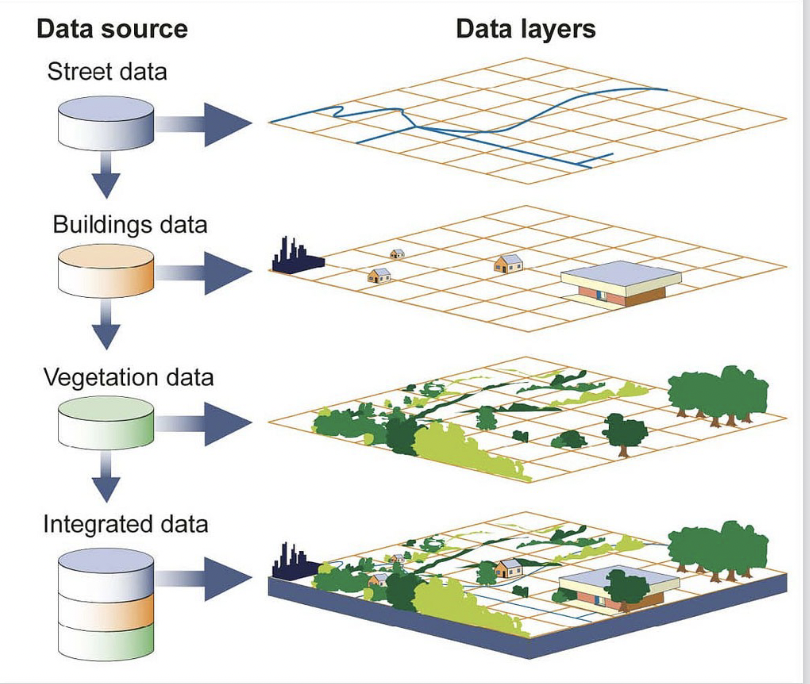
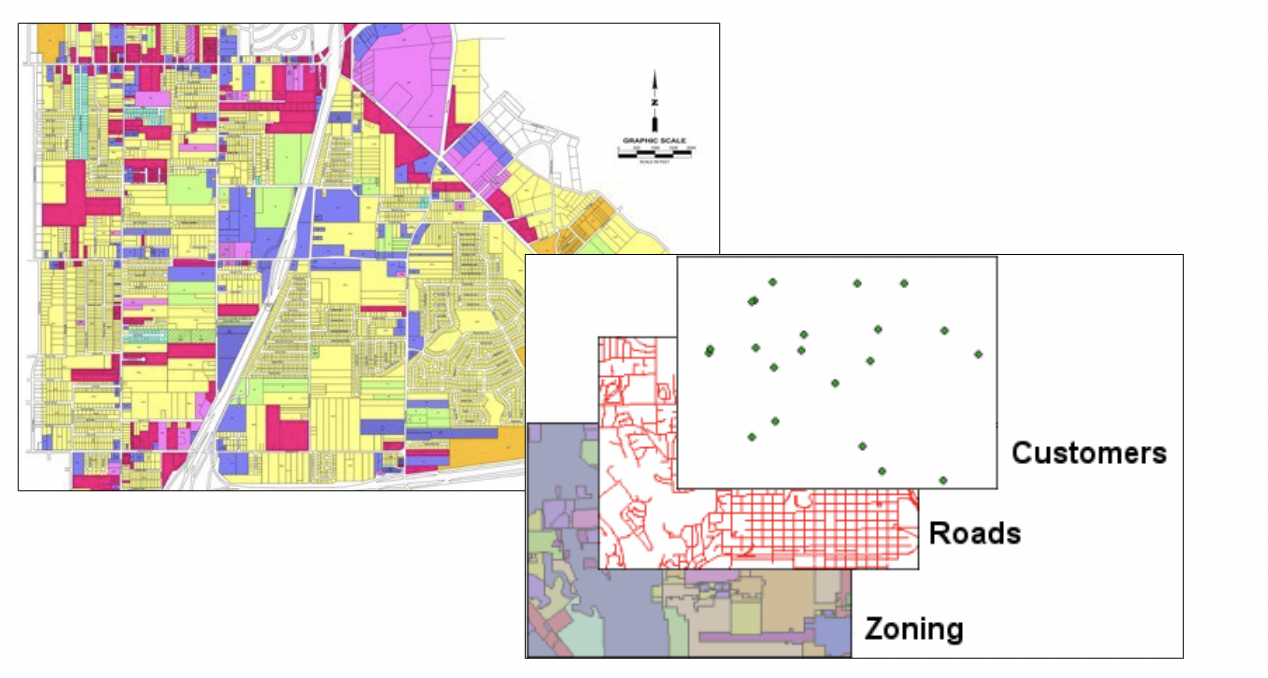
Layers
layer model is preferred representation of spatial phenomenon within GIS
stack layers to model reality
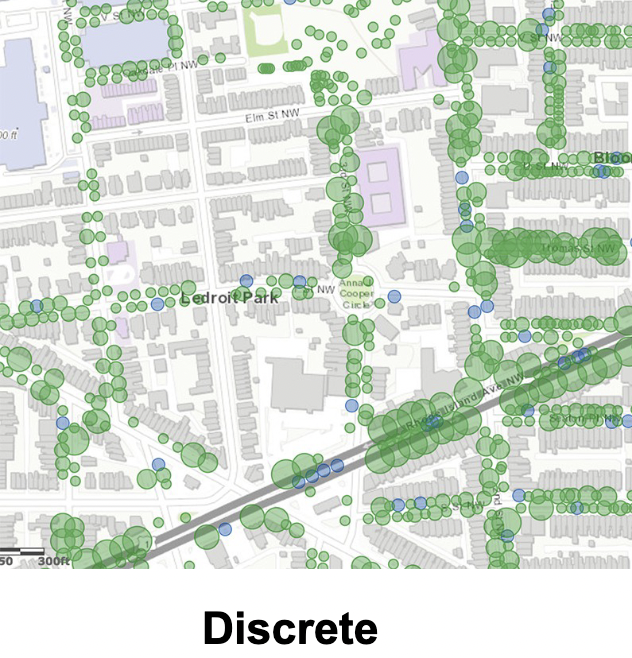
Discrete data
Independent numbers, abrupt boundaries
categorical/discontinuous data, represents objects within distinct boundaries like buildings, roads, lakes
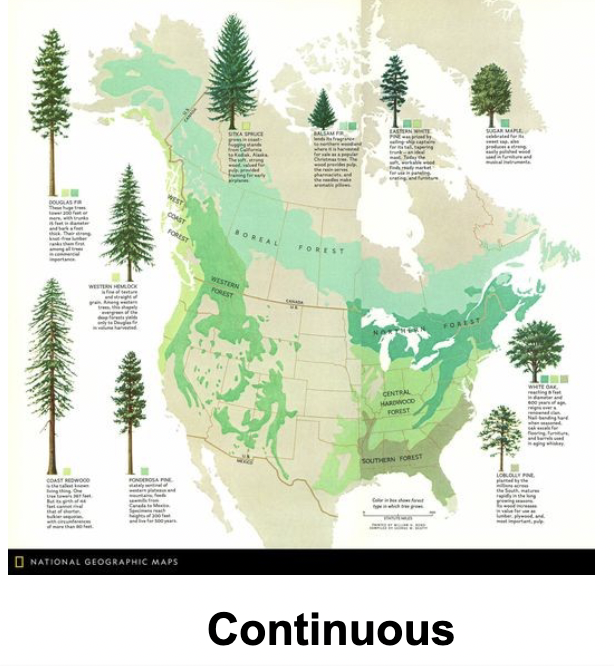
Continuous
represents phenomena where values vary smoothly across a surface, like elevation, temperature, or rainfall
Vector Types
Points, lines, polygones
Vector/Vector Data
represents geographic features as points, lines, and polygons, defined by coordinates and associated attribute data
These geometric shapes represent discrete features like buildings, roads, and boundaries. Vector data stores information as a collection of points, lines, and polygons, each with its own unique ID and attribute data, allowing for efficient querying and analysis
Vector Data Storage
Points are stored by their coordinates and have no dimensions
Lines and polygons are built from points
Lines have a direction in the ordering of the points and ave no width
Polygons can be built from points or lines
Spatial locations are explicit in the data model
Advantages of vectors
can zoom in on the screen and see smooth edges, independent of scale
Can be scaled to any size and retain sharpness
useful for geometic images
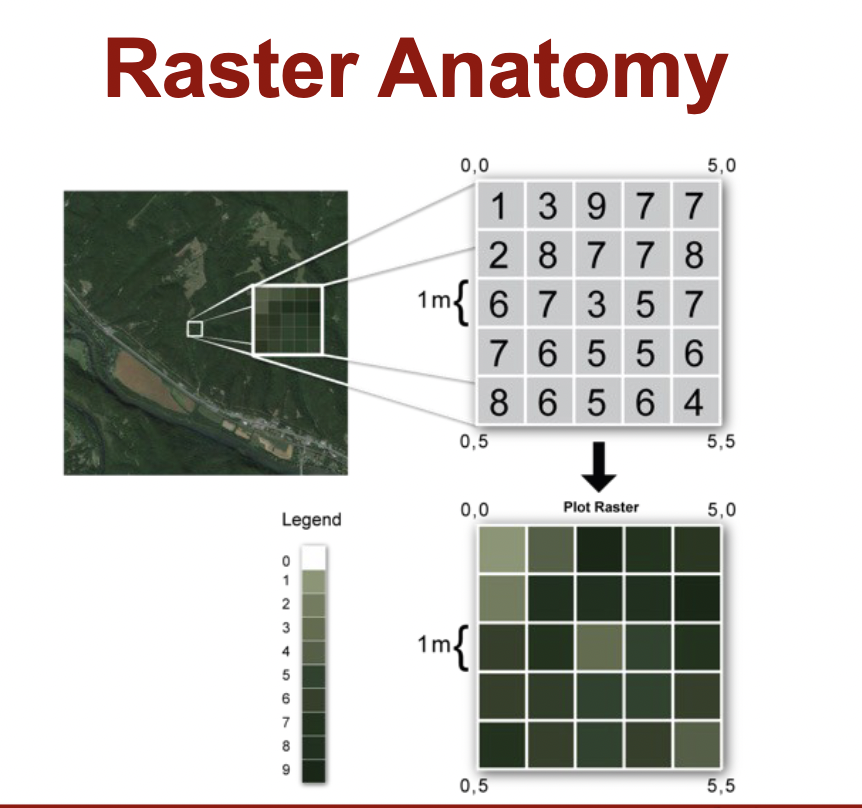
Raster
consists of a matrix of cells (or pixels)
Organized as a grid
Each cell contains a value representing information, like temperature
Examples: imagery from satellites, digital aerial photographs, scanned maps, modeled/interpolated surfaces (like AQI)
When to use raster vs vector
Vector is best suited for discrete data, like roads or parcels, that have clear boundaries
Raster data more suitable for continuous data, like temperature or elevation, where values vary smoothly
Raster Data Storage
Location is defined by place in the array
Entire array has to be placed on geographic coordinates
Each grid has one values, even if it’s “missing”
A cell has a resolution, given the cell size in ground units
Raster Advantages
Simple data structure
Mathematical modeling is easy because all spatial entites have a simple, regular shape
Technology is cheap
Growing availability
Raster Disadvantages
Large volumes of data
Grid resolution introduces modifiable data problem
Crude raster maps look pixelated and ugly
Coordinate transformations are difficult
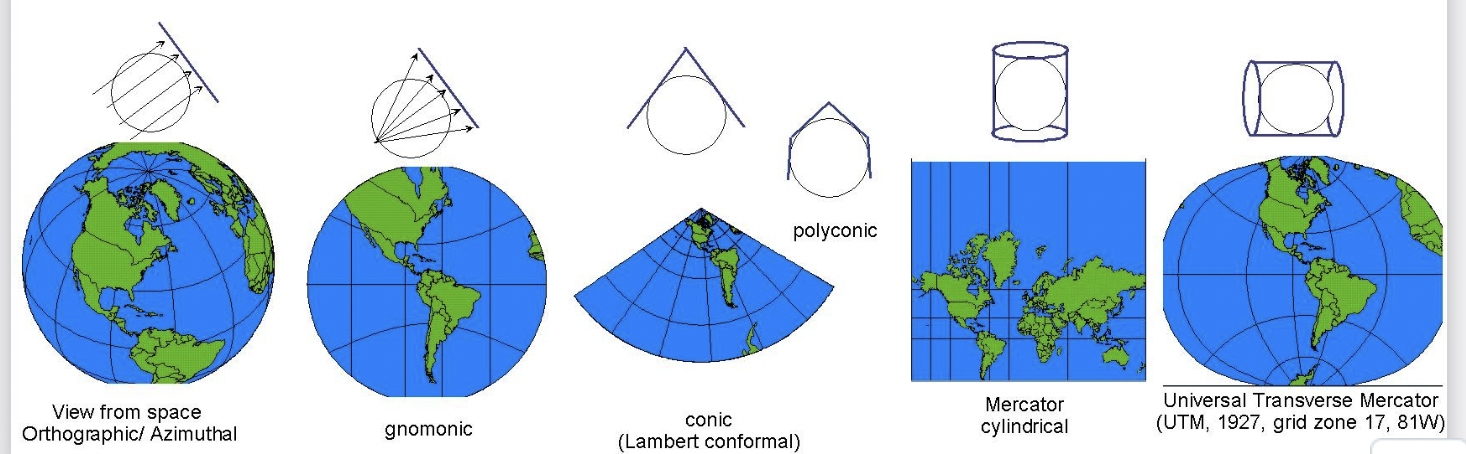
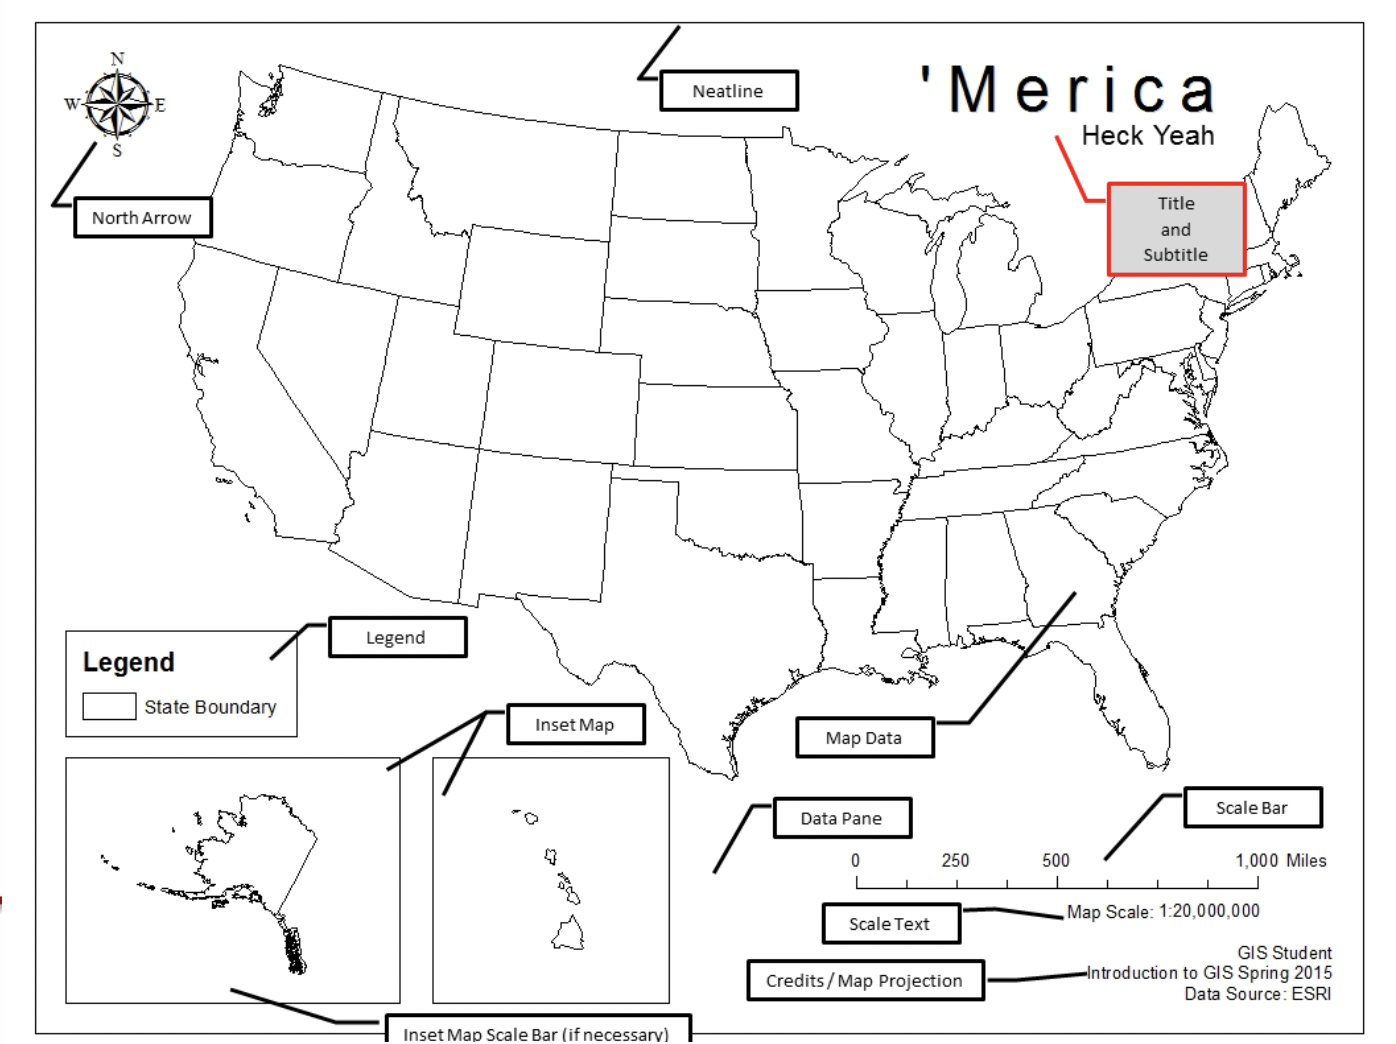
Mapped Area
Region of Earth being mapped
The shape of the mapped area is influential (use of projections)
Legend Design
Symbols on the left, definitions on the right
Legend symbols must be identical to map symbols
Organize symbols by types (points, lines, polygons) and themes
Linear map features need linear legend symbols
Color is only part of a map symbol
Definitions: clear, legible text | horizontally aligned with symbols
Insets
Smaller map within larger map
4 purposes of insets: for locational information, clarify congested areas, to show related topics, to show related locations (like Alaska and Hawaii in the US)
Orientation
Gives the direction of the map
Usually indicated with a north arrow OR a graticule
Simple and subtle is best
Map users expect that True North is at the top of a map
North Arrows are needed when: true north is not at the top, the map will be used for navigation, surveying, or orienteering
Scale
Ratio of Map Distance to Earth Distance (1:25,000)
Scale can be expressed: with a representative fraction, with text, with a graphic
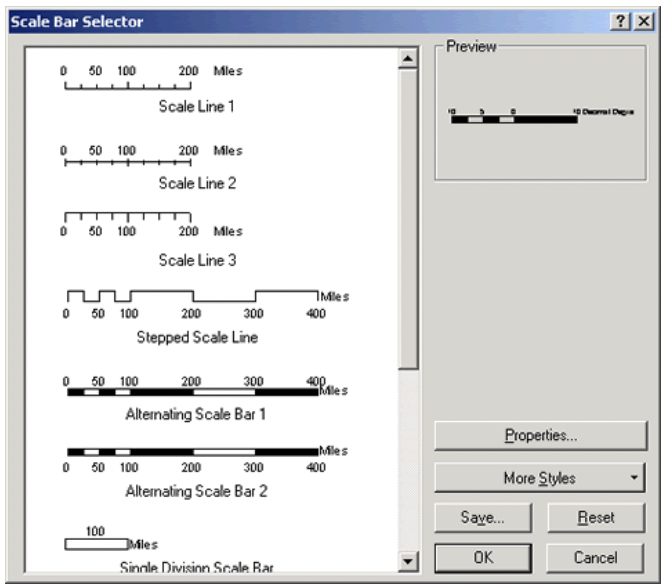
Scale Placement
About as subtle as the data source
Purpose is to inform, not attract attention
Fine line weights
Type should be among the smallest on the map
Units/length should be considered
Don’t forget inset maps
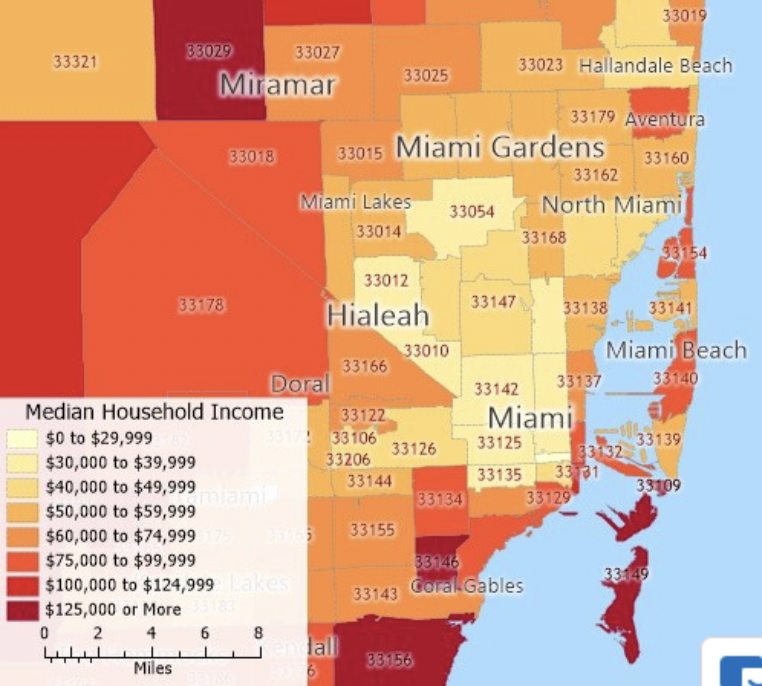
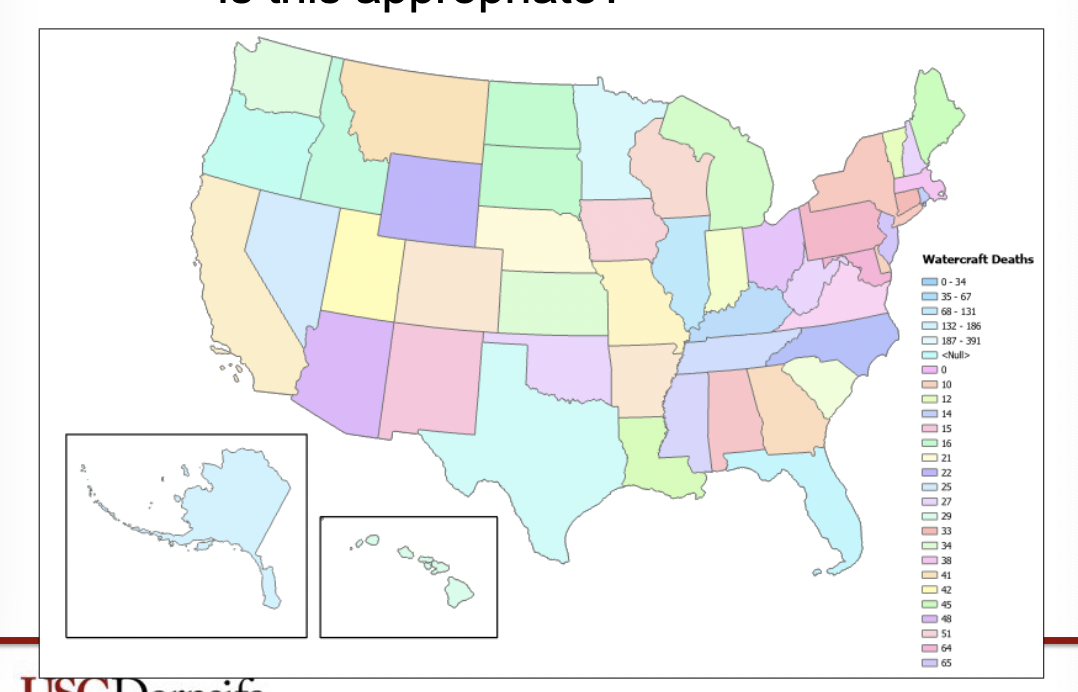
Choropleth Maps
uses differences in shading, coloring, or the placing of symbols within predefined areas to indicate the average values of a property or quantity in those areas
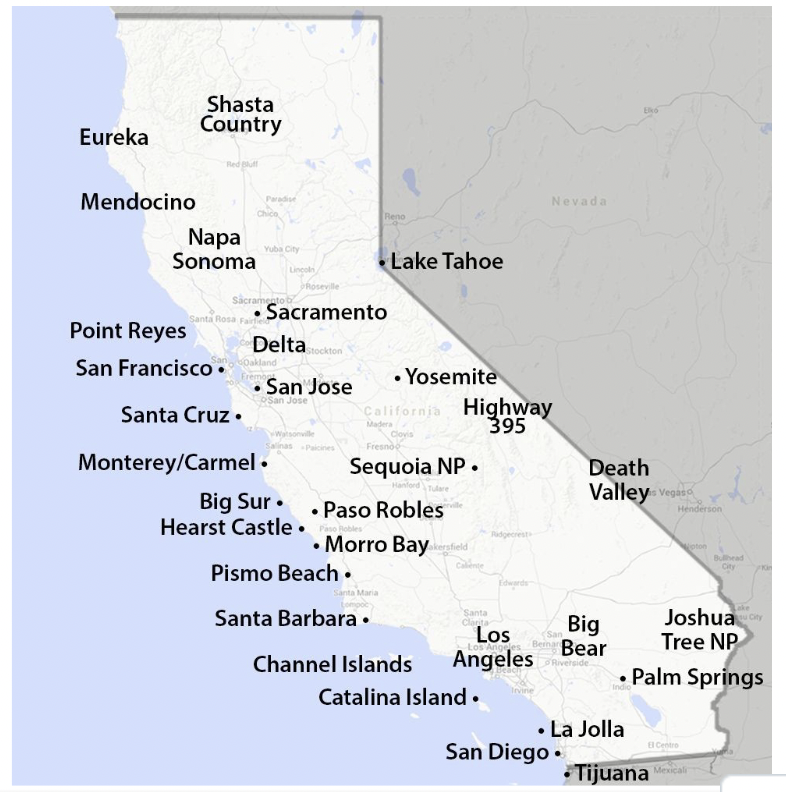
Point Feature Maps
Show the frequency at which the selected geographical phenomena occur, by displaying each individual occurrence as a dot
Points can by symbolized with different sizes to denote magnitude
Proportional symbols
Proportional symbol maps use symbols—usually circles—whose size varies in proportion to a data value at a specific location. They are similar to unclassed choropleth maps in that they represent data on a continuous scale rather than grouping values into categories.
akin to unclassed choropleth maps
Continuous scale
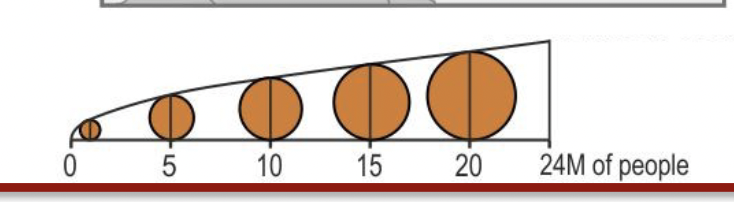
Graduated symbols
Graduated symbol maps represent data using symbols (often circles) whose sizes vary based on classified data ranges, rather than a continuous scale like proportional symbols. The values are grouped into categories using a classification scheme (e.g., natural breaks, quantiles, equal intervals)
Dot Density Maps
Each point represents a value of more than one occurrence of the mapped phenomena
Ex: one dot could represent 1000 people
One to many dot density maps are used when phenomena may be difficult to display one at a time
Bandwidth
radius length
Pointillism
artistic technique that relies on the ability of the eye and mind of the viewer to blend the colors of the dots into a fuller range of tones
Analogous to the four-color CMYK printing process used by some color printers and large presses that place dots of cyan, magenta, yellow, and key onto a white paper
Isolines
connect values of the same magnittude acorss the entire map
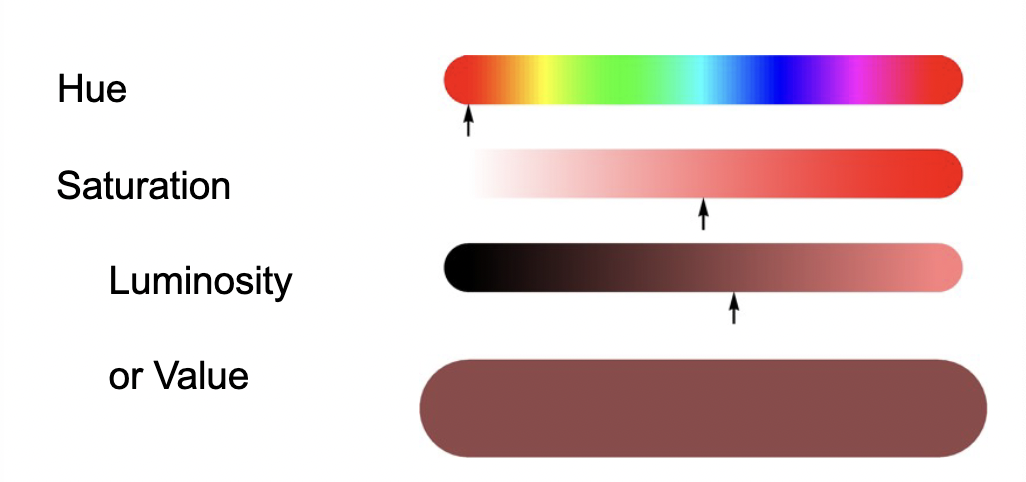
Hue
Rainbow is made up of spectral hues
Pure color
Luminosity
Brightness
Measure of lightness and darkness (matched against a gray scale)
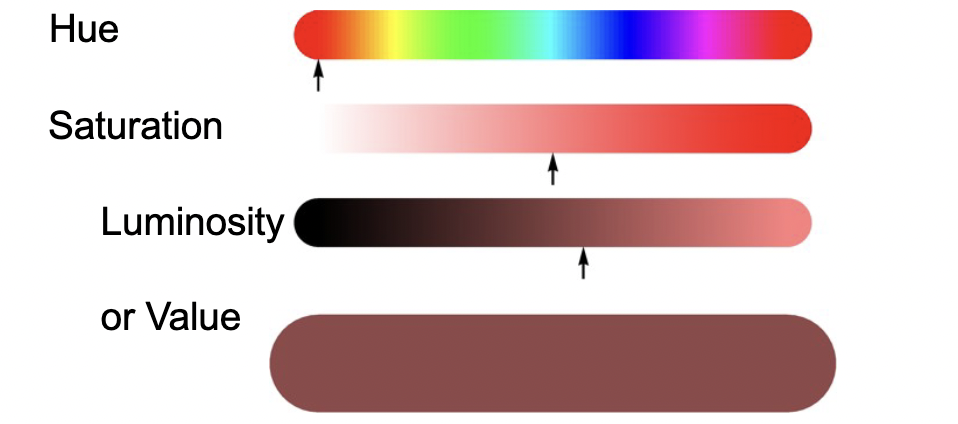
HSV
hue, saturation, value
Spatial Scale
Scale of analysis
Country, state, census divison
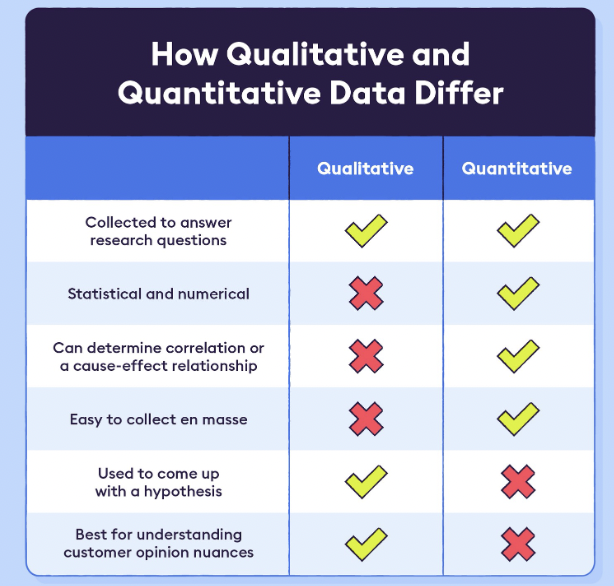
Quantitative data vs qualitative data
numbers vs description/observations
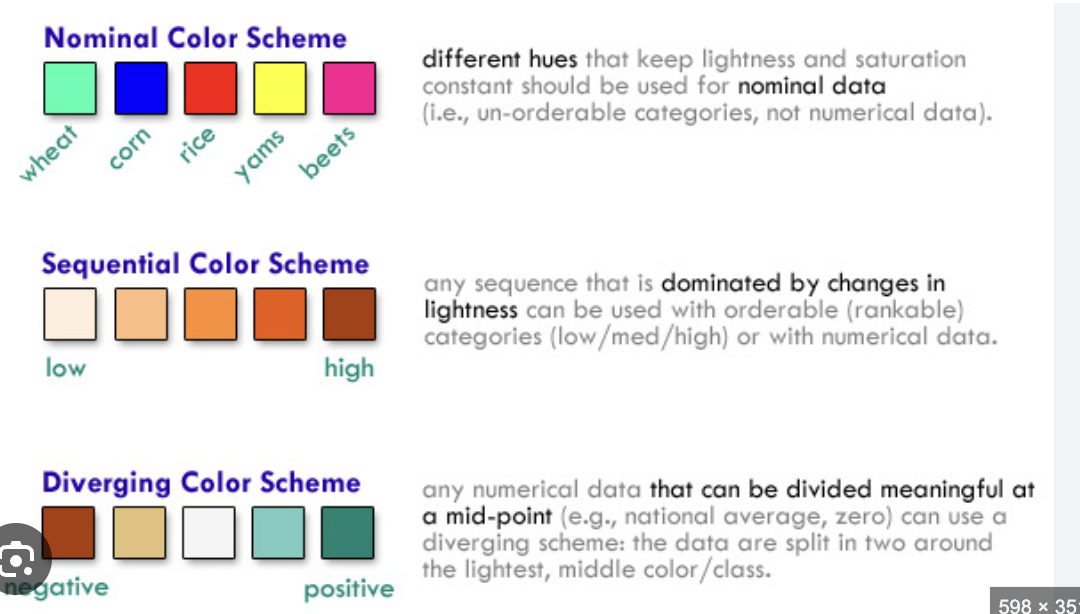
Categorical color scheme
uses distinct colors to represent different categories or groups of data, without implying any order or magnitude

Diverging color scheme
pairs sequential schemes based on two different hues so that they diverge from a shared light color, from the critical midpoint, toward dark colors of different hues at each extreme.

Sequential Colors
Sequential data classes are logically arranged from high to low, and this stepped sequence of categories should be represented by sequential lightness steps
Rates
x /per _
GPS
Global Positioning System
GPS=American GNSS
Global Navigation Satellite Systems (GNSS)
Network of satellites and supporting systems that provide locational data for geolocation
China GNSS
Beidou
EU GNSS
Galileo
Russia GNSS
Glonass
Geosynchronous orbits
match earth’s spin (24-hour orbits); return to the same spot in the sky every 24 hours
Geostationary orbits
equatorial geosynchronous orbits (stay in the same spot in the sky)
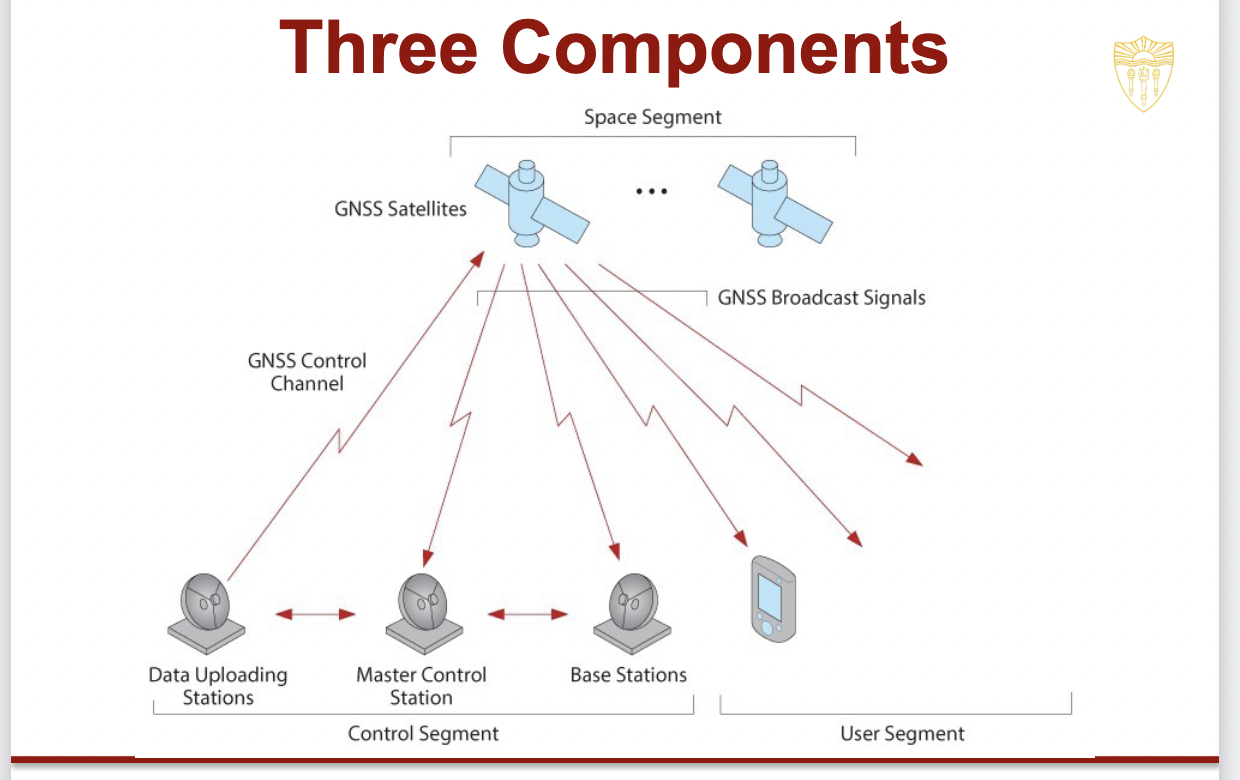
Space segment
What it is: The satellites orbiting the Earth.
Function: Constantly send out radio signals that contain timing and location data.
In the diagram: Represented by the satellites at the top, transmitting GNSS broadcast signals downward.

Control segment
What it is: The network of ground stations that monitor, manage, and correct the satellites.
Includes:
Master Control Station: Central hub for managing the system.
Data Uploading Stations: Send updated information (like clock corrections) to satellites.
Base Stations: Monitor satellite signals and send feedback to the master station.
Function: Ensures satellite signals are accurate and up-to-date.
In the diagram: Ground dishes communicating both with each other and the satellites via the GNSS control channel.

User Segment
What it is: The GNSS receivers—like those in your phone, car, or survey equipment.
Function: Receives satellite signals and calculates precise location using trilateration.
In the diagram: Shown as a handheld GPS receiver on the bottom right, receiving signals from multiple satellites.
Receivers
devices the receive communication from satellites
Passive, provide for one-way communication from satellite to receiver only
Receivers can communicate with various GNSS satellite systems
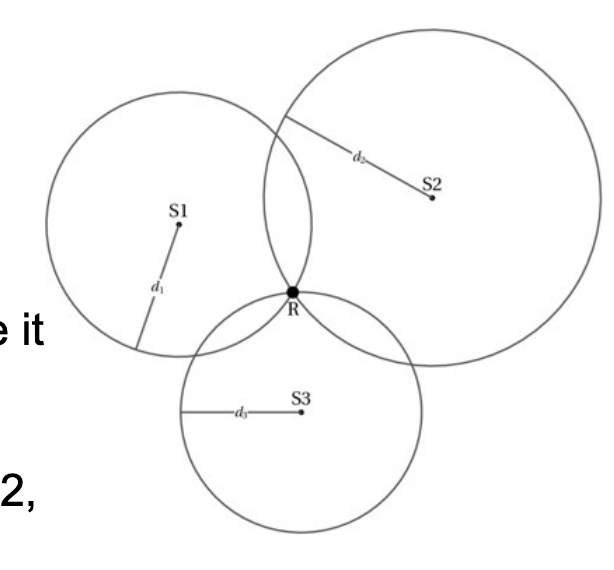
Trilateration
Determination of a location using a series of distance measurements to other known locations
If we do not know the location of R, we can figure it out if we know three locations (s1, s2, s3) and R’s distance to them (d1, d2, d3)
Multipath Errors
When the signal is reflected off of an object and is delayed in reaching the receiver, the timing is off
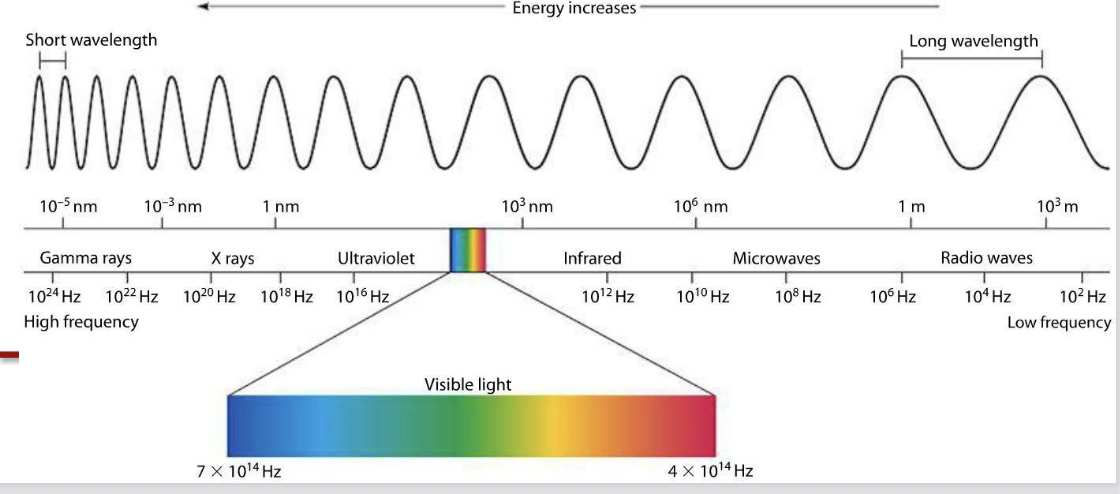
Electro-magnetic Radiation
sensors detect energy in different parts of the electromagnetic spectrum
we can divide this spectrum into bands based on how the light energy is organized and measured
Object Identification
Objects of the same type yield similar types and amounts of radiation
A particular pattern of radiation can identify objects, and is referred to as an object’s spectral signature
All objects above 0K emit radiation and can be sensed
Active Sensing
remote sensor emits energy source and detects response from object
LiDAR, RADAR, SONAR
Passive Sensing
Remote sensor collects Red, Green, Blue, NIR Spectrum
Satellite imagery (LANDSAT)
Photography
LiDAR
Always active—>measures the 3D distance between an object and the sensor (UV, visible, and NIR bands)
Radar
radio waves