Topic #4: Protein Function #2--Enzymes pt2
1/32
There's no tags or description
Looks like no tags are added yet.
Name | Mastery | Learn | Test | Matching | Spaced |
|---|
No study sessions yet.
33 Terms
Enzyme Catalyzed Rxns
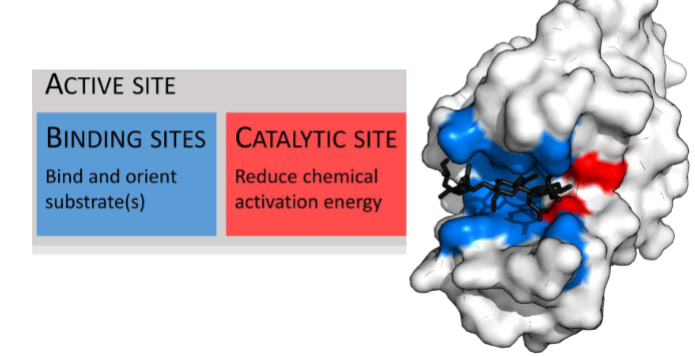
Enzymes Bind Substrates at Active SIte
Must have these two things
-catalytic site (cofactors, etc.)
Binding sites(
What allows substrates to bind?
Its complementary (types: geometrical, molecular, sterochemical complementarity)
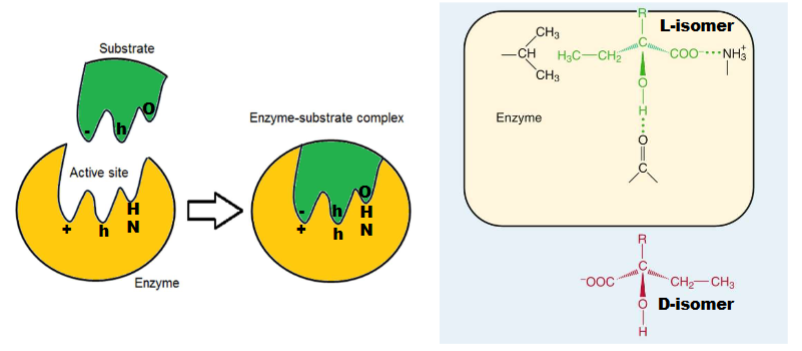
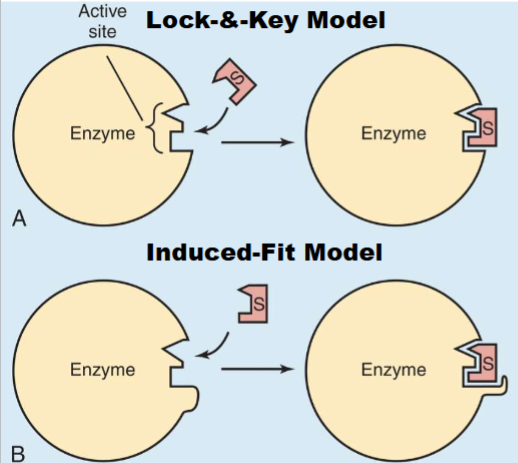
2 Models of Enzyme-Substrate Binding
1) Lock and Key: active site of enzyme perfect match for shape of substrate (rare)
2) Induced Fit Model: Active site is complementary to substrate (doesnt have to be perfect) bc when substrate binds causes shape of enzyme to change
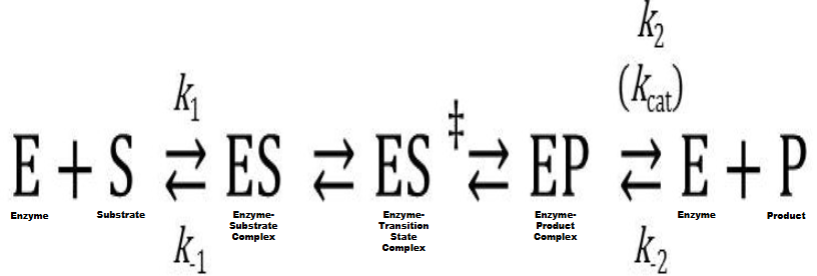
Transition State Formation & Stabilization
I. Transition state (temporary chemical species formed by collision of reactant
molecules that ceases to exist as product is formed; possesses high energy &
extreme instability) formation is rate-determining (rate-limiting) step
in all chemical reactionsA. Activation energy (ΔGact) is amount of free energy required to cause transition state formation
II. Enzymes work by stabilizing transition state
A. Lowers amount of ΔGact needed to form transition state
1. Increases rate of chemical reaction
2. Doesn’t alter chemical equilibrium or thermodynamics of a chem. rxn (cant control if rxn is energy releasing or consuming)
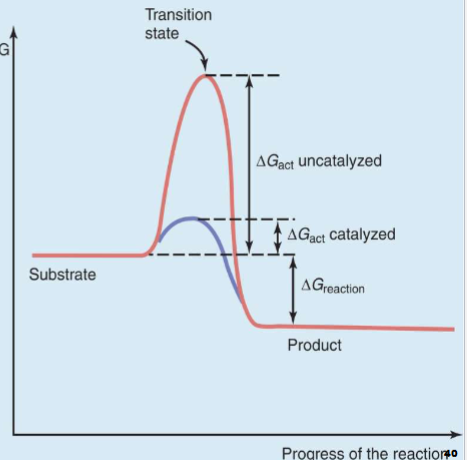
Chem. Rxn Energy Diagram
y: level of free energy in system
x-axis: progress of rxn
red line
first take substrate to transition state, necessary energy is activation energy
At transition state move past it to make product
Rxn that release energy so favorable (exergonic)
Blue line
as energy formed needs stabilizing but doesnt need as much energy and effort so rxn is faster (what catalysts do)
Enzyme Catalytic Mechanisms pt 1 (wont draw)
I. Proximity & orientation effects on substrates (what all do)
A. Bind & immobilize substrates close to each other in proper orientation for chemical reaction to occur
II. General acid-base catalysis
A. Mediated by ionizable groups of AA residues of enzyme
III. Covalent catalysis (a transient covalent bond is formed between enzyme & substrate)
IV. Electrostatic catalysis (i.e., ionic interactions)
V. Preferential binding to transition state (bind greater affinity, stabalizes it more)
Enzyme Catalytic Mechanisms pt 2
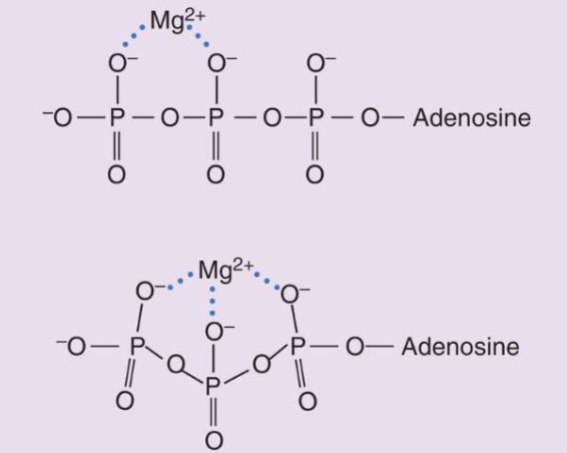
I. Metal ion catalysis (1/3 of all enzymes utilize this mechanism)
A. Metalloenzymes (possess tightly-bound transition metal ions to enzyme)
B. Metal-activated enzymes (possess loosely-bound alkali (group1) & alkali earth metal ions (group 2)
C. Metal ion catalytic mechanisms:
1. Help properly orient substrates
2. Involved in redox reactions
3. Provide electrostatic stabilization & shielding of negative charges (ex., ATP & Mg2+)
(ATP only usable when Mg Present)
Enzyme Kinetics
I. Study of rate of enzyme-catalyzed reactions
A. Sheds light on several phenomena:
1. Enzyme affinity determination
2. Enzyme kcat determination
3. Enzyme catalytic mechanism determination
4. Enzyme role in metabolism determination
5. Biochemical & clinical analyses of enzymes
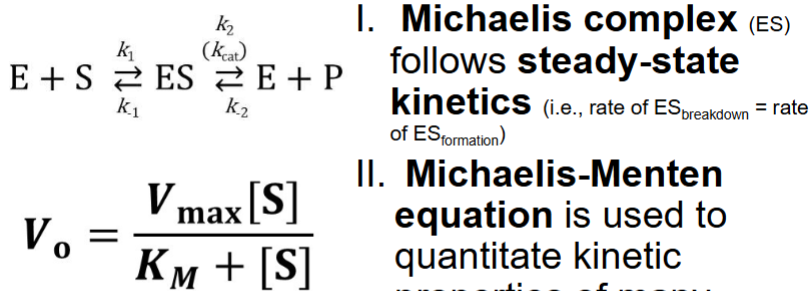
Michaelis-Menten Kinetics (just know what equation is and what tells you)
I. Michaelis complex (ES) follows steady-state kinetics (i.e., rate of ES breakdown = rate of ES formation) - rxn stays constant (ES constant present and stays constant)
II. Michaelis-Menten equation is used to quantitate kinetic properties of many
enzymes
Michaelis-Menten Kinetics pt2
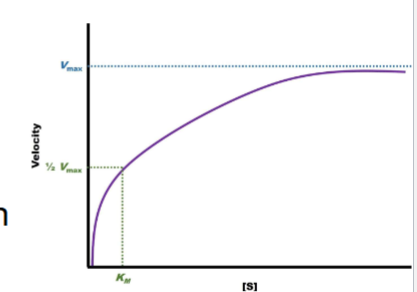
I. Vo: initial velocity (rate before 10% of substrate converted to product)
II. Vmax: maximum velocity (rate at saturating [S])
III. Km: Michaelis constant
A. Quantitative measure of enzyme affinity for substrate
B. [S] at which 50% enzyme molecules are bound to substrate
1. [S] = ½ Vmax
IV. When [S] >>> KM, Vo ≈ Vmax
V. When [S] = KM, Vo ≈ ½ Vmax
(doesnt hold true for all enzymes and can only bind to one substrate)
![<ul><li><p><span style="color: rgb(0, 0, 0);">I. <strong>Vo: initial velocity </strong>(rate before 10% of substrate converted to product)</span></p></li><li><p><span style="color: rgb(0, 0, 0);">II. <strong>Vmax: maximum velocity </strong>(rate at saturating [S])</span></p></li><li><p><span style="color: rgb(0, 0, 0);">III. <strong>Km: Michaelis constant</strong></span></p><ul><li><p><span style="color: rgb(0, 0, 0);">A. Quantitative measure of enzyme affinity for substrate</span></p></li><li><p><span style="color: rgb(0, 0, 0);">B. [S] at which 50% enzyme molecules are bound to substrate</span></p></li></ul></li><li><p><span style="color: rgb(0, 0, 0);">1. [S] = ½ Vmax</span></p></li><li><p><span style="color: rgb(0, 0, 0);">IV. When [S] >>> KM, Vo ≈ Vmax</span></p></li><li><p><span style="color: rgb(0, 0, 0);">V. When [S] = KM, Vo ≈ ½ Vmax<br></span></p></li></ul><p>(doesnt hold true for all enzymes and can only bind to one substrate)</p>](https://knowt-user-attachments.s3.amazonaws.com/ece59025-072f-4a35-b3d7-4b6baa9a101b.png)
Catalytically Perfect Enzyme
I. kcat/KM = specificity constant
A. Measure of the catalytic efficiency of an enzyme
B. Predictor of enzyme-catalyzed reaction rate when [S] is <<<< KM
II. Catalytically perfect enzyme has a diffusion-controlled rate (i.e., only rate limiting factor is rate of substrate diffusion to enzyme’s active site)
A. Specificity constant of these enzymes = rate of substrate diffusion
B. Ex: acetylcholinesterase, carbonic anhydrase, fumarase, triosephosphate isomerase, & beta-lactamase
Graphing Michaelis-Menten Kinetic Data
I. Data obtained from enzyme obeying Michaelis-Menten kinetics will produce a rectangular hyperbolic graph with + slope on an arithmetic scale
A. Can be used to infer Vmax & Km of enzyme
-rectangular hyperbolic graph if obey rules (for graph)
can look for vmax where it plateaus, can also infer km (1/2 of Vmax)
Order KInetics
I. When [S] <<< KM, Michaelis-Menten enzyme- catalyzed reaction displays 1st-order kinetics
A. Rate is directly proportional to [S]
II. When [S] >>> KM (i.e., when rate approaches Vmax), Michaelis-Menten enzyme-catalyzed reaction displays zero-order kinetics
A. Rate is independent of [S]
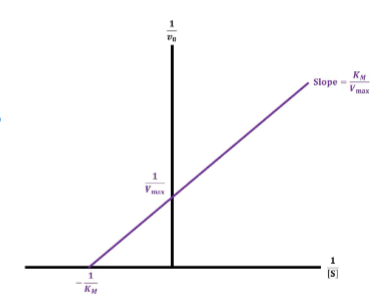
Lineweaver-Burk Plot (used to determine rather than using calculus) (wont calc. know what htey do and interpret them)
I. Data obtained from enzyme obeying Michaelis-Menten kinetics are graphed on an arithmetic scale as reciprocals (Double Reciprocal Plot)
A. Will produce linear graph with + slope
1. Can be used to more easily infer Vmax & KM of enzyme (but not necessarily more accurately)
Substrate Half-Life (t½) pt1
I. Time required for [S] to be reduced by ½
II. Can be determined for 1st-order reactions (purple graph), but not for zero order reactions (red graph)
A. Rate of a zero-order reaction remains constant (i.e., independent of S])
1. Constant amount of substrate decreases/unit time (e.g., 10 mg/h)
i. In this type of chemical reaction, t1/2 is constantly changing
(cant determine half life for 0 order conc. bc always constant amount)
Substrate Half-Life (t½) pt2
I. Rate of a 1st-order reaction decreases over time (i.e., dependent on [S])
A. Constant % of substrate decreases/unit time (e.g., 20%/h)
1. In this type of chemical reaction, t1/2 remains constant
B. Most physiological processes follow 1st-order kinetics
![<ul><li><p><span style="color: rgb(0, 0, 0);">I. Rate of a 1st-order reaction decreases over time (i.e., dependent on [S])</span></p><ul><li><p><span style="color: rgb(0, 0, 0);">A. Constant % of substrate decreases/unit time (e.g., 20%/h)</span></p><ul><li><p><span style="color: rgb(0, 0, 0);">1. In this type of chemical reaction, t1/2 remains constant</span></p></li></ul></li></ul></li><li><p><span style="color: rgb(0, 0, 0);">B. Most physiological processes follow 1st-order kinetics</span></p></li></ul><p></p>](https://knowt-user-attachments.s3.amazonaws.com/f2cb06ee-61e1-475b-a442-750b94e7d445.png)
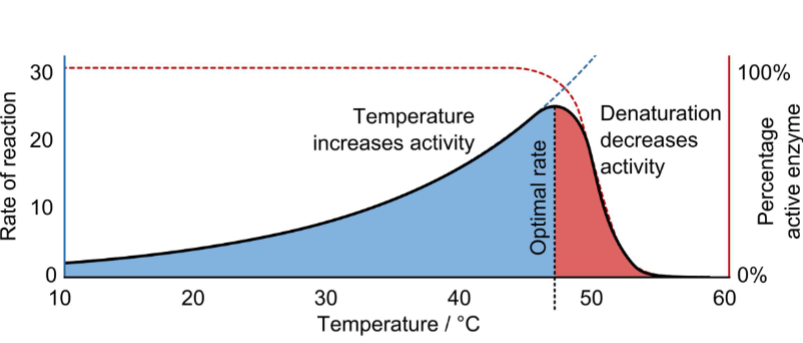
Temperature-Dependence of Enzyme Activity pt1
I. In general, rates of chemical reactions are accelerated by increasing temperature & decelerated by decreasing temperature
A. The more G‡ required to get a chemical reaction to occur, the more the reaction is temperature-dependent
B. Changes in body temperature can positively or negatively affect enzyme activity
Temperature-Dependence of Enzyme Activity pt2
I. Dramatic increases or decreases in temperature are problematic for living organisms
A. Fever (hyperthermia): state of increased body temperature
1. Low-level fever helpful in immune response because it stimulates enzyme activity
2. High-level fever (> 43°C/ 105 F) can cause irreversible enzyme denaturation
B. Hypothermia: state of decreased body temperature
1. Decreases rate of enzymatic reactions (i.e., decreases metabolic rate of body; loss of vital organ functions occurs)
(temp. dependence based on enzyme activity for graph)
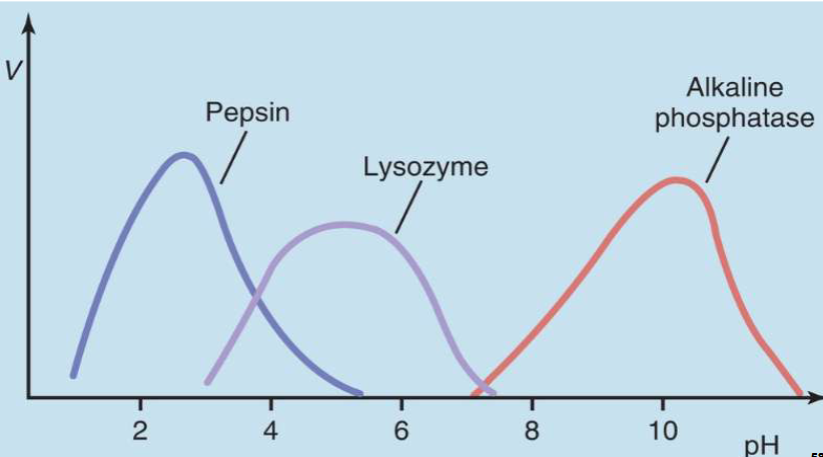
pH-Dependence of Enzyme Activity
I. Enzymes are pH sensitive
A. Because ionization state of catalytic AA is pH- dependent
1. Particularly true for His residue basic R-group
B. Because ionization state of AA residues that form intra- & intermolecular interactions necessary for higher order protein structures is pH-dependent
II. Most enzymes function at physiological pH (7.35 – 7.45)
A. This is why acidosis & alkalosis can be fatal
pH-Dependence of Enzyme Activity pt2
I. Some enzymes function at pH’s below or above normal physiological pH range
A. Usually, they are sequestered in specialized areas of cell/body where pH is different than rest of cell/body
1. E.g., acidic enzymes are found in lysosomes & stomach lumen
2. E.g., alkaline enzymes are found in mitochondrial matrix, bile duct, & small Intestine lumen
Inhibitor
I. Substance that binds to enzyme & temporarily or permanently blocks its catalytic activity
A. May interfere with enzyme’s binding of the substrate and/or enzyme’s catalytic action
B. In presence of inhibitor, enzyme’s ability to form product is compromised (especially if associated directly)
C. Classified based on molecular mechanism
1. Effects are measured kinetically
Competitive Inhibition pt1
1) competitve inhibiton: inhibitor and substrate both going after active site of enzyme as long as inhibitor bound substrate cant bind (gotta have chem features similar to substrate)
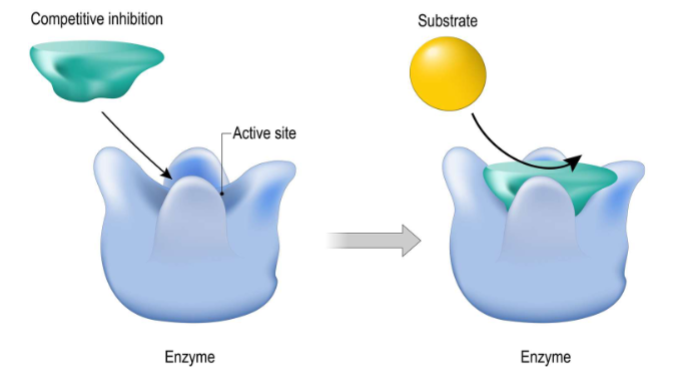
Competitive Inhibition pt 2
I. Competitive inhibitor is structurally like the substrate
II. Competitive inhibitor binding to active site is reversible (i.e., mediated by noncovalent interactions)
III. Increasing [S] can overcome competitive inhibitor’s effects
A. Competitive inhibitors work best at low [S]
(only able to bind to free enzyme, binding is reversible ) if more substrate can overcome effects of competitve inhibitors) work best with low substrate conc.
![<ul><li><p><span style="color: rgb(0, 0, 0);">I. Competitive inhibitor is structurally like the substrate</span></p></li><li><p><span style="color: rgb(0, 0, 0);">II. Competitive inhibitor binding to active site is reversible (i.e., mediated by noncovalent interactions)</span></p></li><li><p><span style="color: rgb(0, 0, 0);">III. Increasing [S] can overcome competitive inhibitor’s effects</span></p></li><li><p><span style="color: rgb(0, 0, 0);">A. Competitive inhibitors work best at low [S]<br></span></p></li></ul><p>(only able to bind to free enzyme, binding is reversible ) if more substrate can overcome effects of competitve inhibitors) work best with low substrate conc.</p>](https://knowt-user-attachments.s3.amazonaws.com/1a6c51a0-d32c-4c5c-81b2-e58a9b8cc203.png)
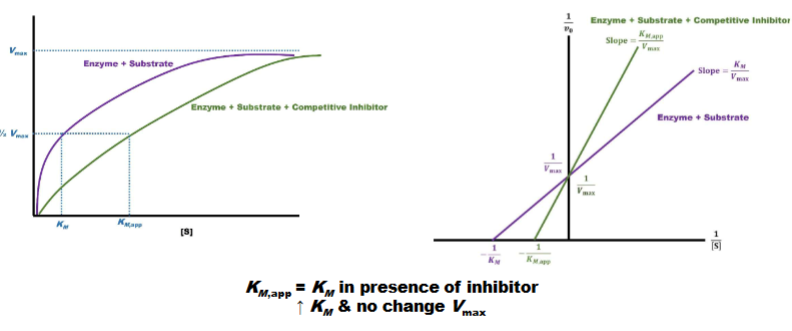
Competitive Inhibition pt 3
left: mechalis mention graph
graph is right shifted & hight is still same
tells you competitive inhibitors influence km not vmax
raise km no change vmax
right: line weaver burk plot
have same y-int. (1/vmax) but diff. x-int. closer to orgin
Q: might get 2 graphs asks what type of inhibitor is this
Noncompetitive Inhibiton
inhibitor not binding to active site but to alosteric site
can bind to free enzyme or ES (enzyme substrate) complex
don’t prevent substrate binding, prevent enzyme from catalyzing rxn
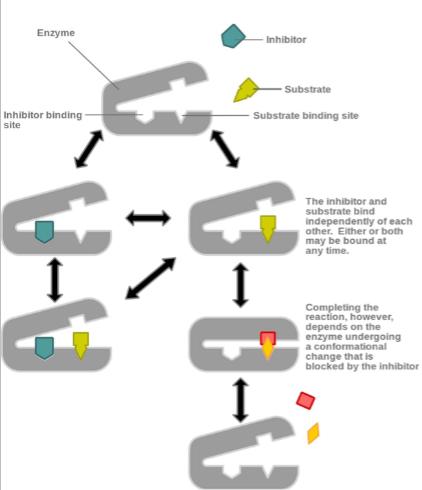
NOncompetitive Inhibiotn
I. Also called mixed inhibition
II. Noncompetitive inhibitor binding to allosteric site is reversible
(i.e., mediated by noncovalent interactions)III. Increasing [S] does not overcome noncompetitive inhibitor’s effects
![<ul><li><p><span style="color: rgb(0, 0, 0);">I. Also called <strong>mixed inhibition</strong></span></p></li><li><p><span style="color: rgb(0, 0, 0);">II. <strong>Noncompetitive inhibitor </strong>binding to allosteric site is reversible</span><span style="color: rgb(0, 0, 0);"><br></span><span style="color: rgb(0, 0, 0);">(i.e., mediated by noncovalent interactions)</span></p></li><li><p><span style="color: rgb(0, 0, 0);">III. Increasing [S] does not overcome noncompetitive inhibitor’s effects</span></p></li></ul><p></p>](https://knowt-user-attachments.s3.amazonaws.com/73be7b30-2ff3-45f7-bc59-a54067132210.png)
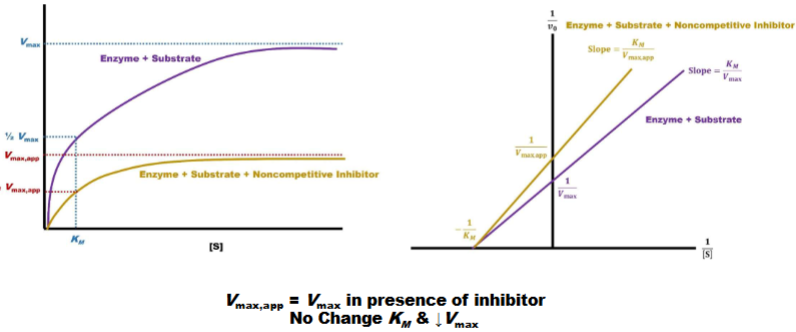
Noncompetitive Inhibition
1) michales menton left: km not shift so vmx effected, km not (vmax apparent)
2)line weaver burke (right); y-int. is farther from orgin (lower value) x-int. unchanged (vmax lower km unchanged)
Q:can ask where inhibitor binds and which one it is
Uncompetitive Inhibiton pt1
inhibitor bind only to ES complex
reversible binding as long as inhibitor present prevent product formation
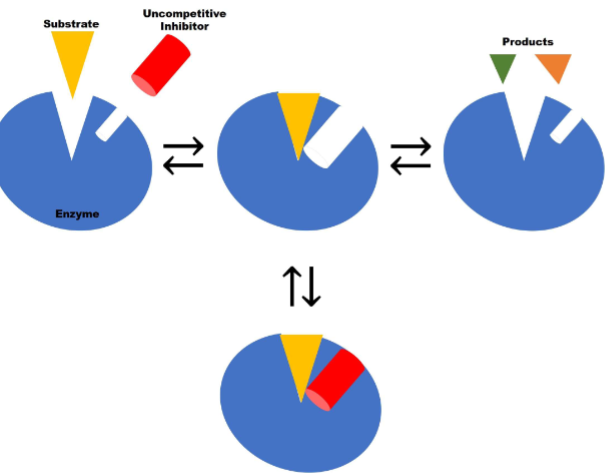
Uncompetitive Inhibiton pt2
I. Uncompetitive inhibitor binding to allosteric site is
reversible (i.e., mediated by noncovalent interactions)II. Increasing [S] makes uncompetitive inhibitor
more effective
![<ul><li><p><span style="color: rgb(0, 0, 0);">I. <strong>Uncompetitive inhibitor</strong> binding to allosteric site is</span><span style="color: rgb(0, 0, 0);"><br></span><span style="color: rgb(0, 0, 0);">reversible (i.e., mediated by noncovalent interactions)</span></p></li><li><p><span style="color: rgb(0, 0, 0);">II. Increasing [S] makes uncompetitive inhibitor</span><span style="color: rgb(0, 0, 0);"><br></span><span style="color: rgb(0, 0, 0);">more effective</span><span style="color: rgb(0, 0, 0);"><br></span></p></li></ul><p></p>](https://knowt-user-attachments.s3.amazonaws.com/2d28047d-1331-48c9-9177-9a867d405995.png)
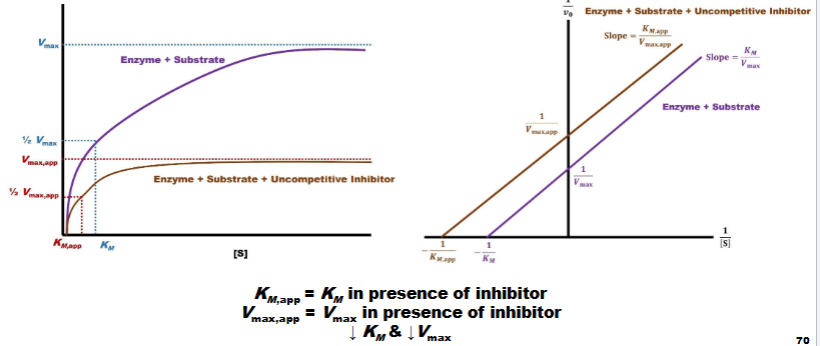
Uncompetitive Inhibition pt 3
left (Menton): slope reduced graph shifted (km value closer to orgin)
lowers km & vmax
Right: parallel lines y-int. further from orgin (value gone down) x-int (further from orgin & value gone down)