BUS 418: Final Exam - Measurement and Scales
1/19
There's no tags or description
Looks like no tags are added yet.
Name | Mastery | Learn | Test | Matching | Spaced | Call with Kai |
|---|
No analytics yet
Send a link to your students to track their progress
20 Terms
Social Desirability
When respondents gives answers that they believe are socially acceptable
Selecting a response because the respondent believes it is the "socially acceptable” answer, rather than the honest answer
Therefore, data becomes unreliable
Avoid by:
Good Moderator
Neutral Questions
Random sampling
Nonresponsive Bias
“Systematic differences” between people who respond vs. people who don’t respond.
Characteristics, personality, behaviors, attitudes.
Survey will be biased because it only represents responses from one group of respondents (not the target population)
Avoid by:
Incentive
Short, simple survey
Follow-Up (text, emails)
Measurement
Rules for assigning numbers to objects to represent quantities of attributes
Scales of Measurement (NOIR)
Non-Metric ( ranking or labeling)
Nominal
Ordinal
Metric (looking at relative size differences between objects)
Interval
Ratio
Nominal Scale
label objects
basic measurement: identity or categorize
Examples: gender, brand, purchase, (yes/no)
Measures of Average: mode
Ordinal Scale
Indicate relative size differences between objects
basic measurement: order
Examples: brand preference, income (in categories)
Measures of Average: median
Ratio Scale
Have true zero value
basic measurement: comparison of absolute magnitudes
Examples: units sold, income
Measures of Average: mean
Interval Scale
Measure unobservable variables, continuous intervals that show order, direction, and a consistent difference in values
basic measurement: comparison of intervals
Examples: customer satisfaction, brand attitude, likelihood to buy
Measures of Average: mean
Types of Interval Scales Commonly Used in Marketing Research
Likert Scale
Semantic Differential Scale
Stapel Scale
Likert Scale
Commonly used in marketing
Ask respondents to indicate the degree of agreement or disagreement of a series of statements
Measures intensity of agreement or disagreement
Semantic Differential Scale
Series of bipolar adjectives for properties of the object
Respondents indicate their impressions of each item by indicating locations along its continuum
Good way to measure brand, company, or store image
CAUTION: Halo effect
Flip around positive and negative so that you can get a snake diagram and mitigate getting a halo effect
Snake Diagram
connects the average responses to a series of semantic differential statements, thereby depicting the profile of the object/objects being evaluated
Stapel Scale
Relies on positive and negative numbers
Range from +5 to -5
Scale may or may not have neutral zero
Examples
slider scales
stars
graphic scales
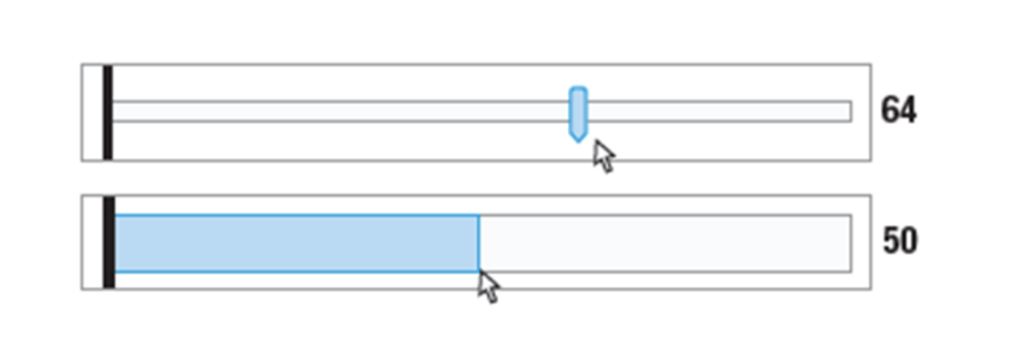
Stapel Scale: Slider Scales
Drag the indicator on the bar to indicate the amount of intensity
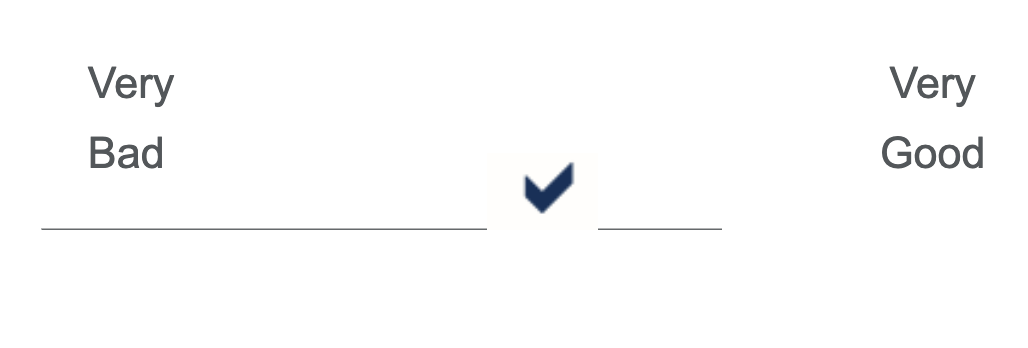
Staple Scale: Graphic Scale
Indicate your overall opinion about Target by placing a check mark at an appropriate position on the line below
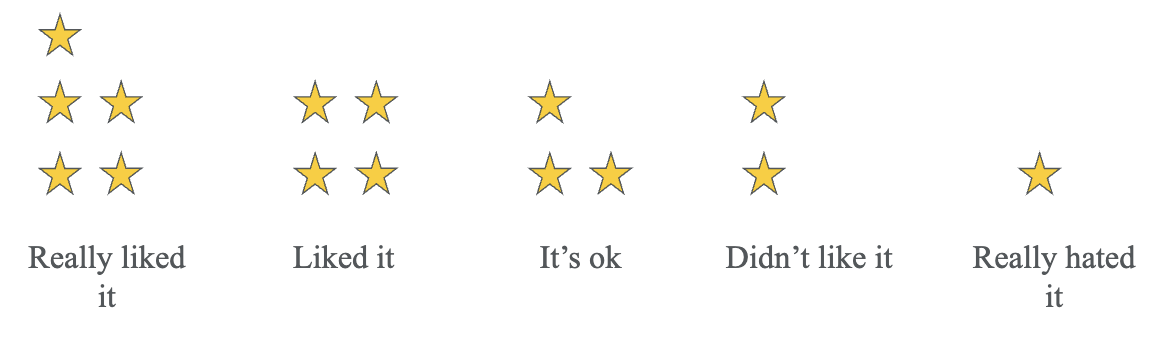
Staple Scale: Star
Rate your experience with your recent product purchase:
Best practices when having interval scales
Multi-item likert scale/measures (i.e., composite measures)
Choice intervals of 1 to 7 or 1 to 10
Include “don’t know” or “not applicable” options
Reliability of Measurement
Measurements provides consistent data
Validity of Measurement
Measuring what was supposed to be measured
Potential Errors With Our Measurements
Components of an Observed Response
Observed response = Truth + systematic Error + Random Error