Unit 2 Test
1/113
There's no tags or description
Looks like no tags are added yet.
Name | Mastery | Learn | Test | Matching | Spaced |
|---|
No study sessions yet.
114 Terms
Demand
A schedule which shows the various amounts of a good/service consumers are willing and able to buy at each specific price in a series of possible prices that may arise in a specific period of time
Demand schedule
Represents the concept of demand and shows the series of prices of a product and its corresponding quantity demanded over a period of time
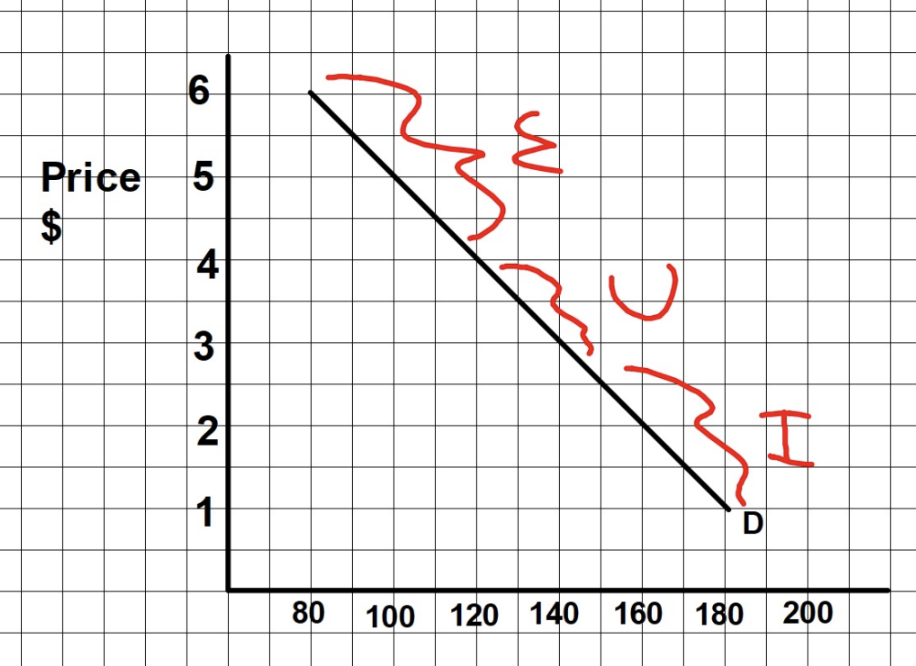
Demand Curve
Graphically represents a Demand schedule. In Economics, the independent variable, PRICE, goes on the vertical axis and the dependent variable, QUANTITY, goes on the horizontal axis
Slope of Demand Curve
Demand (D);
Relationship b/w the 2 variables on Demand Curve
Indirect (price increases as quantity decreases) shown by a downward-sloping line (curve) that is simply a series of points (combinations of prices and corresponding quantities at that desired price)
Demand Descends Downward
Law of Demand
Key economic principle that states as price increases, the corresponding quantity demanded decreases, ceteris paribus (and vice versa)
*DEMAND DOES NOT INCREASE OR DECREASE
Ceteris paribus
All else being equal, other things held constant
Accounts for all other factors that might come into play for how much of anything a consumer would be willing and able to buy. It holds these things constant, so that the only thing the Law of Demand looks at is the price of the good or service being analyzed
Behavior patterns that explain the Law of Demand
Diminishing Marginal Utility
Substitution Effect
Income Effect
Diminishing Marginal Utility
The extra satisfaction (usefulness) we get from using an additional unit of some good/service begins to diminish → we’re not as willing to pay as much for more of the same good as we did for the first
Marginal utility
Describes the extra usefulness/satisfaction obtained from one more unit of something
When will someone stop buying something?
When it’s not worth anything anymore! When marginal utility (extra usefulness/satisfaction) is less than the price
Substitution Effect
When a price of a product rises (now more expensive compared to other products), consumers become more likely to buy one of the alternatives as a substitute for the produce whose price increased
How do economists measure consumption?
By the amount of a good or service that’’s bought NOT the amount of money spent to buy it
Income Effect
Rising prices makes us feel poorer. When the price of any product increases, our limited budgets just wont buy as much as they used to, it feels as if we have less money → buy less of certain things (our real income is less)
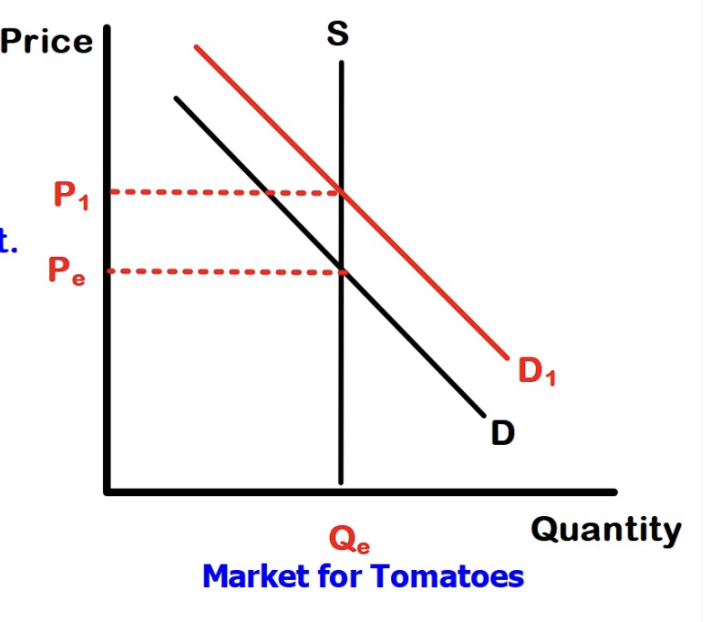
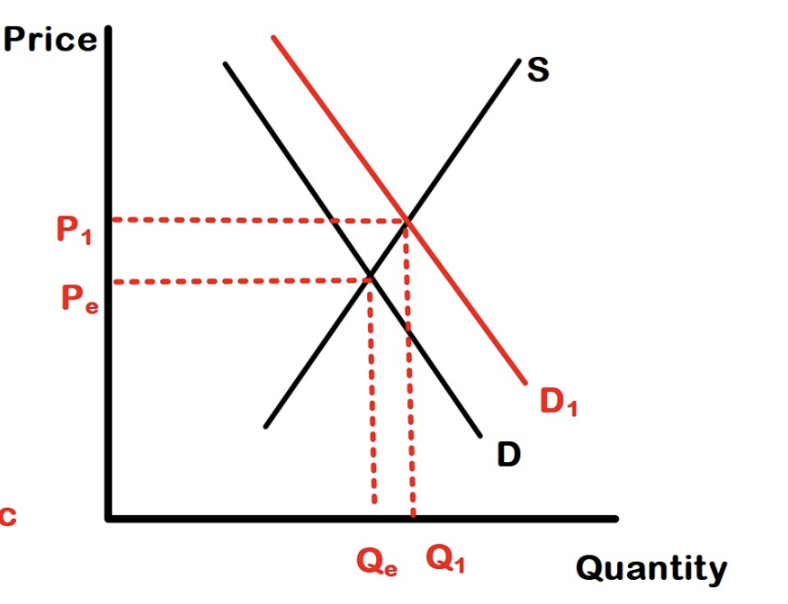
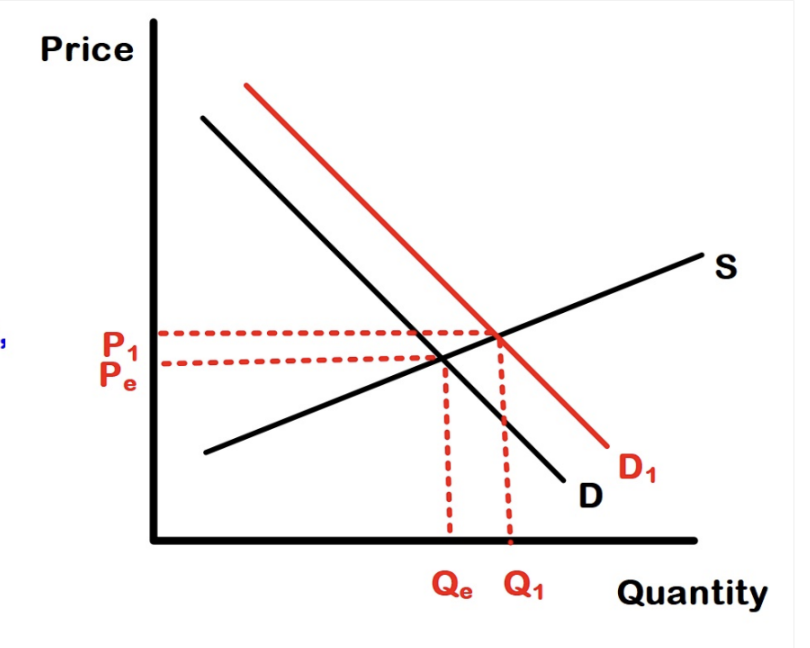
Shift rightward on Demand Curve
Increase in demand
Movement along the demand curve
As price changes (raise or lower it) the quantity demanded changes
Determinants of Demand (Demand Shifters)
Consumer Preferences (Tastes)
Price of Related Goods
Consumer Income
Demographics/ # of Potential Buyers
Consumer Expectations
Consumer Preferences (Tastes)
Favorable change= increase in demand (unfavorable=decrease)
Ex. Winning sports team will see an increase in demand of their apparel
Factors that can influence a change in interest
Advertising/social media
Fad- temporary intense interest
News Event
New Product introduction
Seasonal or weather event
Price of Related Goods
Prices of Substitute and complementary goods of a product can change demand
Substitute goods
those that can be used in place of another
Price of one good and demand for its substitute are directly related
Ex. If price of Heinz ketchup increases, demand for Hunts Ketchup increases
Complementary Goods
Those that are used together
Inverse relationship b/w price of one good and demand for 2nd good
Ex. If price of tennis racket increases (b/c quantity demanded falls) demand for tennis balls decrease
Consumer income
When your income goes up, you can afford to buy more goods and services
Normal good
a good that consumers demand more of when their income increases (most goods like steak, veggies, and shopping at Macy’s)
Inferior Good
a good that consumers demand less of when their income increases (demand varies inversely with income) (ex.canned meat, powdered mac & cheese, shopping at a flea market)
Demographics/ Potential Buyers
More buyers = increase in demand (less=decrease)
Ex. Demand for prescription drug has increased as the population as grown older
Consumer Expectations
consumers have expectations about future prices, product availability, and income,and these expectations can shift demand
Ex. Expect price of gas to decrease next week, demand for gas this week decrease (wait for next week)
PRIDE or TRIBE
Preferences or Taste
Related Goods
Income
Demographics or Buyers
Expectations
3 ways to increase profits of a business
Selling more units
cut your costs
Raise price (not necessarily)
Why raising prices wont necessarily increase profits of business
The Law of Demand tells us that increased price causes a decrease in quantity demanded but it doesn’t tell us by how much (where the concept of elasticity comes in)
Elasticity
A measurement of how responsive one variable is to a change in another variable. It can be used with all sorts of variables
How does elasticity relate to increasing profits of a business
We look at the price elasticity of demand (how sensitive the quantity of a good that people demand is to a change in price of that good) when trying to increase profits
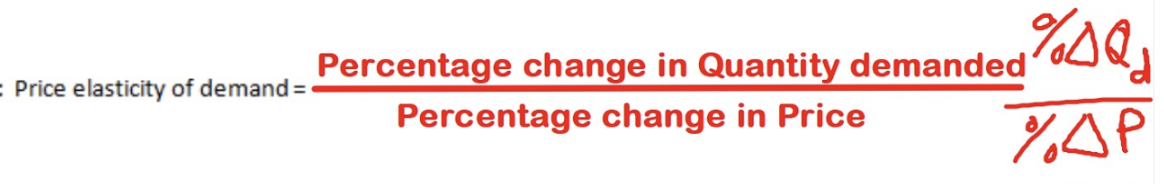
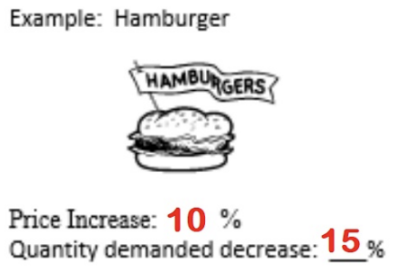
Price elasticity of demand (demand elasticity)
A measure of how much the quantity demanded changes when the price changes
Simple Price Elasticity of Demand Formula
Demand Elasticity Continuum
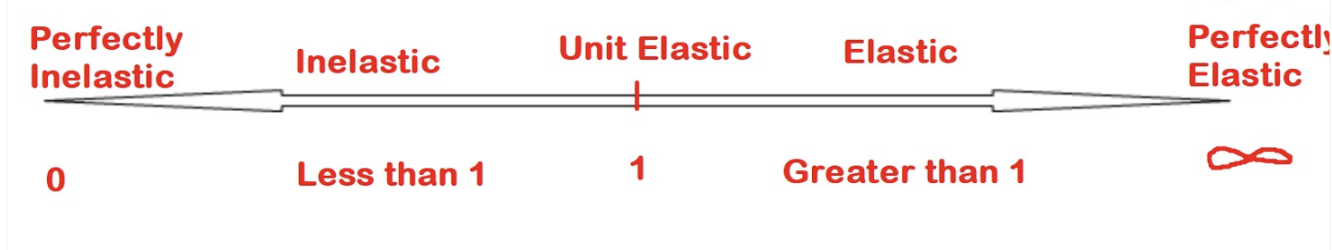
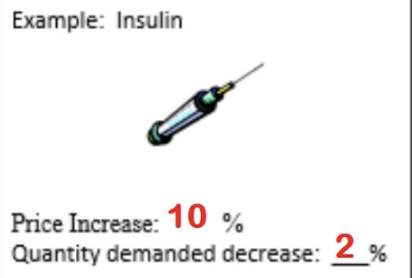
Perfectly inelastic demand
change in price results in NO change in quantity demanded of a product
elasticity coefficient=0
Inelastic Demand
when the % change in quantity demanded is less than the % change in price
Elasticity coefficient < 1
Unit Elastic Demand
when the % change in quantity demanded is equal to the % change in price
Elasticity coefficient = 1
Elastic Demand
when the % change in quantity demanded is more than the % change in price
Elasticity coefficient >1
Perfectly Elastic Demand
buyers will only buy at one price → small change in price → infinite change in quantity demanded
Elasticity Coefficient approaches infinity
Demand is inelastic when..
a given change in price causes a relatively smaller change in quantity demanded
Demand is unit elastic when..
a given change in price causes a proportional change in quantity demanded

Demand is elastic when..
a given change in price causes a relatively larger change in the quantity demanded
Problem of the simple Demand elasticity formula
The senstivity of the change in quantity shouldn’t depend on whether the price goes up or down
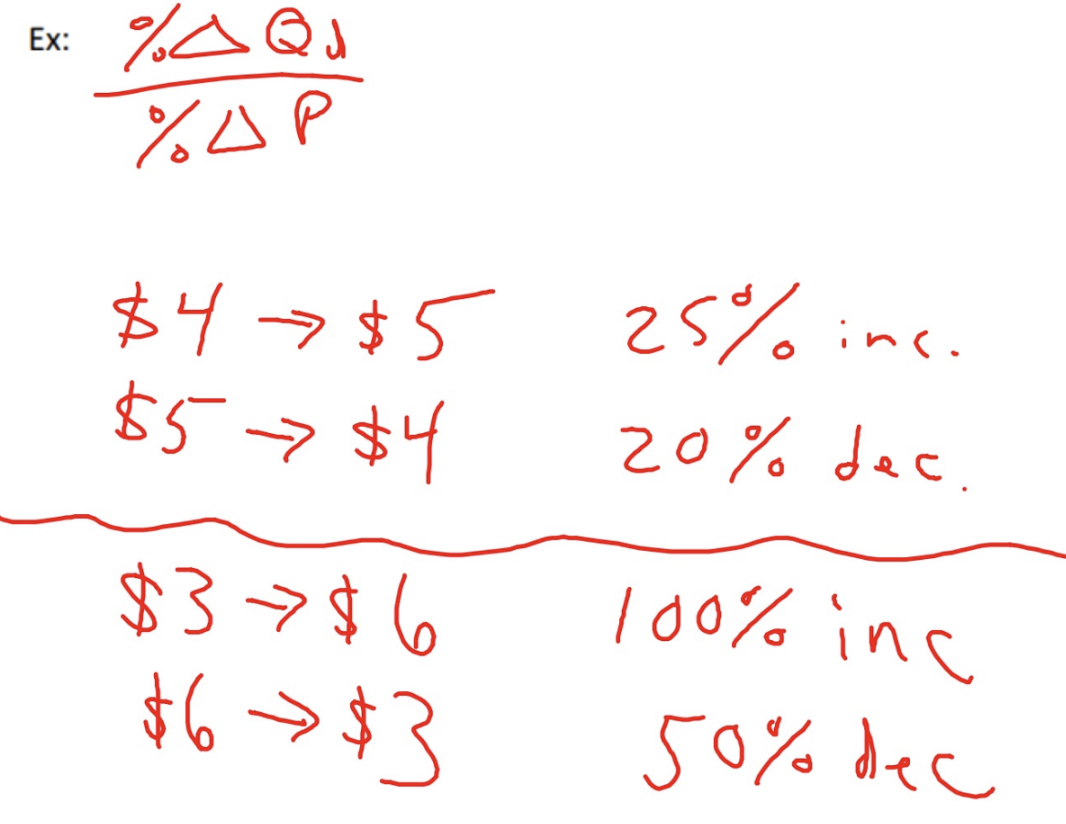
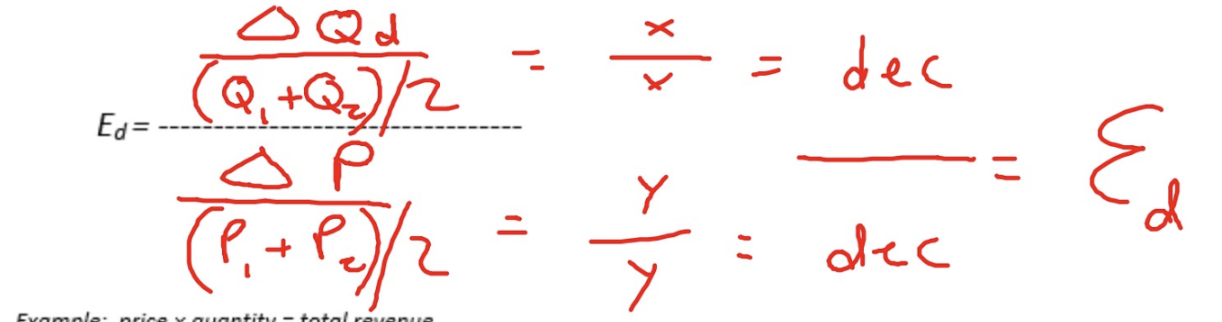
Midpoint Formula (Arc Method)
Calculates price elasticity across a price quantity range to overcome the problem of selecting the reference points for price and quantity. In this formula, the average of the 2 quantities and the average of the 2 prices are used as reference points. USE THE ABSOLUTE VALUE
Slope of Demand Curve and Elasticity
If we generalize: steeper slopes show inelastic demand while flatter slopes show elastic demand
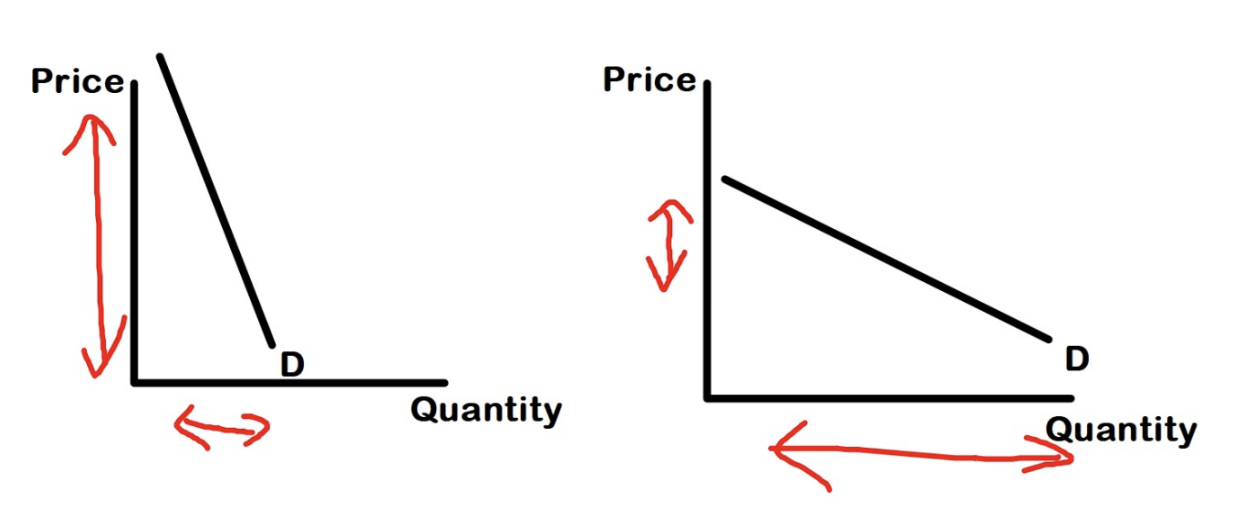
Slope of Demand Curve…
DOES NOT MEASURE ELASTICITY (elastic at higher prices, changes in sensitivity to how much money lost differs from $1 to $100)
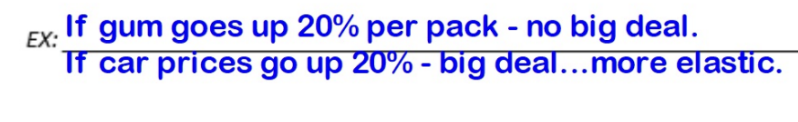
4 Determinants of Demand Elasticity (LIST)
Luxuries vs Necessities
Proportion of one’s Income used
Number of Substitutes
Time frame available to adjust the price change
Luxuries vs Necessities
Necessities tend to have inelastic demand whereas luxuries tend to have more elastic demand (ex. Diapers are a necessity for anyone with a baby and going out to dinner is NOT)
Is the good habit-forming?
Consumers become less sensitive to the price of the good if they buy something out of habit (it has become the default choice) (ex. Going to a pizza place everyday even when they raise their prices)
Addictive products
Tend to be more severe in their behavior results → these will be very inelastic
Proportion of One’s Income used
products that take up a high percentage of one’s income will have a more elastic demand
Number of Substitutes
The more close substitutes there are in the market, the more elastic is demand because consumers find it easy to switch

Breadth of the definition of the product
If the good is broadly defined (i.e., the demand for autos in general), demand is often inelastic, as opposed to a good that’s more narrowly defined (i.e., the demand for Honda Civic). Then the demand tends to be more elastic
Time frame to adjust to the price change
Demand is more price elastic the longer that consumers have to respond to a price change. They have more time to search for cheaper substitutes and switch their spending

Off-peak vs peak demand
Demand is more price inelastic at peak times and more elastic at off-peak times

Total Revenue Formula
Price x Quantity = Total Revenue

Total Revenue (TR) changes when..
Price changes
The total revenue test shows when demand is..
inelastic, unit elastic, and inelastic
The price effect dominates with..
Lower price and inelastic demand
The quantity effect dominates with..
Lower price and elastic demand
Increase in price for Inelastic demand
Increase in total revenue for Inelastic Demand
Decrease in Price for Inelastic Demand
Decrease in Total Revenue for Inelastic Demand
Increase/Decrease in Price of Unit Elastic Demand
No change in Total Revenue
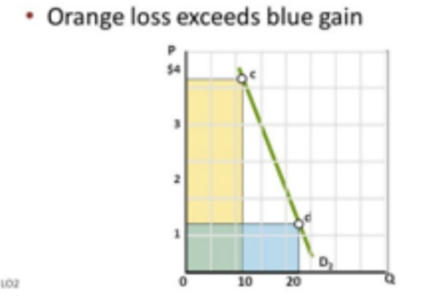
Increase in Price of Elastic Demand
Decrease in Total Revenue of Elastic Demand
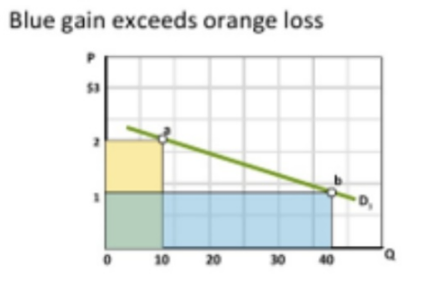
Decrease in Price of Elastic Demand
Increase in Total Revenue of Elastic Demand
Supply
a schedule which shows the various amounts of a good/service producers are willing and able to produce and sell at each specific price in a series of possible prices that may arise in a market in a specific period of time
Supply Curve
Graphically represents a supply schedule. In Economics, the independent variable, PRICE, goes on the vertical axis, and the dependent variable, QUANTITY, goes on the horizontal axis
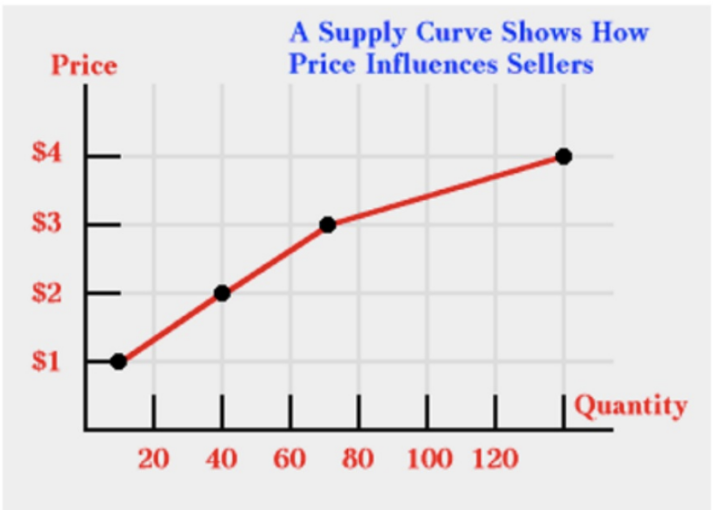
Relationship b/w Quantity supplied and Price
There’s a DIRECT relationship b/w quantity supplied and price (as price goes up, quantity supplied goes up)
Law of Supply
States that producers/suppliers/sellers will produce/supply/sell more of their good/service at a high price than a low price. There’s a direct relationship between price and quantity supplied
Explanation of Law of Supply
Give production/supply costs as they are, a higher price means greater potential earnings and ultimately, profits, and thus, an incentive to increase the quantity supplied
Is the Law of Supply always true?
No, beyond some production quantity, producers will encounter increasing costs per added unit of output (ex. more costly to find oil)
When all factors held constant, what is one thing that will change the quantity being supplied?
The PRICE of the product
Change in Quantity Supplied
No shift in supply curve; change in amount offered for sale in response to a change in price; Producers have the freedom, if the price fall too low, to slow or halt production or leave the market completely, if the price rises the producer can step up production levels
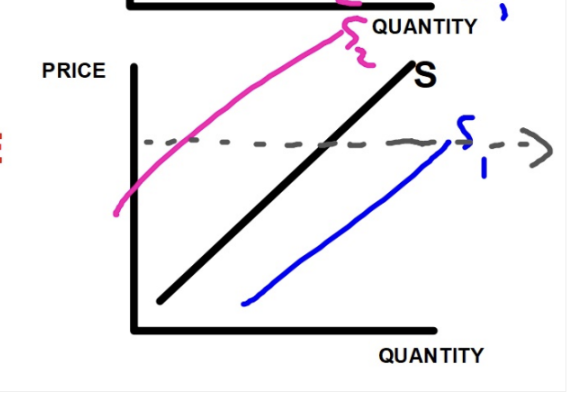
Shifting Supply Curve
Generally, if you decrease the costs of production, you’ll increase supply (shift curve right) and if you increase the costs of production, you'll decrease supply (shift curve left)
Decrease= LEFT is LESS; Increase= RIGHT is MORE
Changes in Supply
A situation where suppliers supply different amounts of products for sale at all possible prices in the market
Supply Shifters/ 7 Basic Determinants of Supply (PIGTOES)
Productivity
Input Prices
Government Actions
Technology/Methods
Other Production Goods’ Prices
Expectations of Suppliers
# of Suppliers
Productivity
Has mostly to do with the workers’ motivation to produce (less motivated= decrease supply (curve shifts left); more motivated= increase supply (curve shifts right))
Input prices
Cost to produce (labor, materials, packaging, etc.); price of inputs drops= increase supply (curve shifts right); price of inputs increase= decrease supply (curve shifts left)
Government Actions (RST)
Regulations (Tighter=less supply/increased production costs; Relaxed=more supply/decrease production costs)
Subsidies (more= more supply/lower production costs; less= less supply/higher production costs)
Taxes (more= less supply/increased production costs; less= more supply/ lower production costs)
Technology/Methods
tends to shift supply curve right because of lowering productions costs and/or increase productivity (allowing for greater supply at each and every price in the market)
War, natural disasters, and the like often set technology back → increase production costs, decrease supply (curve shifts left)
Other Production Goods’ Prices
Price of substitute good decreases, Supply of good increases (indirect relationship) like with milk and cheese
Price of Complement Good increases, Supply of good increases (direct relationship) like with beef and leather
Substitutes-in-Production
Two or more goods that can be produced using the same resources. Can only produce one good at a time
Complements-in-production
Two or more goods that are jointly produced using a given resource. Producing one leads to producing both goods.
Expectations of Suppliers
If producers think that price of good will increase in the future → present supply decreases (suppliers withhold for the future and curve shifts left). If they fear that price of good may drop in the future → present supply increases (suppliers sell as much as they can now and curve shifts right)
Number of Suppliers
Only affects the market supply curve (not individual supply curve); more firms enter an industry = supply increases (curve shifts right); less firms= supply decreases (curve shifts left)
Supply Elasticity
A measure of the way in which quantity supplied responds to a change in price
Elastic supply
Small change in price leads to a relatively larger change in output; Coefficients greater than 1
Inelastic supply
Quantity changes very little relative to change in price; Coefficients less than 1
Difference b/w demand elasticity and supply elasticity
If quantities are being PURCHASED= DEMAND elasticity
If quantities are being BROUGHT TO THE MARKET = SUPPLY elasticity
Determinants of Supply
Its production (nature of the business, more easily a firm can adjust to a change in price = more likely the supply is elastic)
Supply Elasticity does not depend on..
number of substitutes, necessity of the product, or percentage of budget used to purchase the product (demand elasticity does), ONLY affected by PRODUCTION CONSIDERATIONS!
Market Period
A time period so short that the producer CANNOT respond to the change in price. Insufficient time to change output. Supply is perfectly inelastic (ex. Tomato farmer cannot produce more tomatoes at the end of growing season)
Short Run
A period of time that will not allow for a change in the physical plant capacity (capital goods) but will allow for some temporary change in output from that physical plant (Ex. Tomato farmer can construct a temporary greenhouse)
Long Run
There’s an ample of time to make major adjustments to production-change methods, expand the physical plant, increase capital, hire more workers, etc. (ex. Tomato farmer buys more land)
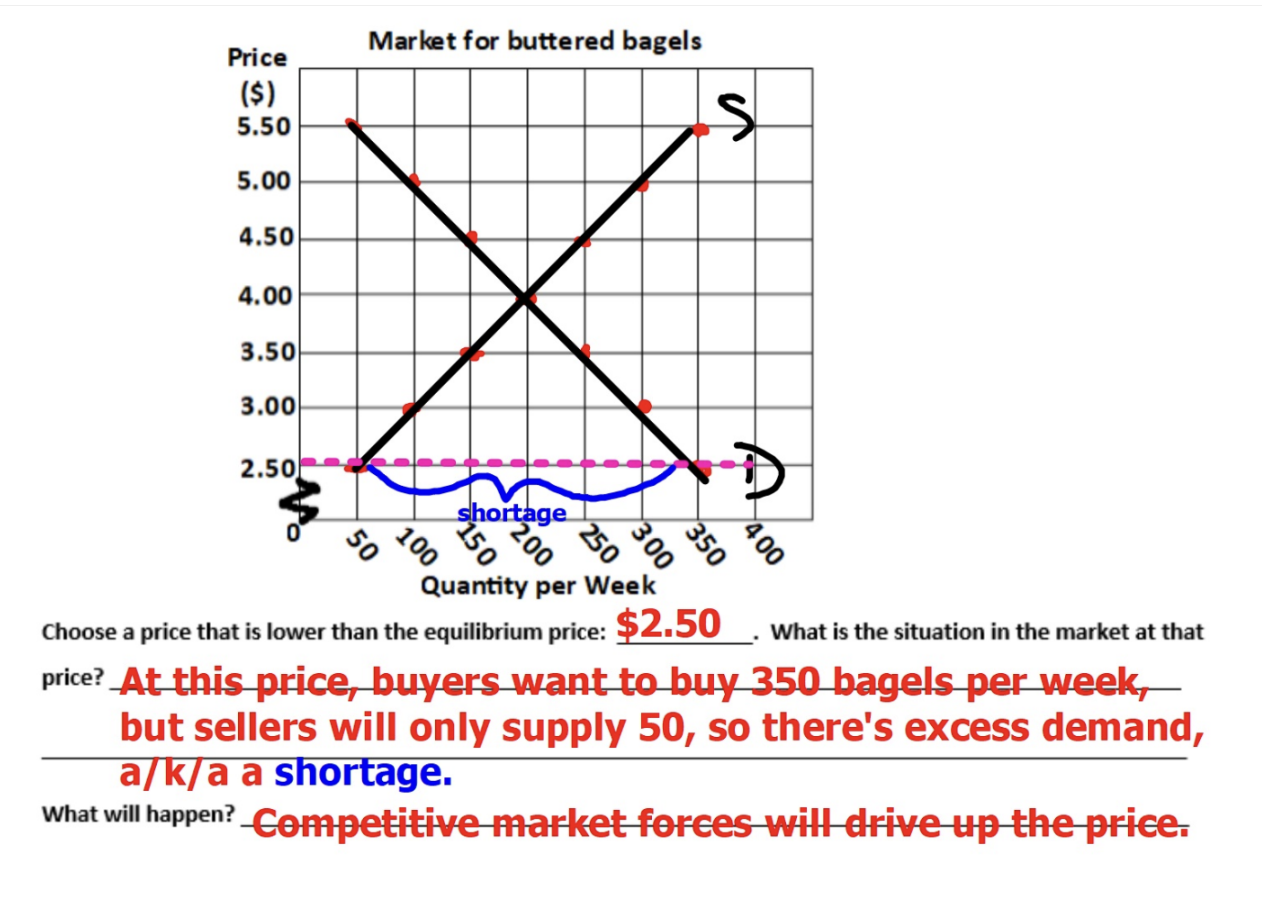
Market Equilibrium
When the quantity demanded equals the quantity supplied (both suppliers and consumers are happy)
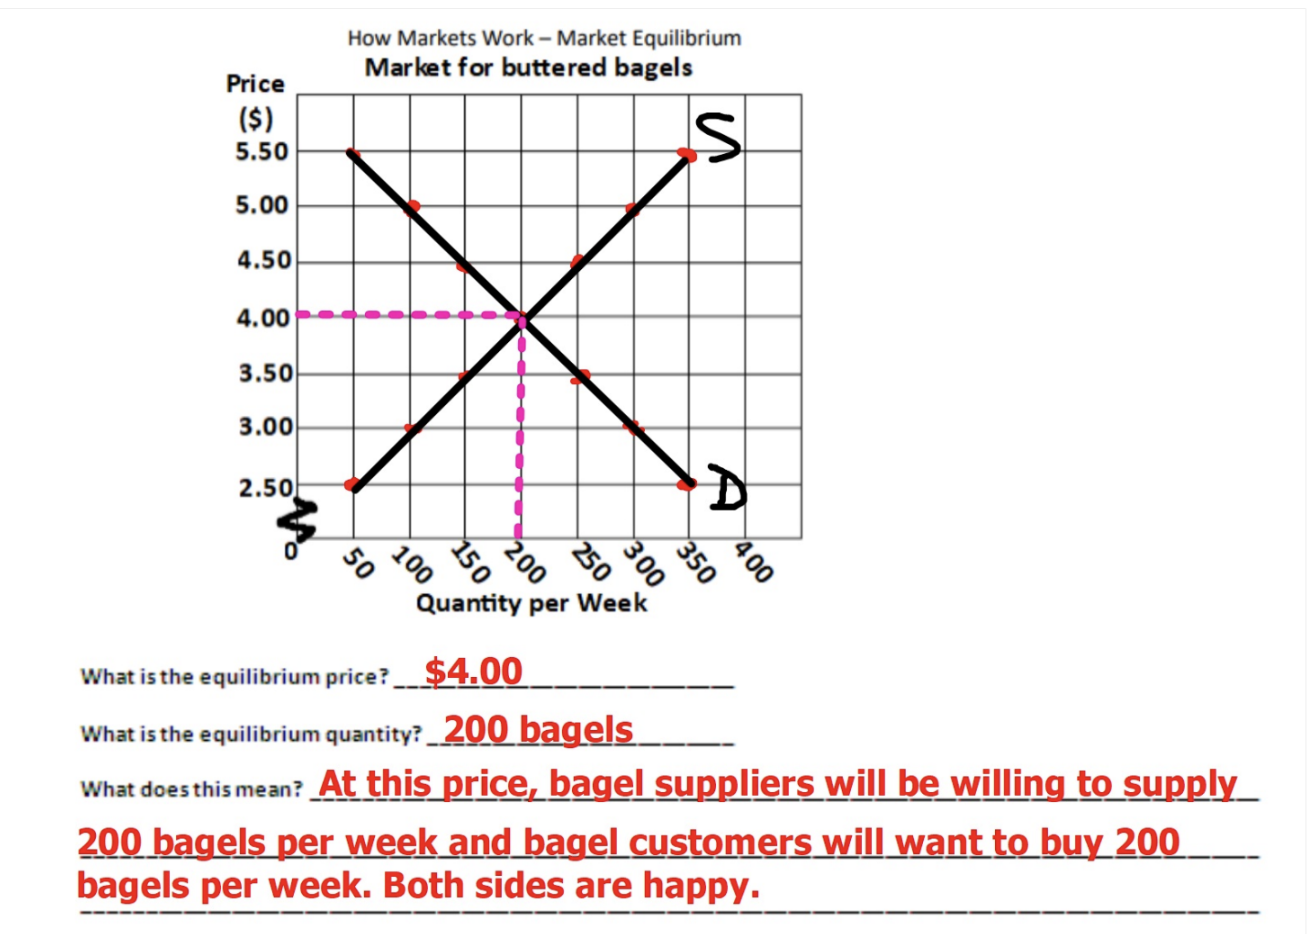
Equilibrium Price
The price at which quantity demanded equals quantity supplied
Equilibrium Quantity
The quantity bought and sold at the equilibrium price
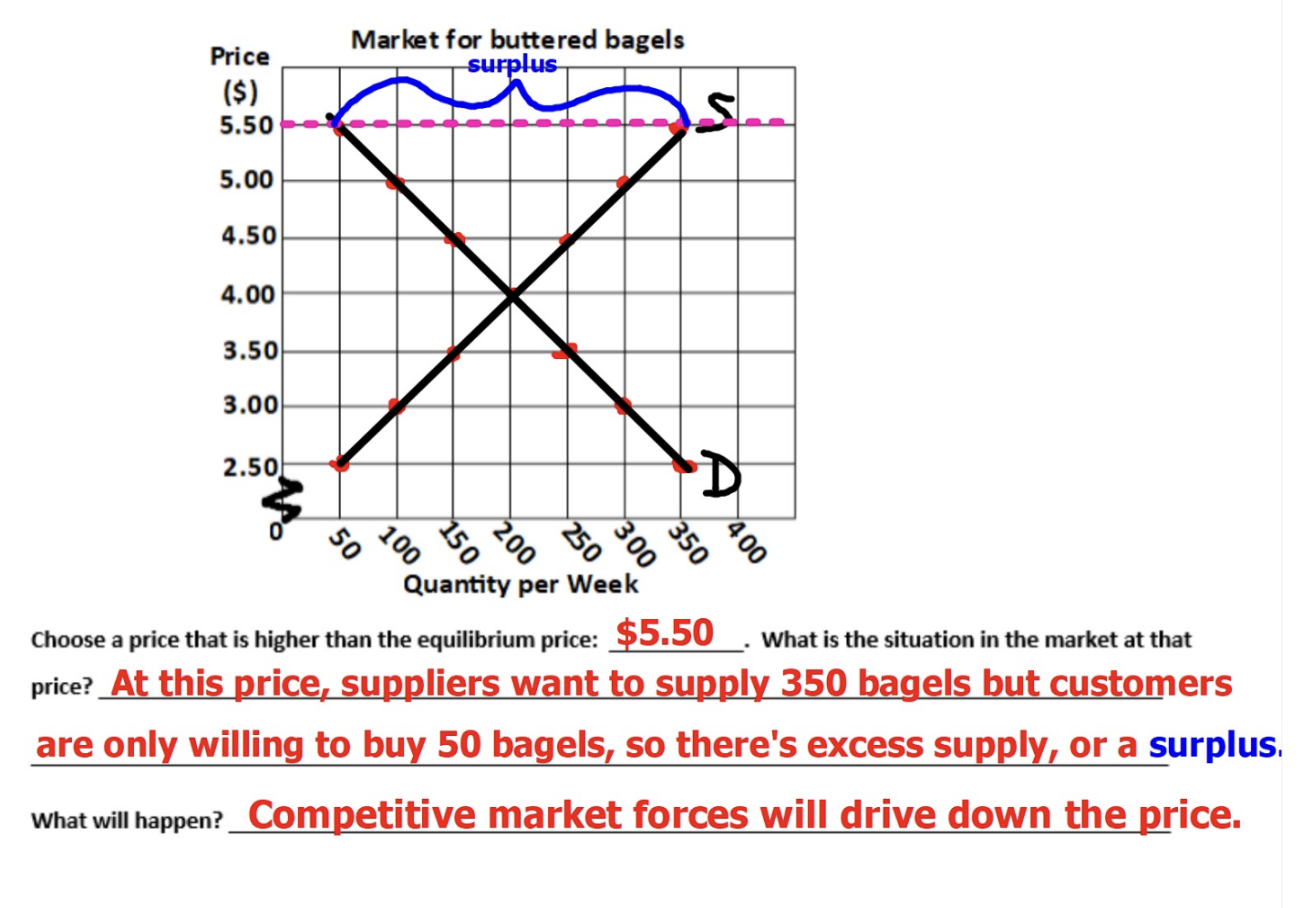
Surplus
A situation in which the quantity supplied exceeds the quantity demanded (competitive market forces will drive down the price)
Shortage
A situation in which the quantity demanded exceeds the quantity supplied (competitive market forces will drive up the price)