STSCI 2150: Prelim 03 Review
1/49
Earn XP
Description and Tags
Name | Mastery | Learn | Test | Matching | Spaced | Call with Kai |
|---|
No analytics yet
Send a link to your students to track their progress
50 Terms
Normal Distribution
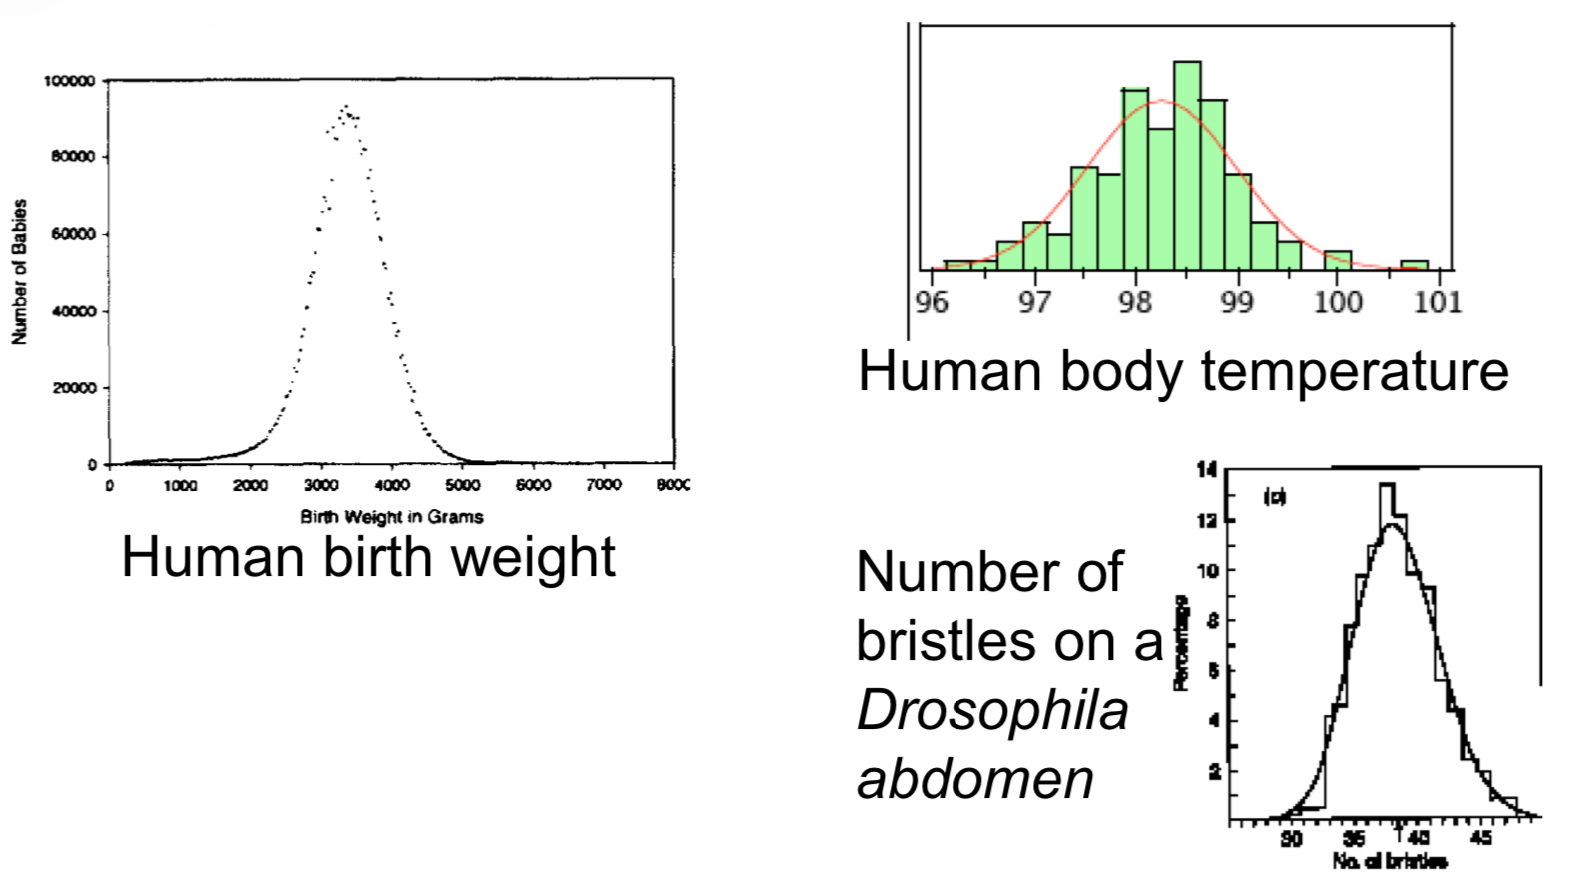
- A continuous probability distribution describing a bell-shaped curve
- It is a good approximation to the frequency distributions of many biological variables
What describes the normal distribution?
A normal distribution is fully described by its mean and standard deviation
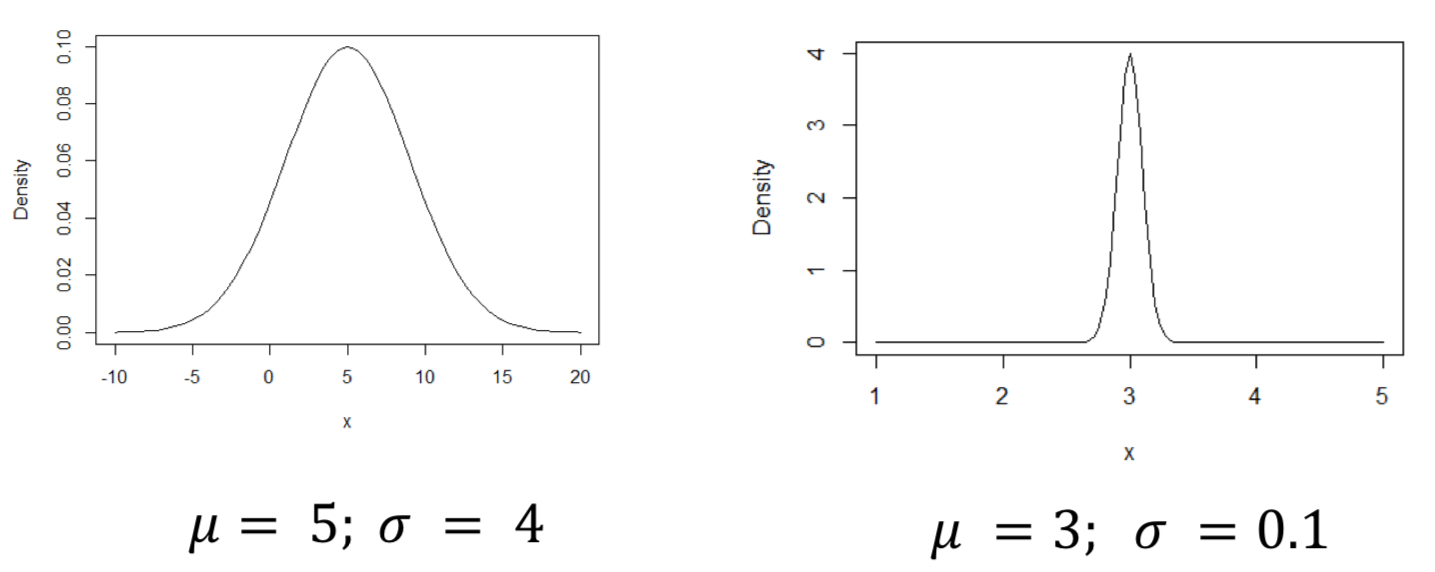
What do µ and σ represent?
- µ: true mean
- σ: true standard devation
True or False: A normal distribution is symmetric around its mean
True
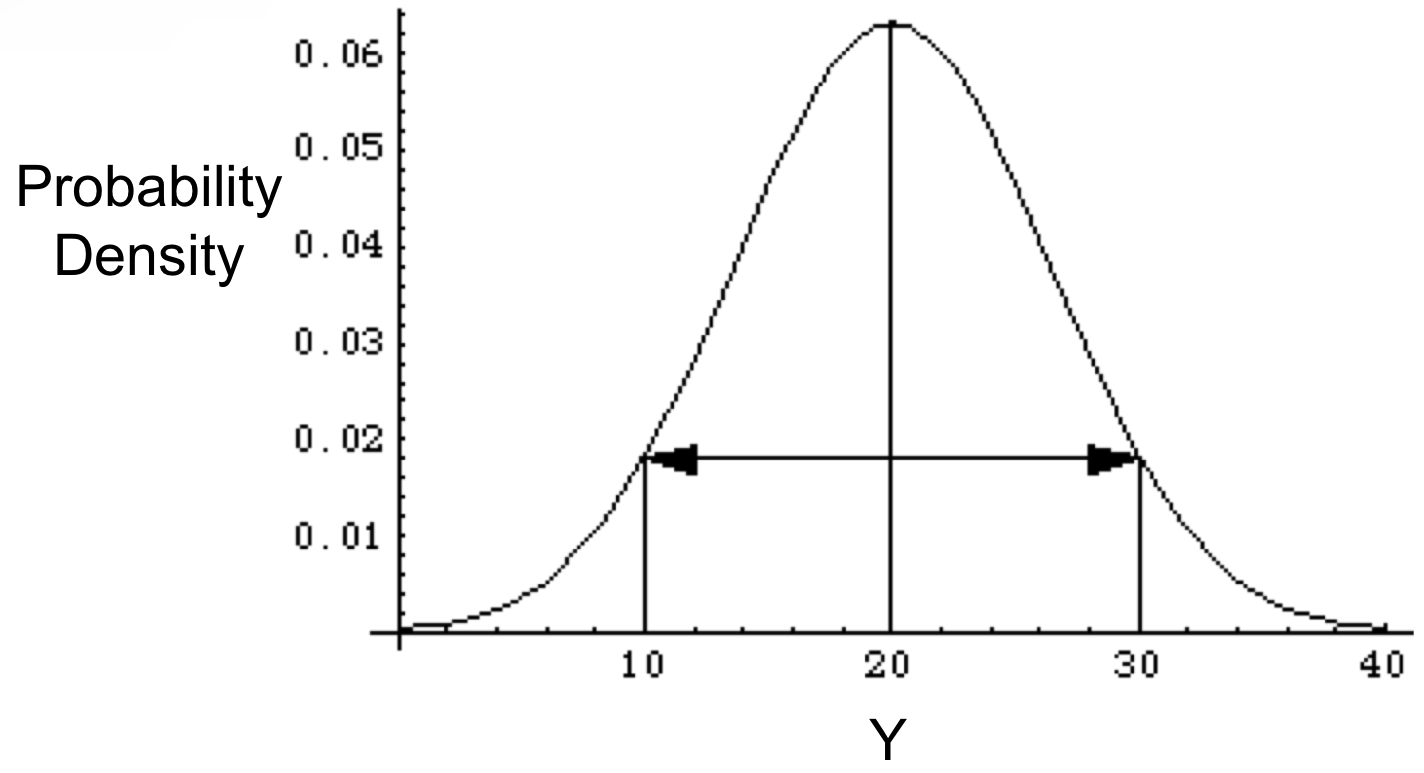
With a normal distribution, what is the same?
- With a normal distribution, the mean, median and mode are all the same
- All normal distributions have the same general shape
With a normal distribution, what is different?
Different means and standard deviations
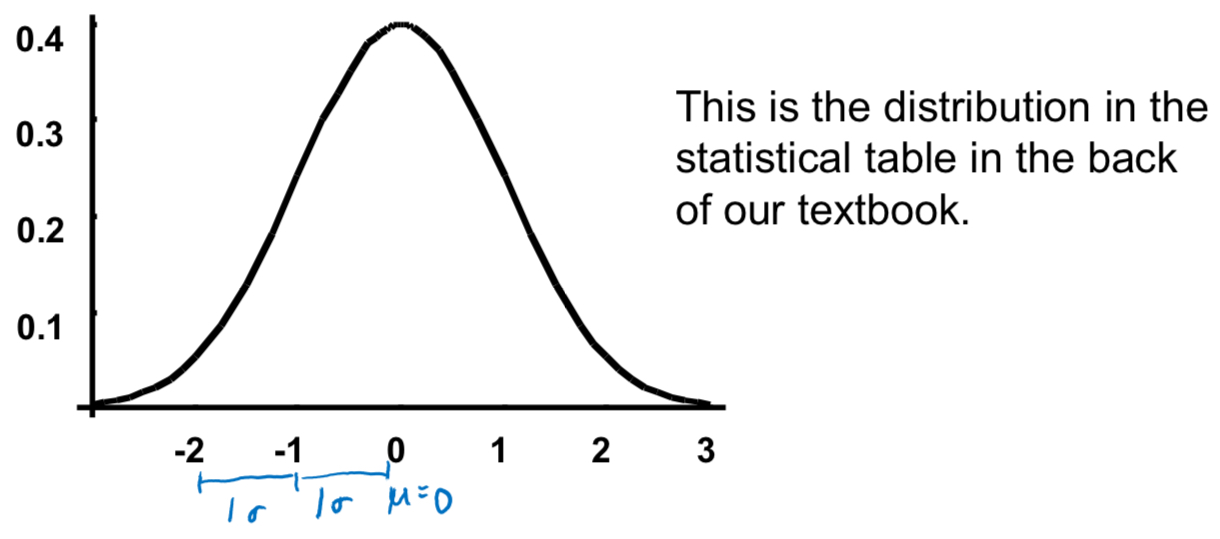
What is the standard normal distribution?
µ = 0
σ = 1
How do you interpret Z-Score (standard normal deviate)?
- The number of standard deviations the observation X is from the mean of the population
- Positive: above the mean
- Negative: below the mean
What does Z-Transformation refer to?
Shifting and shrinking (or stretching)
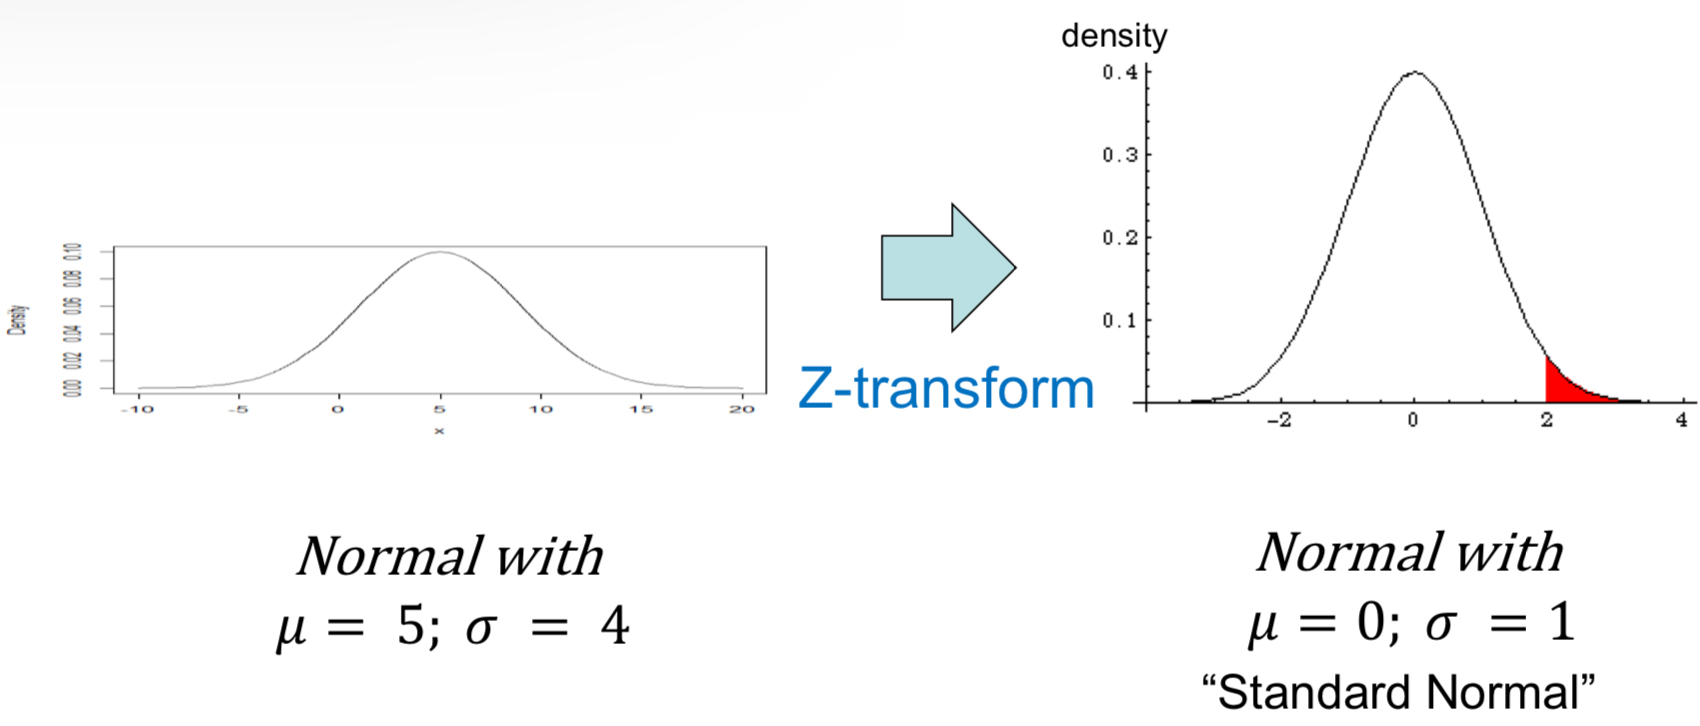
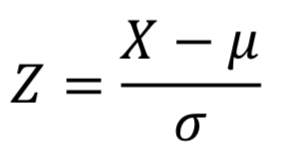
Z-Score Formula
x: the observation
µ: population mean
σ: population standard deviation
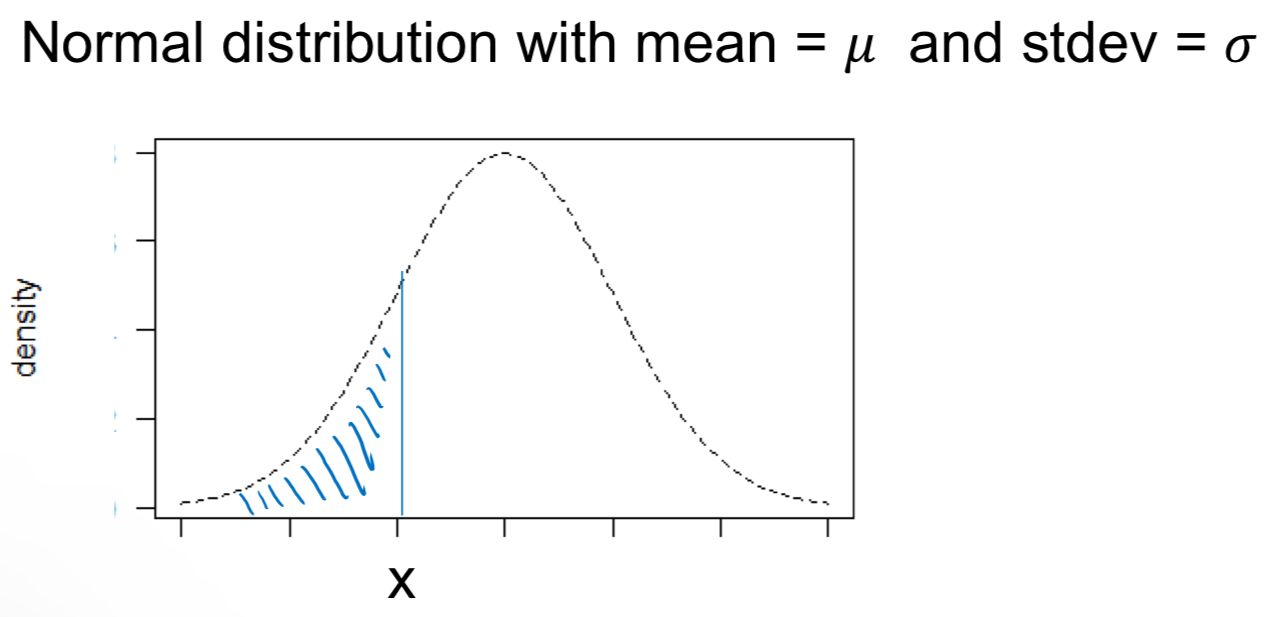
How can you use Z-scores to find percentiles
Use standard normal tables which shows values Z>a.bc
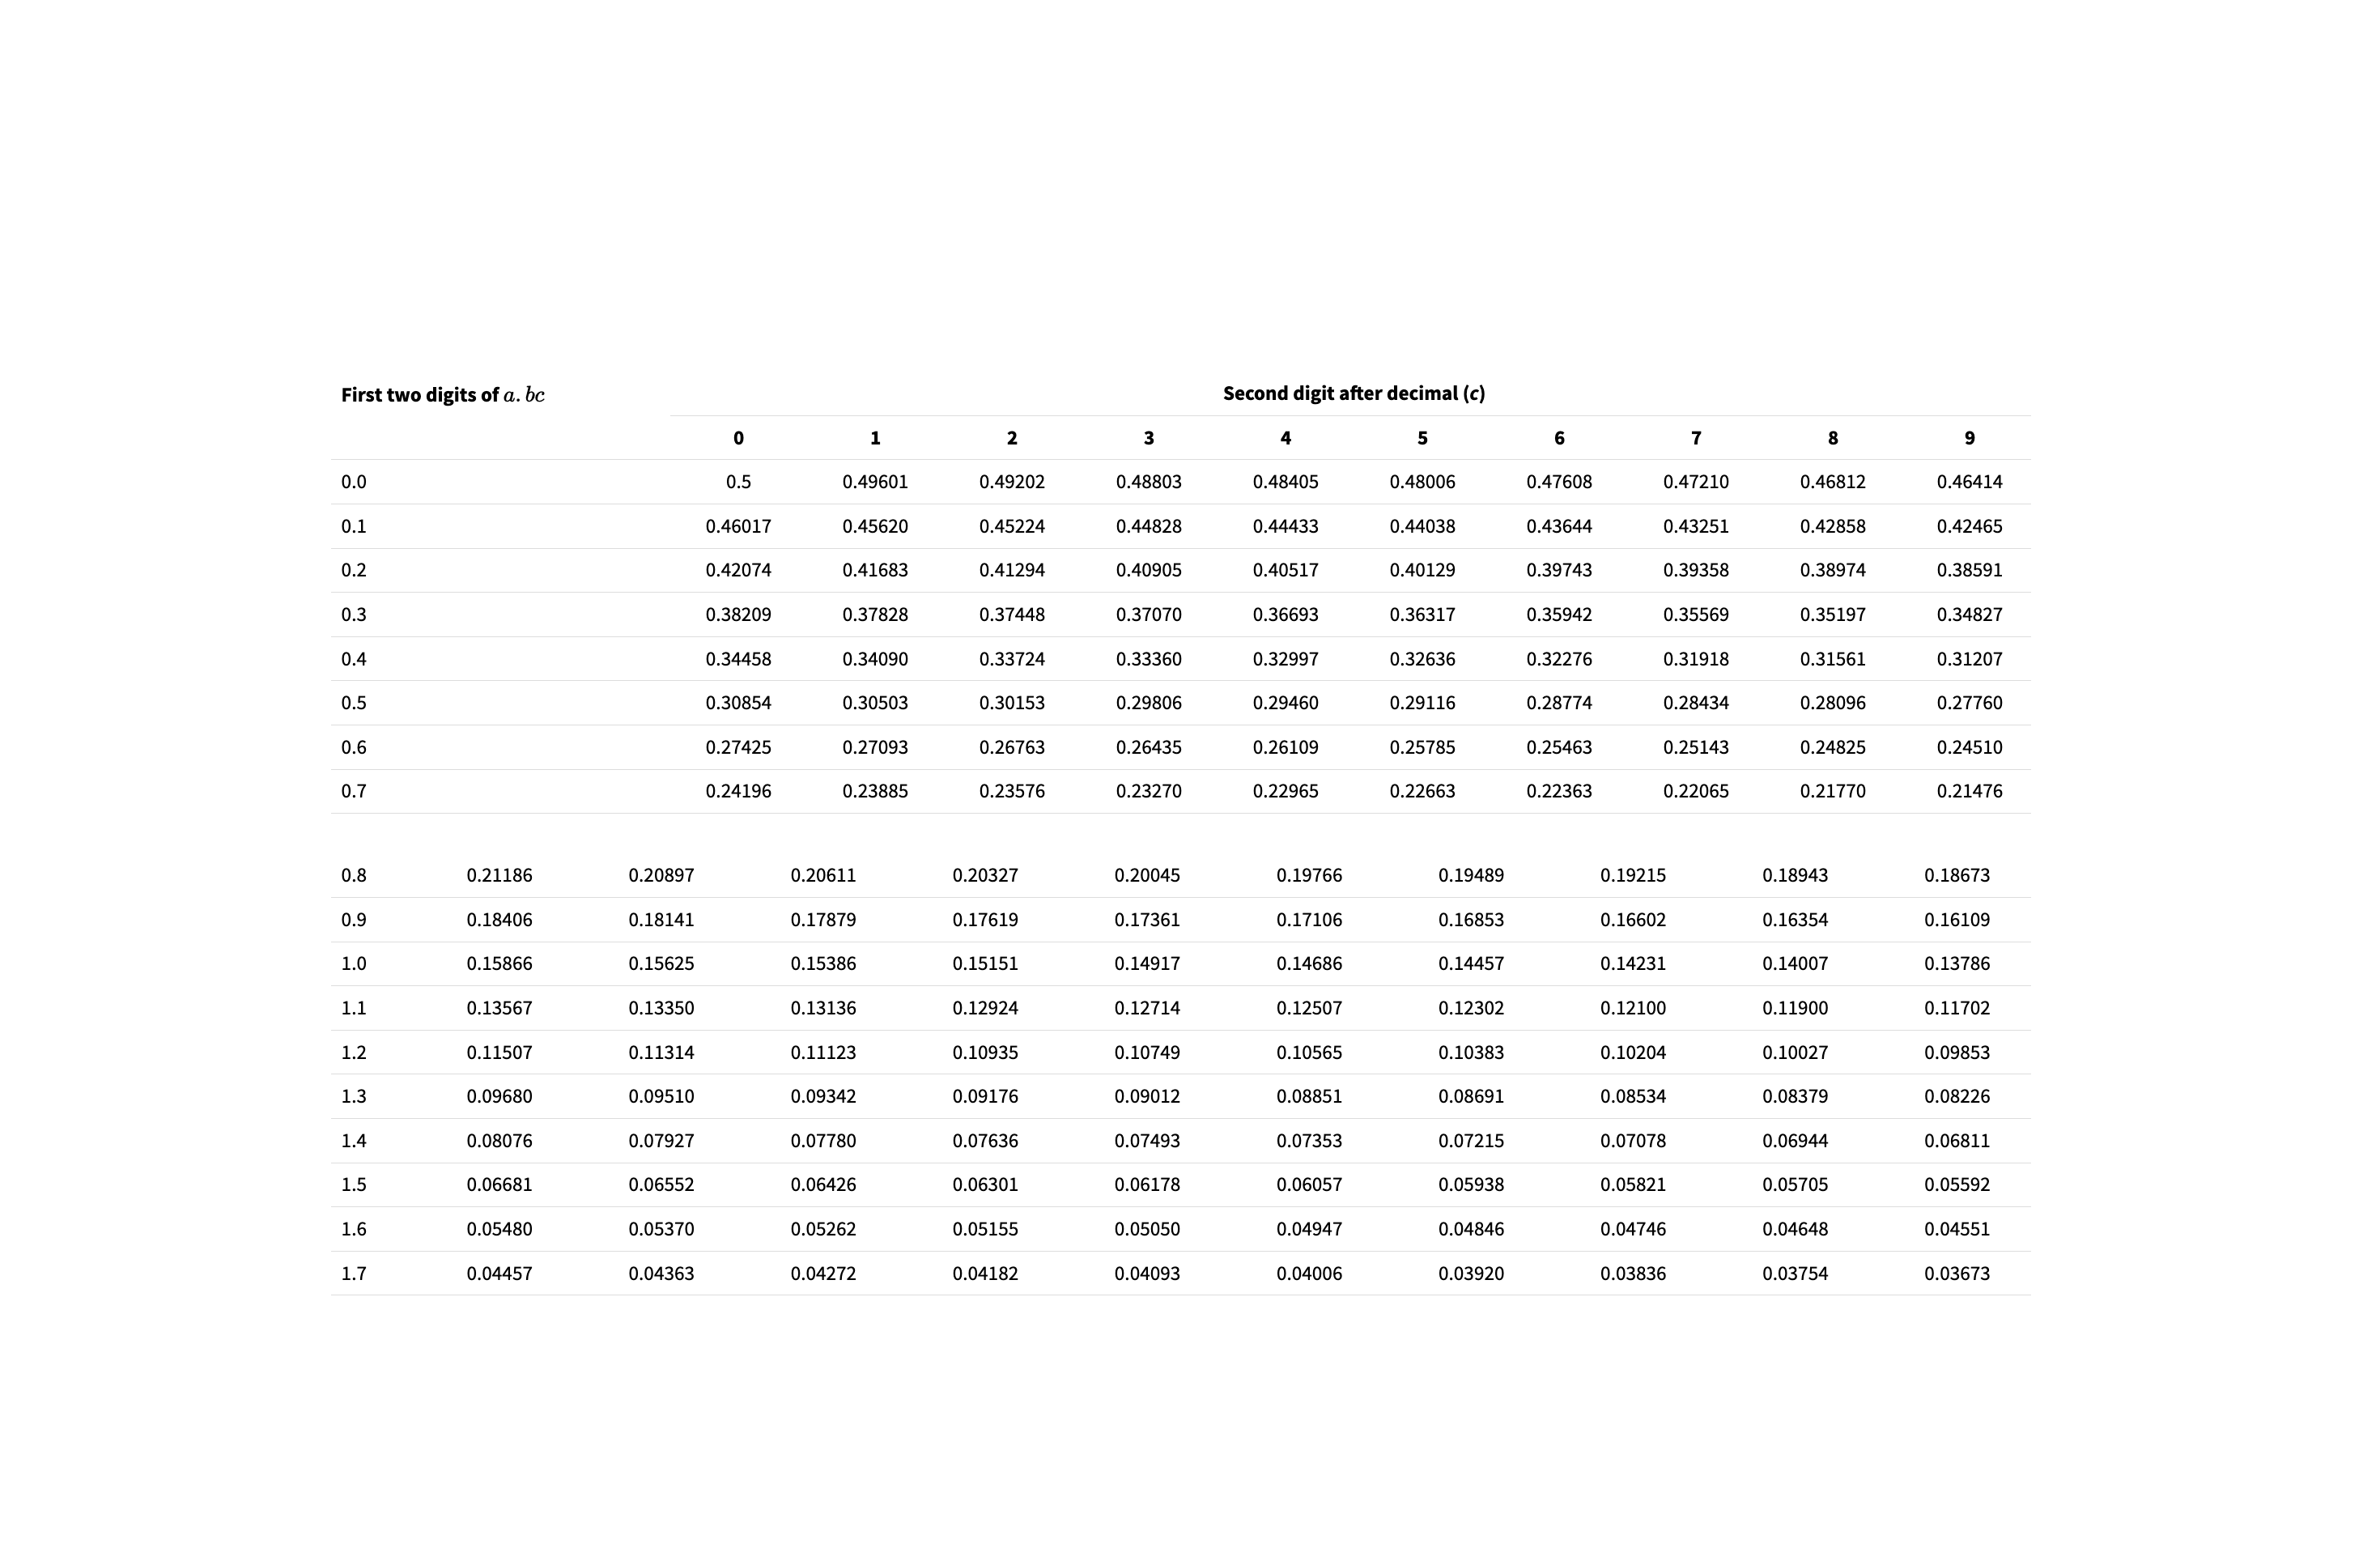
Why do we use standard normal tables?
We use it to find P-Values and percentiles of the standard normal distribution
Steps to find percentile from heights
1) Find Z-score
2) Find percentile of Z-score
R code to find areas under the normal curve (Z<a.bc)
pnorm(x, mean = µ, sd = σ)
R code to find areas under the normal curve (Z>a.bc)
1 - pnorm(x, mean = µ, sd = σ)
What are the two methods for finding areas under the normal curve?
1) Use statistical tables
2) Use R
Suppose we know µ and σ and a percentile, how do we find the value of the observation at that percentile
By hand, two steps:
Find Z-score
Solve for X
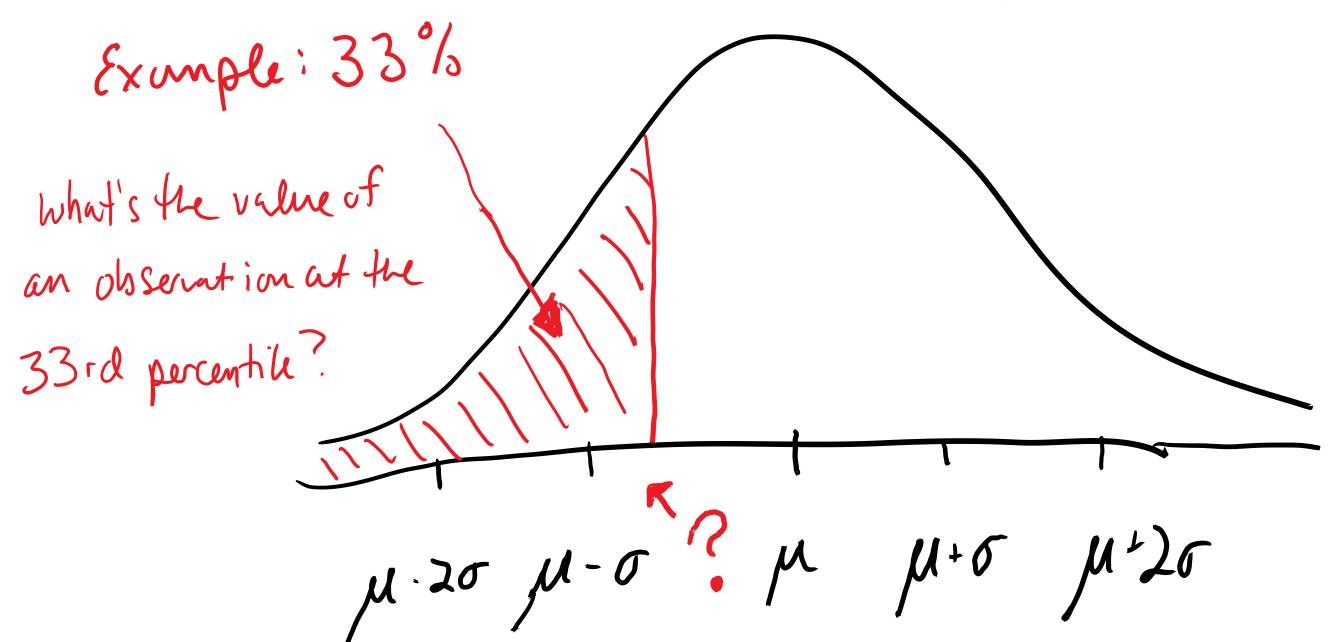
R code to find observation at a percentile
qnorm(proportion, mean = µ, sd = σ) where proportion is a number between 0 and 1
pnorm() vs qnorm()
- pnorm(): percentile
- qnorm(): value
What do pnorm, qnorm, dnorm, and rnorm find in R?
- pnorm: finds probability that a value is <=x for a normal (mean = __, sd = __) distribution
- qnorm: finds the quantile for a value x such that pr(variable < x) is equal to q for a normal (mean = __, sd = __) distribution
- dnorm: finds the density for a value x for the normal (mean = __, sd = __) distribution; for making graphs
- rnorm: randomly generates normally distributed values from a normal distribution (mean = __, sd = __) distribution
What are the R codes for pnorm, qnorm, dnorm, and rnorm?
- pnorm(x, mean = __, sd = __)
- qnorm(q, mean = __, sd = __):
- dnorm(x, mean = __, sd = __)
- rnorm(count, mean = __, sd = __)
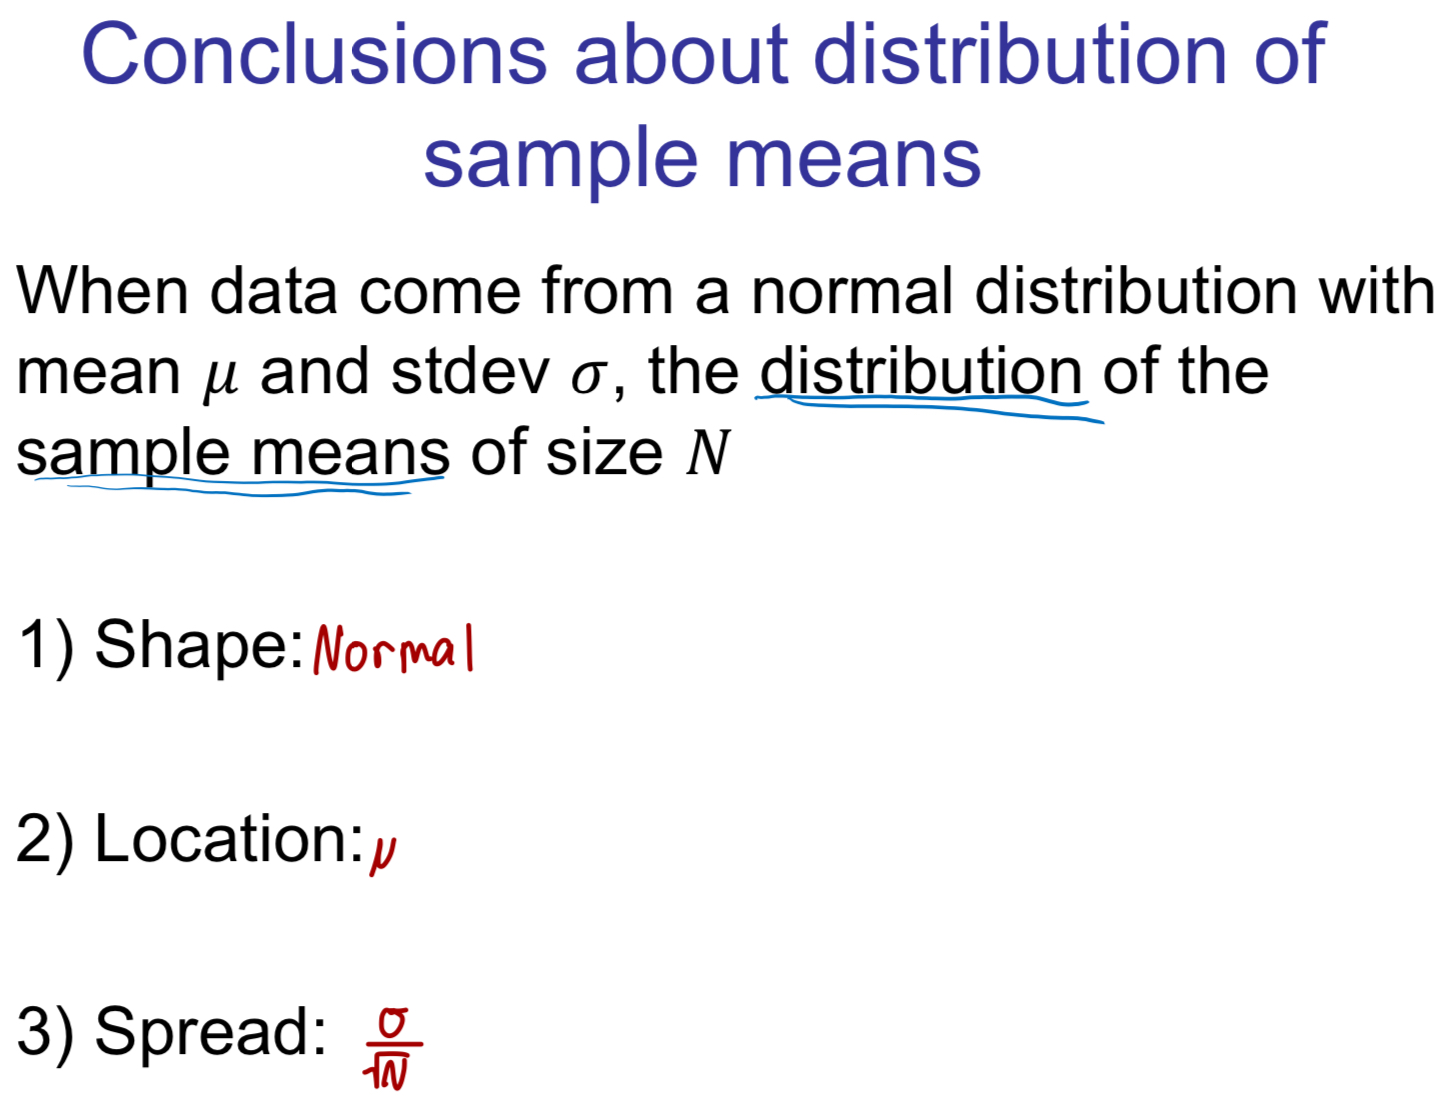
Suppose our data are drawn from a population with a normal distribution with mean µ and standard deviation σ. What can we say about the distribution of sample means?
Standard Error Formula For Normal Distribution
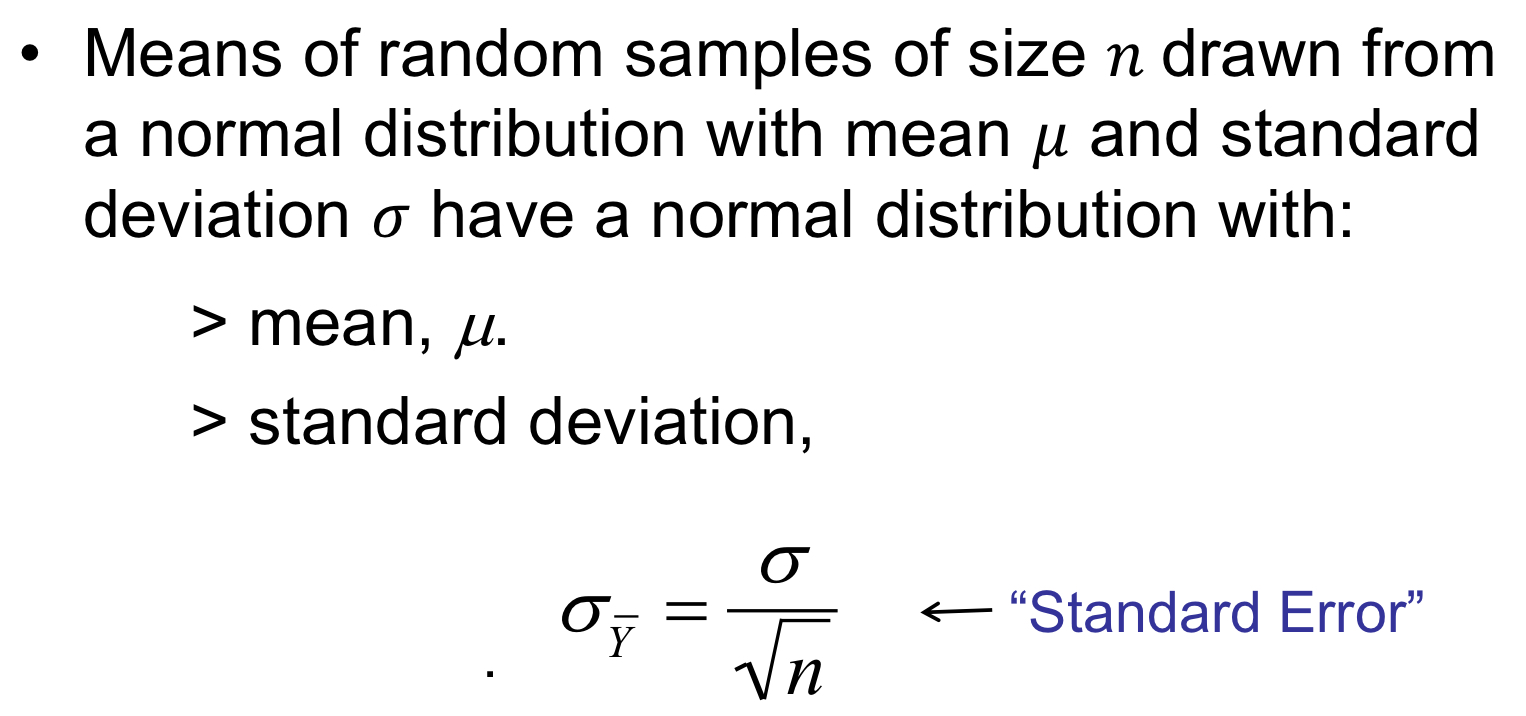
What does ȲN represent?
Sampling distribution
Conclusions about distribution of sample means
- Greater the sample size -> smaller the SE
- As sample size increases -> distribution of the sample means gets narrower
Central Limit Theorem
The mean of a large number of measurements randomly samples from any type of distribution, is approximately normally distributed
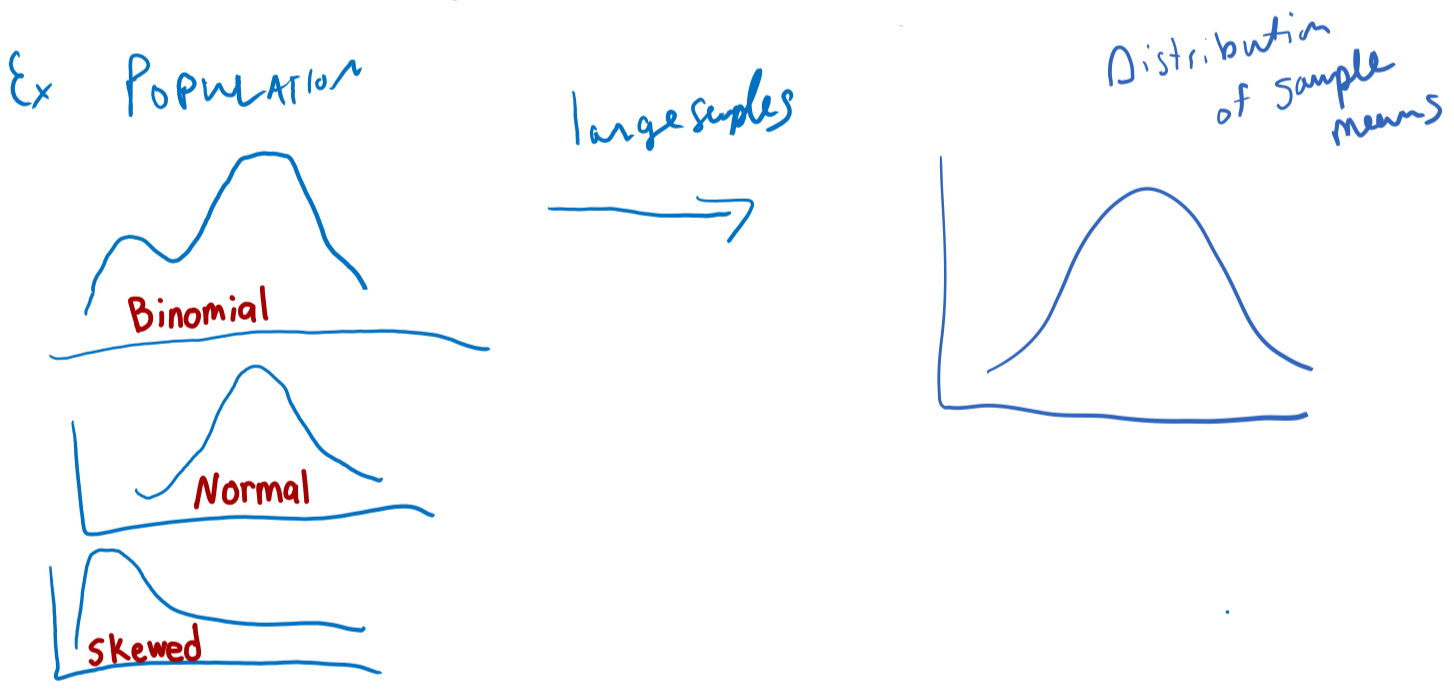
Main Ideas For Central Limit Theorem
1) As sample size increases, the distribution of sample means becomes more normal and narrower
2) Even though the distribution of the population was not normal (ie very skewed or bi- or tri- modal), the distribution of the mean is normal, when we have a large enough sample size
Inference is a technical word for?
Estimating means (“point estimates”)
Calculating confidence intervals (“interval estimates“)
Performing statistical tests
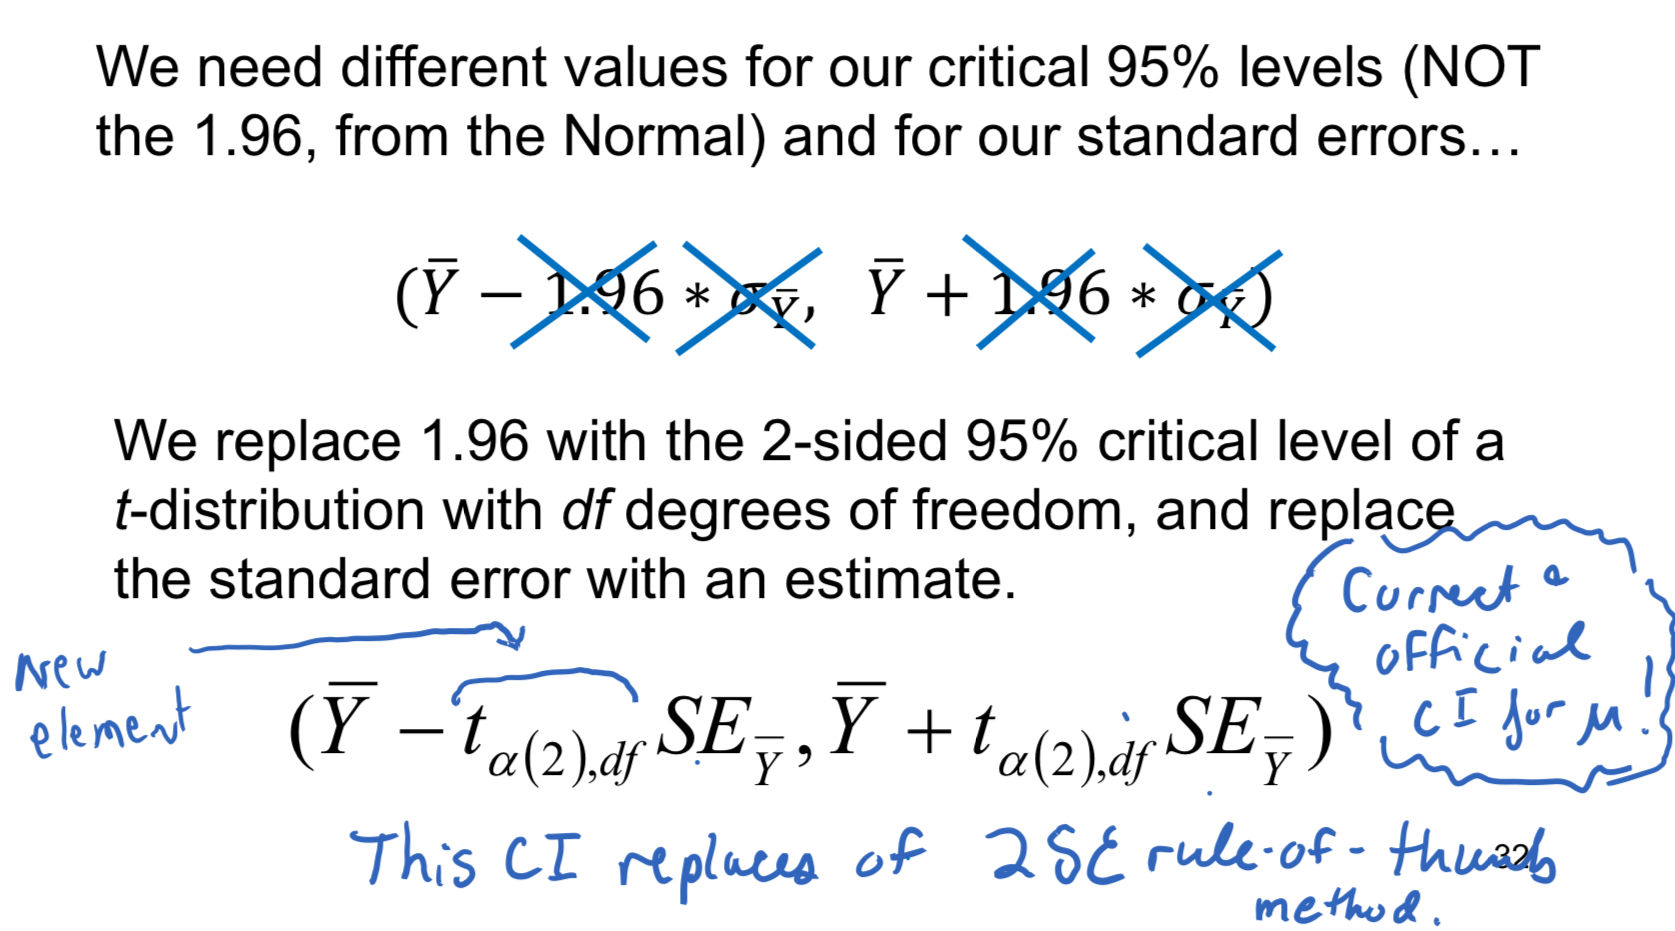
T-distribution quantiles CI
We replace 1.96 with the 2-sided 95% critical level of a t-distribution with df (degrees of freedom), and replace the standard error with an estimate
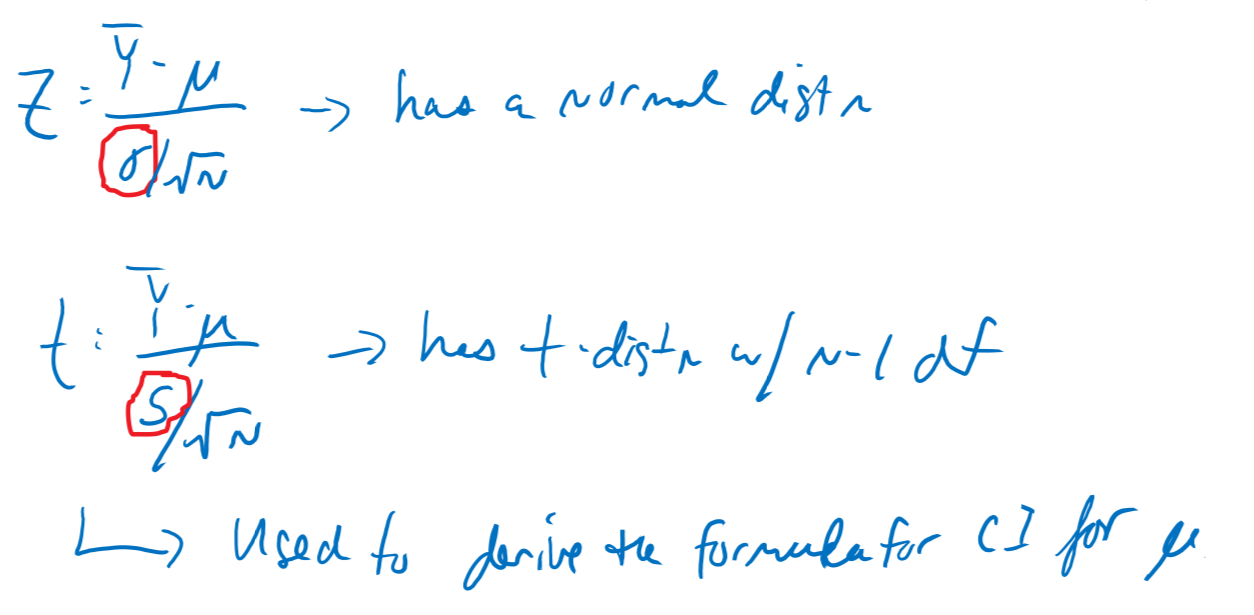
What's a t-distribution?
- It's like a normal distribution, BUT it has slightly heavier tails. The heaviness of the tails depends on sample size or degrees of freedom
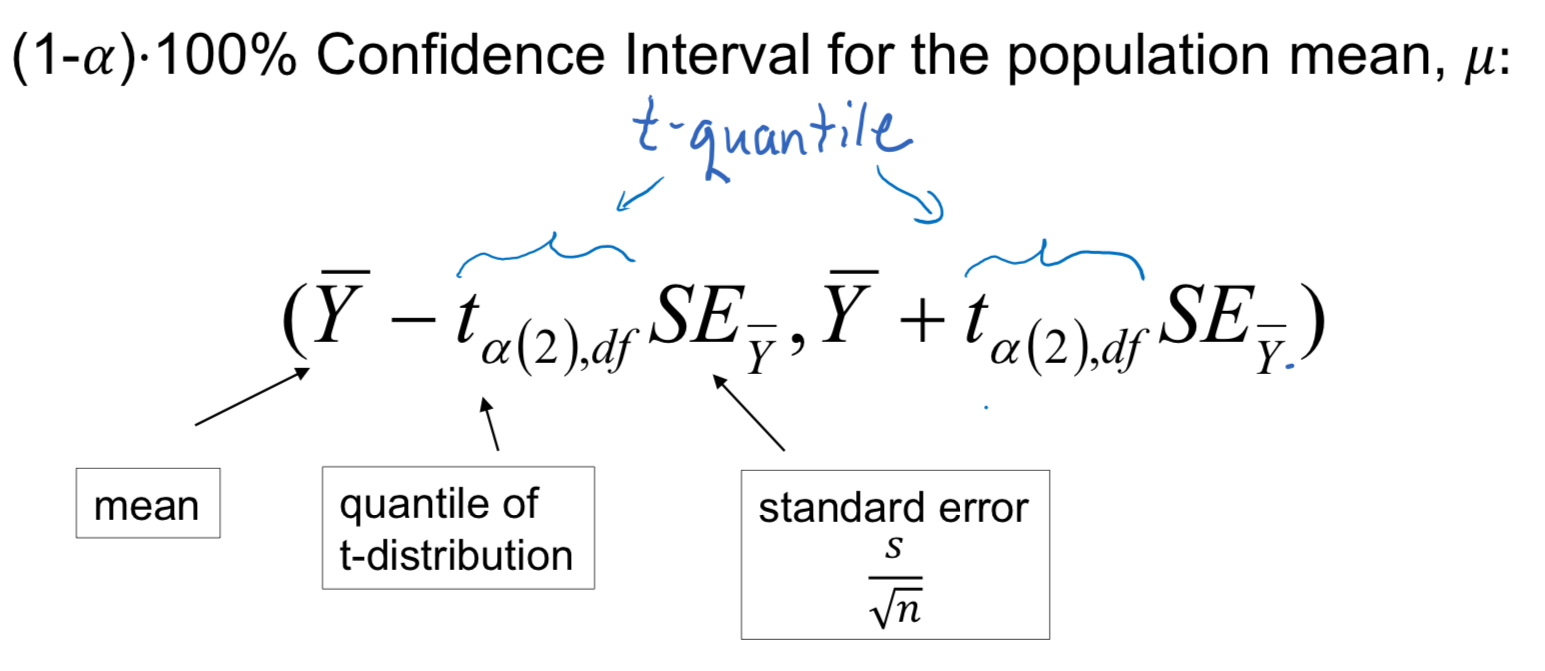
CI for a mean, use t-distribution quantiles
Degrees of Freedom
- The sample size determines the number of degrees of freedom (df) of the t-distribution. It specifies which particular version of the t-distribution is needed
- The degrees of freedom here are always one less than the sample size: df = n - 1
- Small N -> bigger tails
What happens as alpha decreases?
t (quantile of t-distribution) increases and gets more wider
R code to calculate the t-statistic for a given cumulative probability
qt( 1-(alpha/2), df)
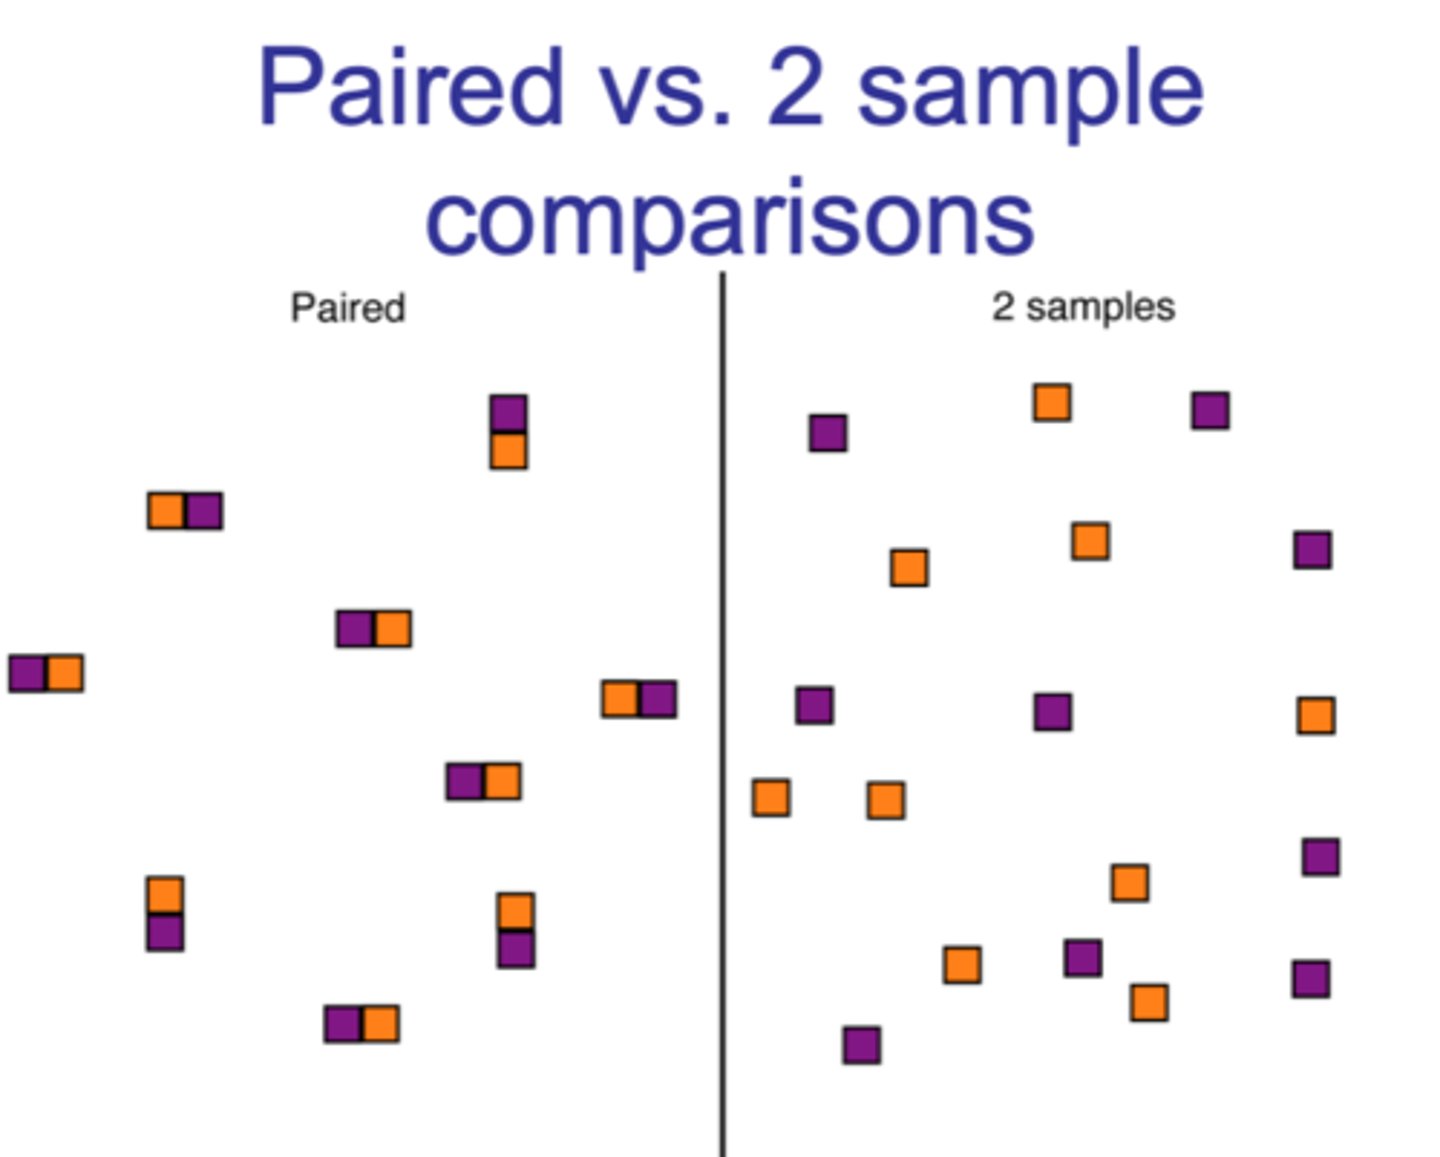
Comparing Two Groups: Paired t-test and Independent Two Sample T-test
- Context: two groups compared on a quantitive variable
- Answer questions like: does this group have better skills than that group?
Paired Vs. 2 Sample Comparisons
Comparing Means
- Tests with one categorical and one numerical variable
- Goal: to compare the means of a numerical variable for two groups
Inference about the means of two independent samples
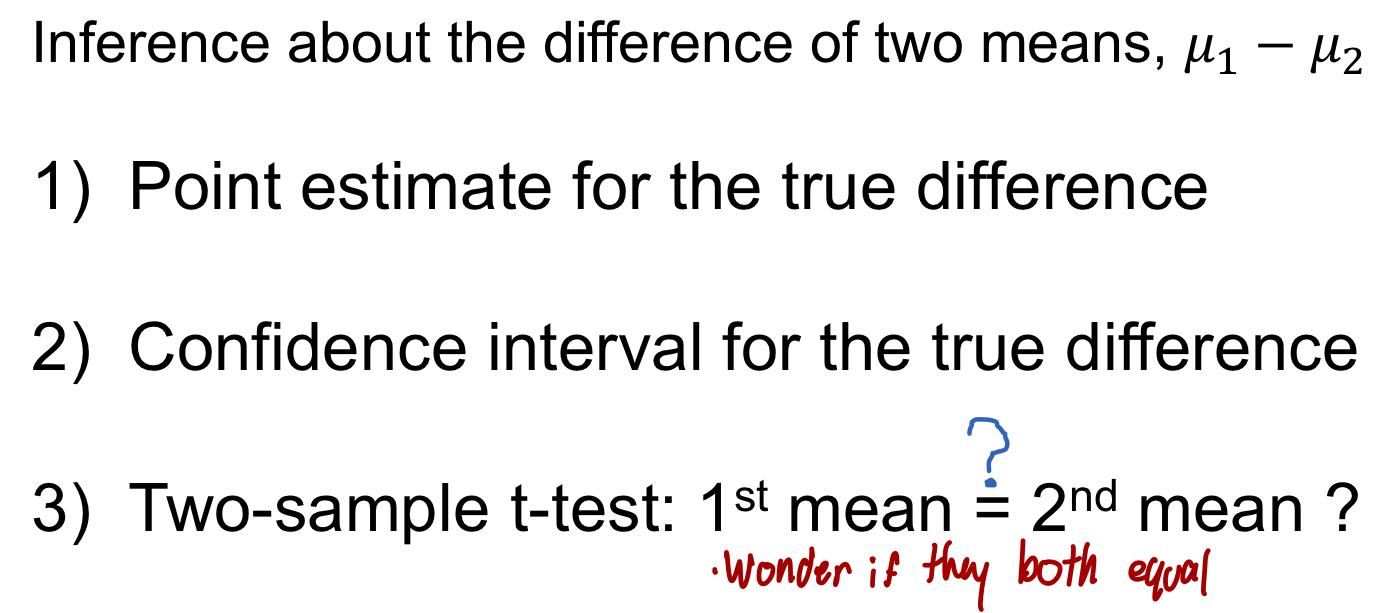
Point estimate of µ1 - µ2
ȳ1 - ȳ2
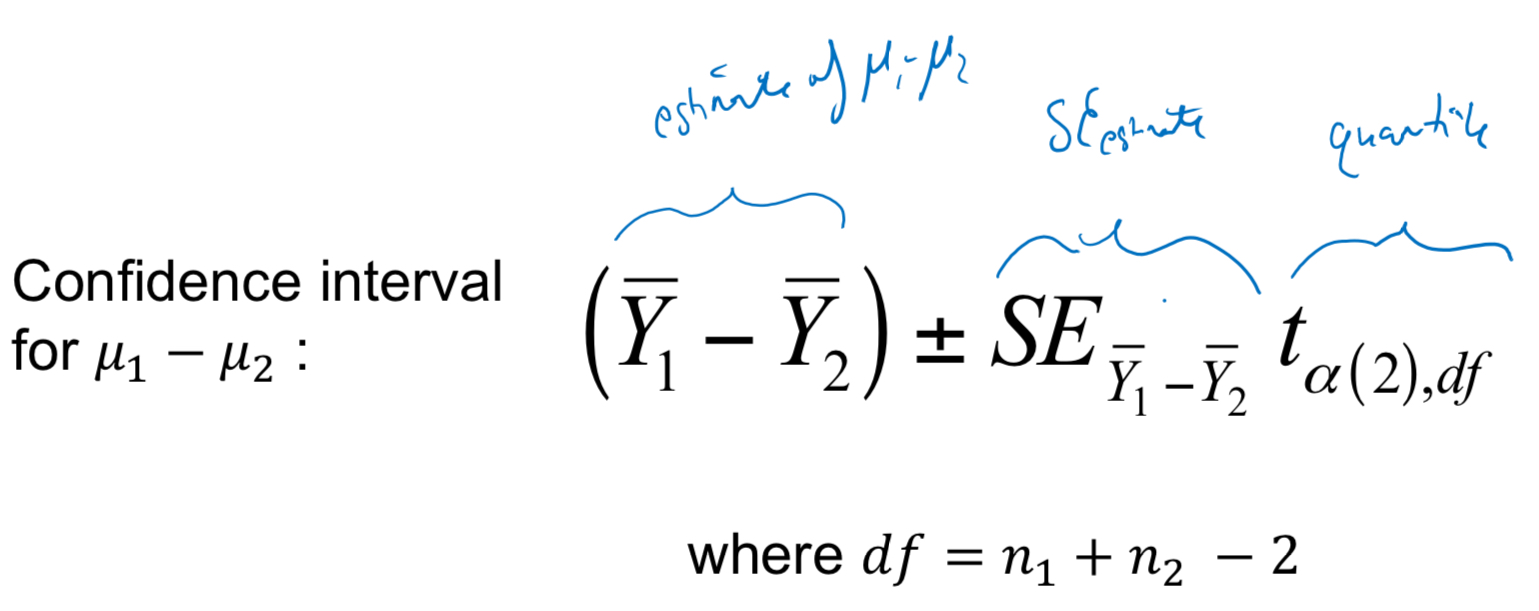
Confidence interval for µ1 - µ2
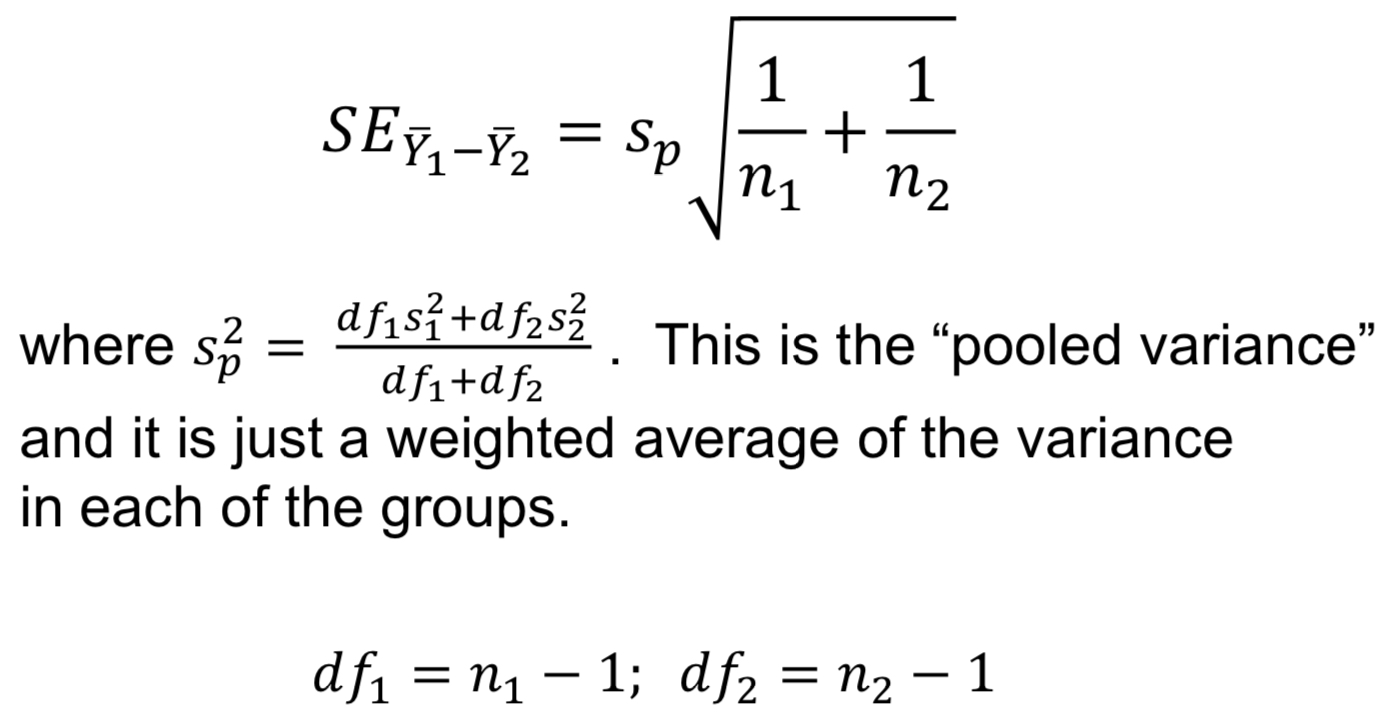
Standard error of difference in means
R code to find the quantile value ta(2),df
qt(1-(a/2), df)
T-test for independent samples
Question: Is the mean of group 1 significantly different from the mean of group 2?
Use: “Two- sample t-test”
The two sample t-test compares what?
The two sample t-test compares the means of a numerical variable among two populations
T of TUNA TEA for 2 sample t-test
Name of test: 2 sample t-test
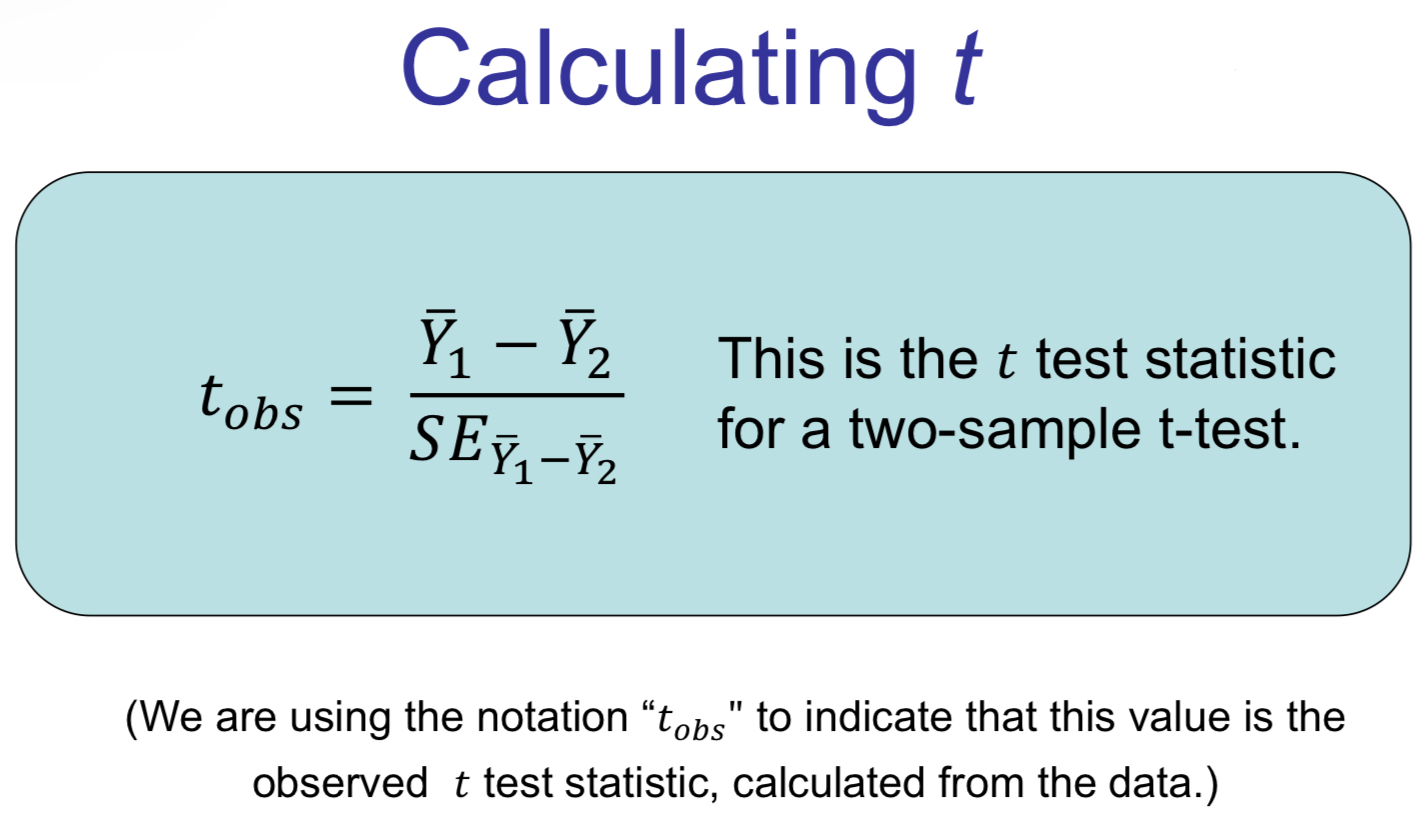
Formula for test statistic: tobs
Value of test statistic: tobs
Formula for tobs
E of TUNA TEA for 2 sample t-test
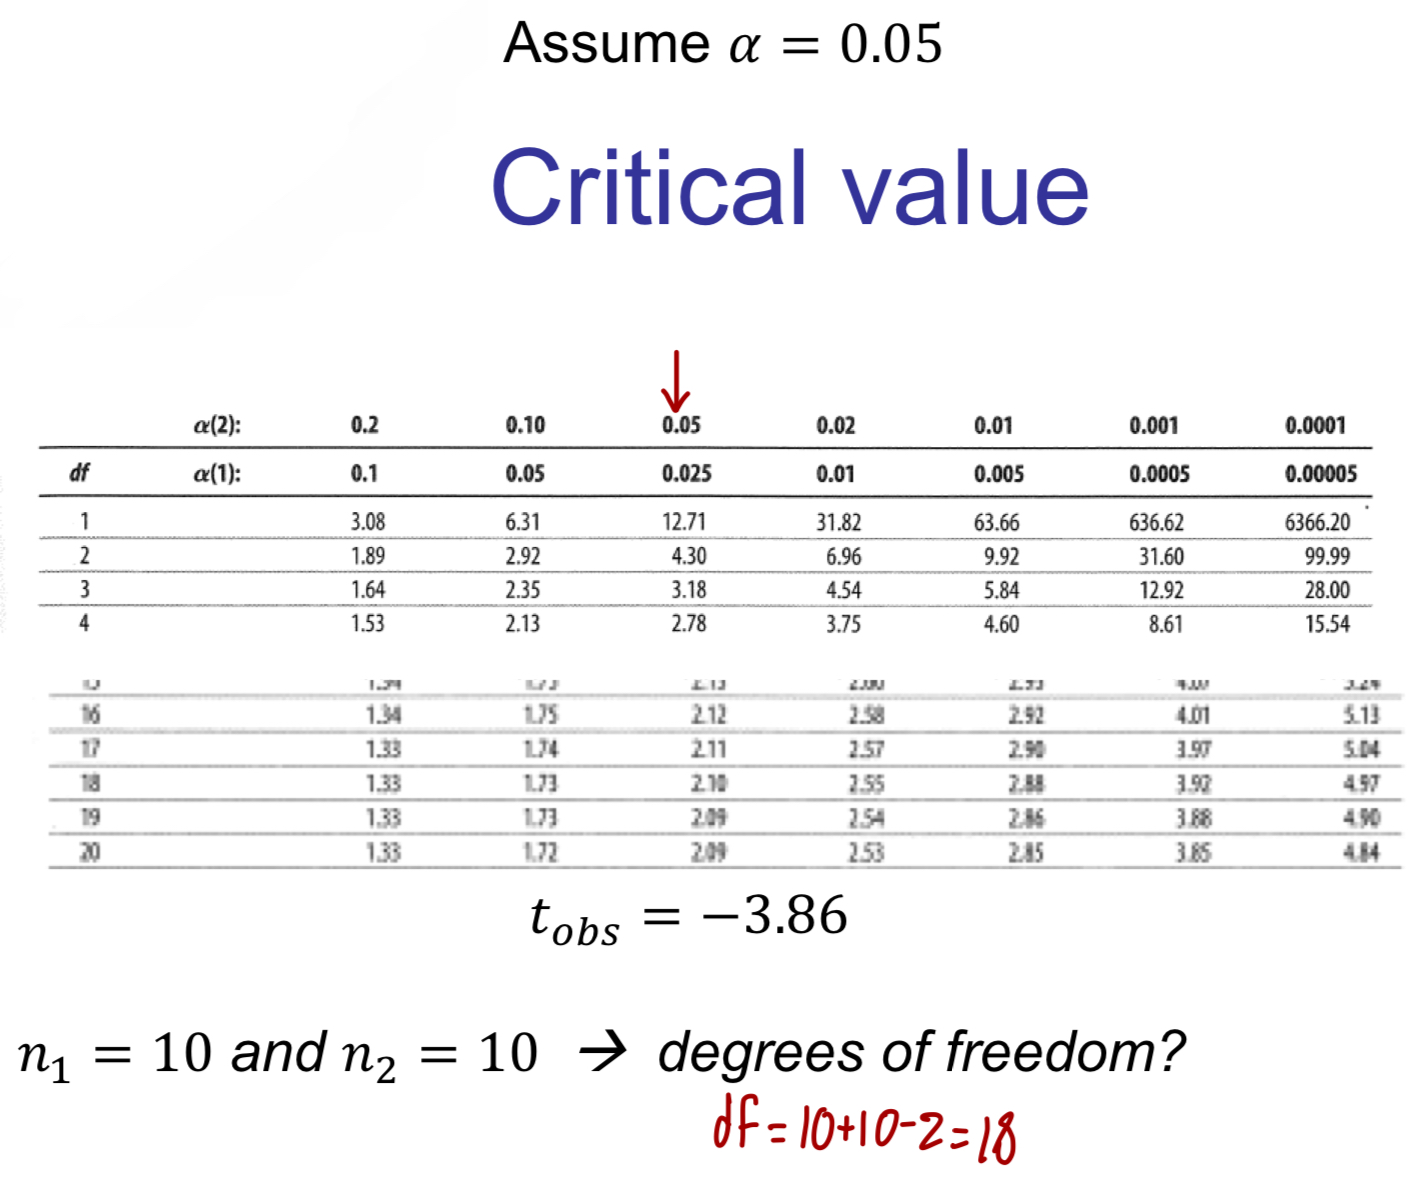
Null distribution of the test statistic, tobs, is. a t distribution with n1 + n2 - 2df
Critical Value or P-Value
Decision
English
How to calculate critical value of tobs?
What are the R codes for P-Values and critical values
P-Value: pt()
Critical Value: qt()
Requirements for a 2-sample t-test
Random sample from each population. Check by learning about the experiment
Normal distribution within each population group. Check with histograms or q-q plots for each group
Approximately the same variances in each group. Check with rule-of-thumb, histogram comparison or Leven’s test. Alternative to the two same test: Welch’s t-test