AP Human Geography - Thematic Maps
4.8(5)
Card Sorting
1/6
Earn XP
Description and Tags
Last updated 3:31 PM on 5/27/25
Name | Mastery | Learn | Test | Matching | Spaced | Call with Kai |
|---|
No analytics yet
Send a link to your students to track their progress
7 Terms
1
New cards
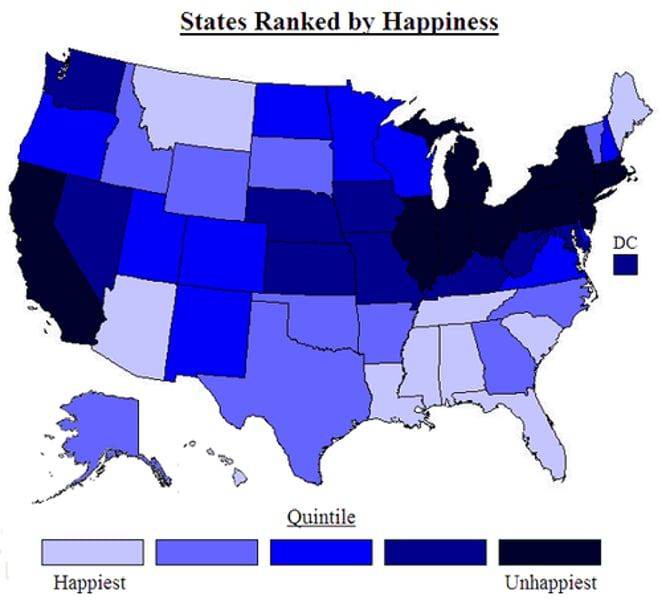
Choropleth Map
Use of different colors or tonal shadings to represent categories of data
2
New cards
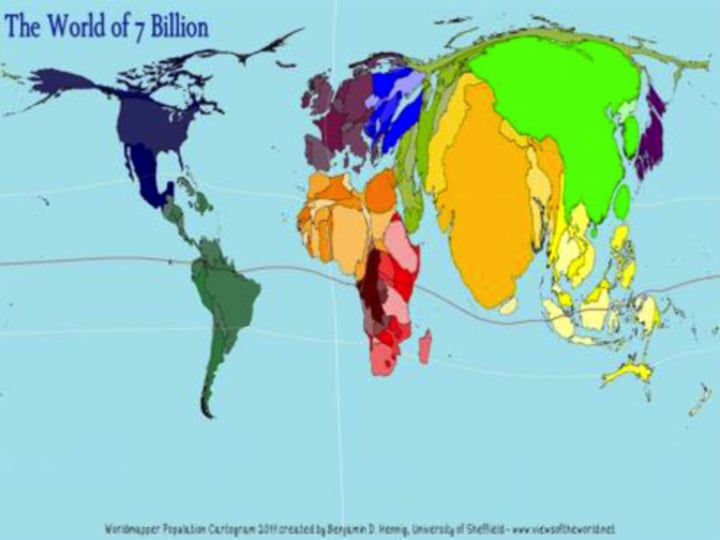
Cartogram Map
Map that distorts the geographic shape of an area in order to show the size of a specific variable
3
New cards
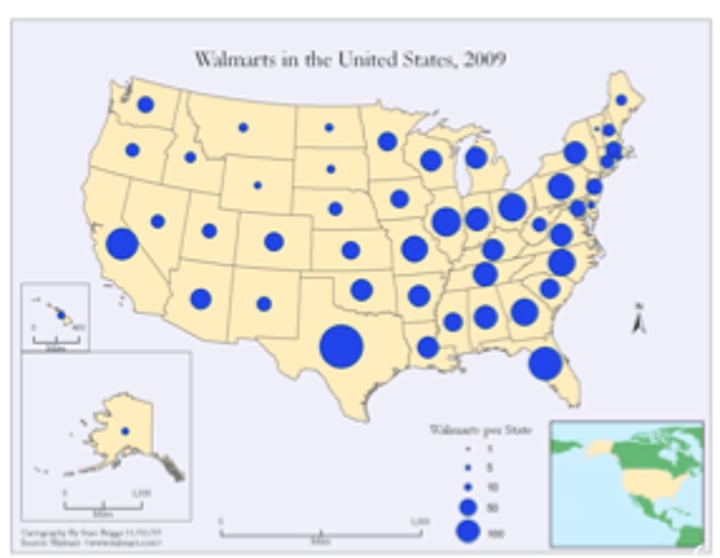
Graduated Symbol Map
A map with symbols that change in size according to the value of the attribute they represent
4
New cards
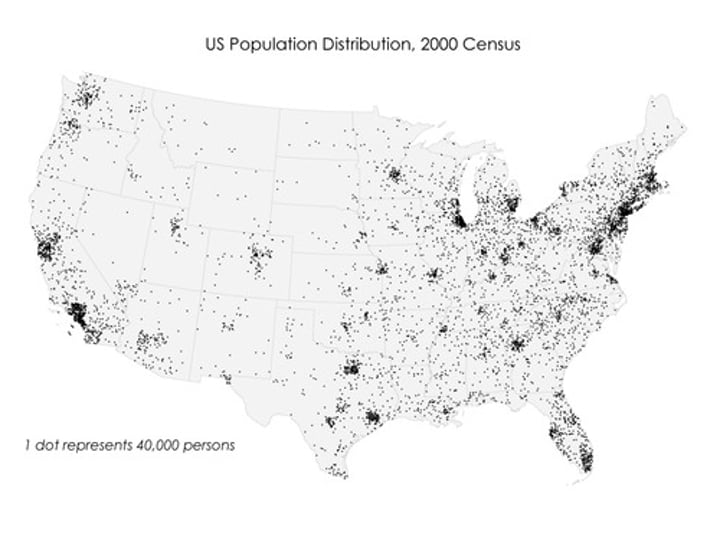
Dot Density Map
Use points to show precise locations of specific observations or occurrences
5
New cards
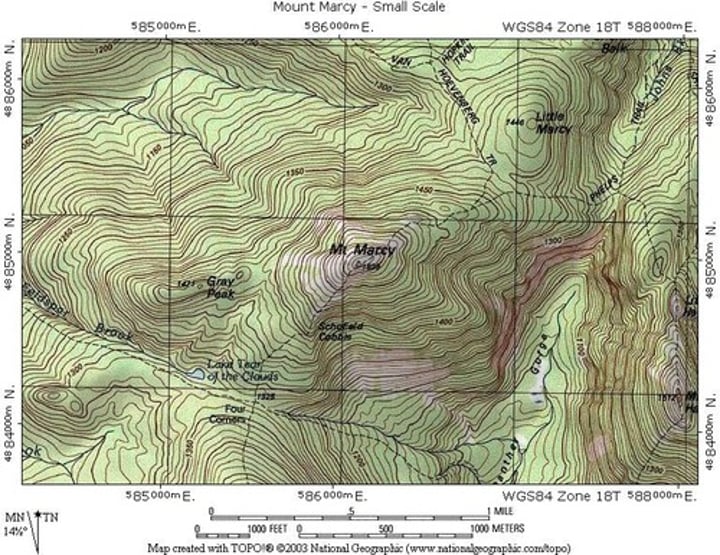
Topographic Map
Include contour (isoline) lines to show the shape and elevation of an area
6
New cards
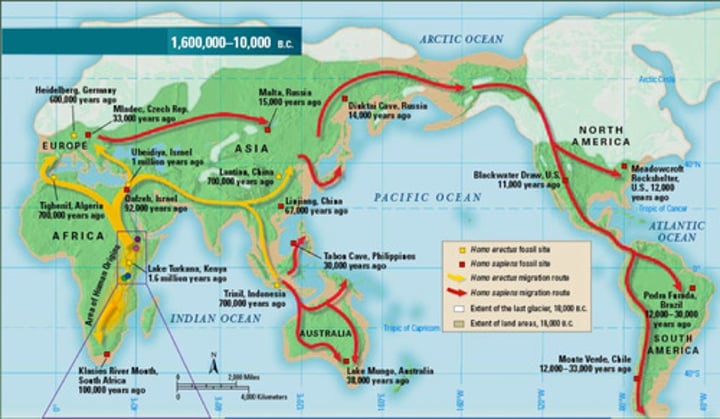
Flow Line Map
Shows movement with arrows of different size
7
New cards
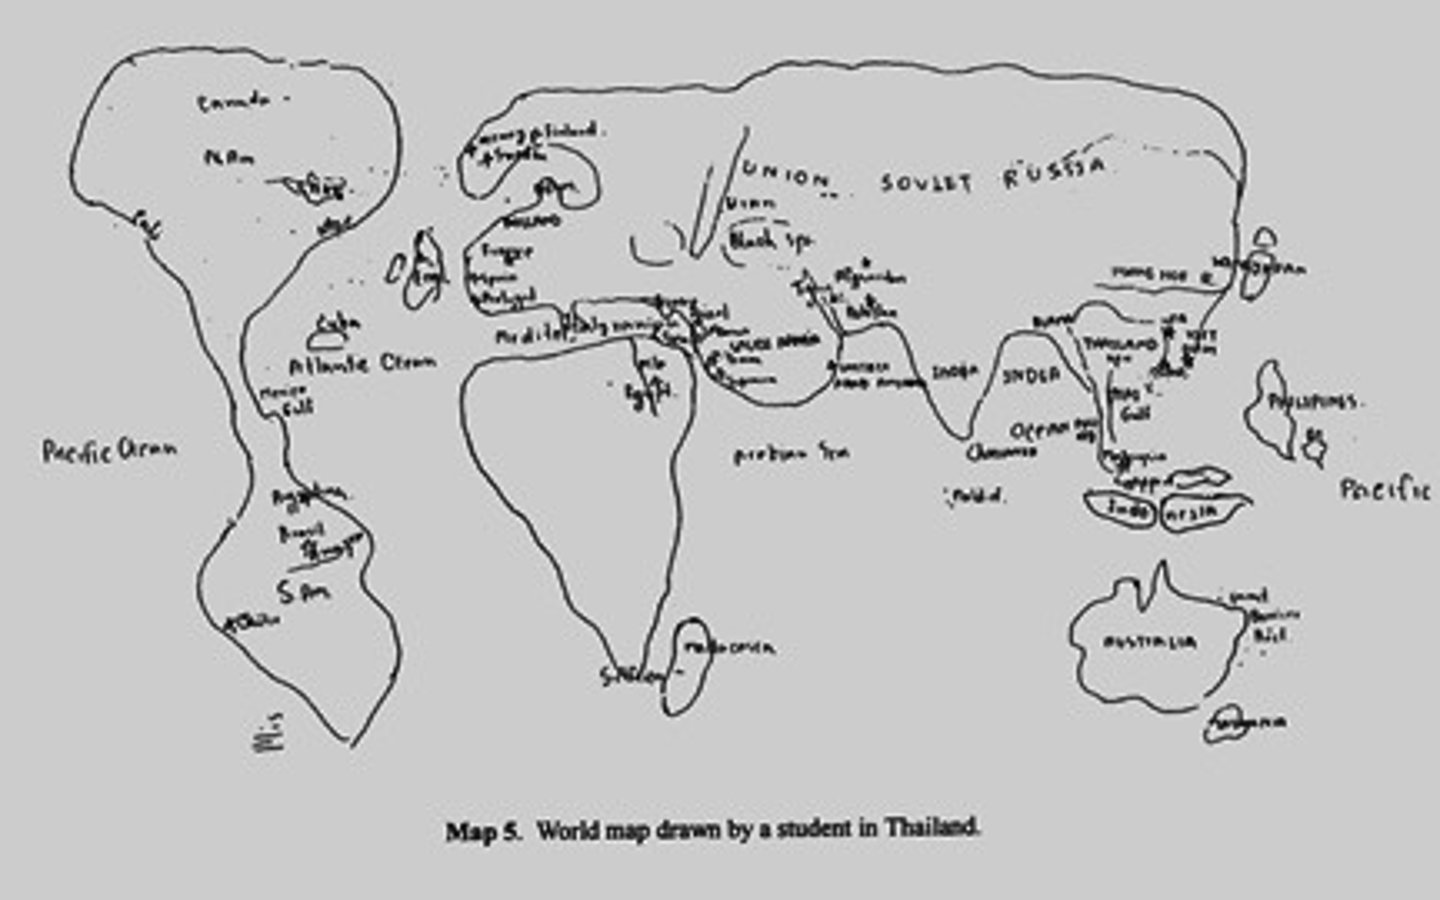
Mental Map
A map which represents the perceptions and knowledge a person has of an area