Long Term Finance: Bonds, Equities & Sustainable Financ
1/55
Earn XP
Description and Tags
Chapter 6 + 7
Name | Mastery | Learn | Test | Matching | Spaced |
|---|
No study sessions yet.
56 Terms
What Is a Bond?
A bond is a long-term debt security issued by governments or corporations to borrow money.
You loan money to the issuer → they pay you interest periodically → repay the principal at maturity.
E.g. Company borrows £1,000 for 30 years, pays interest yearly, and returns £1,000 at the end.
Coupon
The stated interest payment paid on a bond.
Annual coupon = coupon rate x face value
E.g. 12% coupon on £1,000 face value: 0.12 × 1000 = £120 per year
Face Value (Par Value)
The principal amount repaid at maturity or end of term (usually £1,000).
E.g. Investor receives £1,000 at maturity, regardless of earlier bond price.
Coupon Rate
Annual coupon ÷ face value of a bond
Coupon rate = Coupon payment/ face value
E.g. £120 / £1,000 = 12%
Maturity / Time to Maturity
The date when face value is repaid.
E.g. A 30-year bond issued today matures in 30 years.
Redeemable vs. Irredeemable Bonds
Redeemable Bond: Has a maturity date.
Irredeemable Bond (Consol): Has no maturity date → behaves like a perpetuity.
E.g. UK consols pay interest forever and never return principal.
Yield to Maturity (YTM)
The market-required rate of return on a bond.
The interest rate that makes the present value of all cash flows equal the current bond price.
YTM determines how much the bond should be worth.
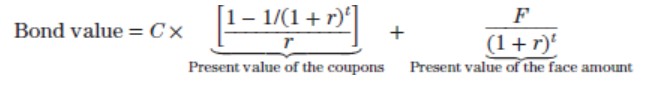
Basic Bond Valuation Formula
A bond = PV annuity (coupons) + PV lump sum (face value).
Bond value = C x (1 - (1 + r)^-t / r) + F / (1+r)^t
C = coupon
F = face value
t = number of periods
r = YTM per period
Conegliano bond example
C = £80
F = £1000
t = 10
r = 8%
Compute PV of coupons: PV annuity = 80 x (1- (1.08)^-10 / 0.08) = 536.81
Compute PV of face value: PV face = 1000/ 1.08^10 = 463.19
Total bond value: 536.81 + 463.19 = £1000 → sells at par (exactly face value) With an £80 coupon, this bond pays exactly 8 per cent interest only when it sells for £1,000 as the going interest in the market is 8%.
Coupon rate = YTM
Discount Bond
Bond sells below face value.
Occurs when Coupon rate is less than YTM
E.g. Bond with 8% coupon when market rate is 10%.
Price ≈ £885.
Premium Bond
Bond sells above face value.
Occurs when coupon rate is greater than YTM
E.g. 8% coupon when market rate is 6% → Price ≈ £1,136.
Why Bond Prices Change
Bond price and interest rate relationship:
Interest Rates ↑ → Bond Prices ↓Interest Rates ↓ → Bond Prices ↑
Reason: Cash flows are fixed, but discount rate changes.
Interest Rate Risk
Risk that bond prices will fluctuate when interest rates change.
Two factors increase risk:
1. Longer maturity → Higher risk
Changes in rates affect long-term discounting more drastically.
2. Lower coupon → Higher risk
More of the bond’s value is from distant face value → more sensitive to rate changes.
Maturity Example
Compare price sensitivity:
1-year bond → small price change
30-year bond → large price change
Longer bonds’ values depend heavily on distant discounting.
Coupon Example
Compare:
3% coupon bond
10% coupon bond
Both have same maturity → the low-coupon bond reacts more sharply to rate changes.
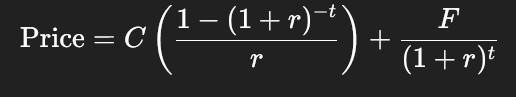
Finding YTM (Trial & Error)
You know:
Price
Coupon
Face value
Maturity
You solve for the unknown r in: Price (bond value) = C( 1 - (1 + r)^-t / r) + F/ (1 + r)^t
You cannot isolate r algebraically.
Method:
Try different r until both sides match (like solving annuity interest rates).
Trial-and-Error Example
Bond:
6 years
Coupon = £80
Face value = £1000
Price = £955.14
Check YTM:
Try 8% → Too low (price too high).
Try 10% → Too high (price too low).
Try 9% → Matches the given price.
✔ YTM = 9%
Current Yield
Measures only the income return.
bond’s annual coupon divided by its price.
Current yield = Annual coupon / price
E.g. £80 / £955.14 = 0.0838 = 8.38%
Why different from YTM?
Current Yield ignores capital gain/loss.
YTM includes both coupon + price return.
Price Gain/Loss Effect
Discount bond → built-in gain at maturity
Premium bond → built-in loss at maturity
Current yield misses this → YTM adjusts for it.
What Affects Bond Prices
Coupon size
Market interest rates
Time to maturity
Discount/premium structure
Required yield by investors
Bond price = present value of fixed cash flows
What Are Bond Ratings?
Bond ratings are professional assessments of a bond issuer’s creditworthiness—how likely they are to repay their debt.
A rating tells investors how risky a bond is in terms of default risk, not price volatility.
E.g. Moody's, S&P, and Fitch grade bonds from AAA (very safe) to D (default).
Who Gives Bond Ratings?
The three main rating agencies:
Moody’s
Standard & Poor’s (S&P)
Fitch
These agencies are paid by firms/governments to rate their debt.
What Do Bond Ratings Measure?
ond ratings measure only default risk.
Important:
They do not measure:
interest rate risk
price volatility
A highly rated AAA bond can still fluctuate in price if market interest rates change.
Investment Grade vs. Junk Grade
Investment-Grade Bonds (safer):
S&P / Fitch: BBB or above
Moody’s: Baa or above
Junk Bonds (high risk, high yield):
Rated below BBB / Baa
Also called high-yield bonds
Example:
A BB bond = junk bond → higher chance of default → higher interest rate.
Rating Scales (Quick Guide)
S&P / Fitch:
AAA
AA
A
BBB → investment grade ends here
BB, B, CCC, CC, C, D → junk
Moody’s:
Aaa
Aa
A
Baa → investment grade ends
Ba, B, Caa, Ca, C → junk
Fallen Angels
Investment-grade bonds that are downgraded into junk territory.
E.g. During COVID-19, many firms lost revenue → downgraded by S&P.
Determinants of Credit Ratings
Credit rating agencies look at:
Sovereign (government) risk factors
Corporate risk factors
Macroeconomic conditions
Industry performance
Bond-specific features
Some are measurable, others are subjective.
Sovereign Bond Rating Factors
1. Political Risk: Government stability, Corruption levels, Transparency, Security
2. Economic Strength: GDP growth, Income inequality, Efficiency of public sector, Financial sector quality, Workforce flexibility
3. Government Debt Levels: High debt → lower rating
4. Monetary & Fiscal Flexibility: Independent central bank, Good quality economic data, Sensible budget spending, Ability to respond to shocks
Corporate Bond Rating Factors
1. Financial Risk (Most Important): Ability to make debt payments, Liquidity, Cash flow strength
2. Company Debt Burden: Increasing or decreasing debt? Is leverage manageable?
3. Capex Plans: Large upcoming spending → increases risk
4. Forecast Earnings: Will profits be enough to pay debt?
If a company looks less able to repay debt → lower rating.
Macroeconomic Factors That Affect Ratings
Examples that change credit ratings:
Rising inflation → borrowing becomes more expensive
Global oil price increases → higher production costs → lower profits
Currency movements → affect companies with foreign debt
Economic recessions → lower revenue → rating downgrades
Example:
Oil price spikes can cause manufacturing firms to miss earnings forecasts → rating drops.
Industry-Specific Factors
Declining industries → lower ratings
High-growth or stable industries → better ratings
Regulatory changes also matter
Example:
Tightened environmental rules can hurt oil companies more than tech firms.
Bond-Specific Factors
Some bond structures are riskier:
Subordinated (junior) debt → lower rating
Secured debt → higher rating (assets back it)
Callable bonds → often riskier to investors
Why Ratings Matter
Higher credit rating →
lower default risk
lower interest rate required
cheaper borrowing for the issuer
Lower credit rating →
higher interest rate demanded → higher bond coupon
more expensive borrowing
harder to issue new debt
Ratings Can Change
Ratings are not fixed. They change when:
Company profits fall
Debt rises too much
Economic conditions worsen
Political instability grows (for governments)
Example:
Many firms were downgraded in 2020 during COVID-19.
Why Investors Care
Ratings help investors judge:
how risky a bond is
whether the return is worth the risk
whether it fits their investment rules (many funds must hold investment-grade bonds)
Why Companies Pay for Ratings
Because ratings influence:
borrowing costs
investor interest
ability to issue bonds
company reputation
Higher rating → cheaper funding → competitive advantage.
Why Shares Are Harder to Value Than Bonds
Shares are harder to value because:
Dividends (cash flows) are uncertain
Shares have no maturity → infinite life
Required return (R) is not directly observable
Despite this, we can estimate share value using present value of expected future dividends.
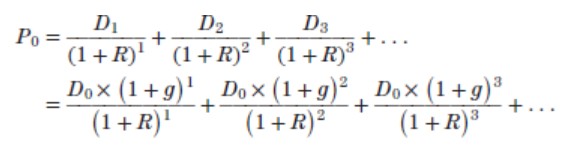
Basic Equity Valuation Idea
The value of a share today (P₀) = present value of all future dividends.
Values of share price today = the discounted value of all future dividends.
no matter what the share price is, the present value is essentially zero if we push the sale of the equity far enough away.1 We are eventually left with the result that the current price of the equity is the present value of the dividends beginning in one period and extending out forever
Example: One-Year Holding Period
Considering buying share of equity today, sell it on one year. You will receive:
Dividend next year = £10
Sell share next year for £70
Required return = 25%
Total future cash: 10 + 70 = £80
Present value = d + FV/ 1+ r
£80 / 1.25 = £64 paid today
General One-Period Formula
let P0 be the current share price, and assign P1 to be the price in one period. D1 is the cash dividend paid at the end of the period
P0 = D1+ P1/ 1 + r
D1 = dividend next year
P1 = share price next year
R = required return
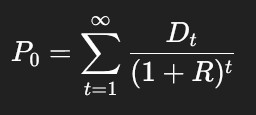
Infinite Dividend Discount Model
By repeatedly substituting future P₁, P₂, etc., the price simplifies to:
Share value = PV of all future dividends forever.
Three Dividend Patterns
We consider 3 special valuation cases:
Zero growth (constant dividend)
Constant growth (dividend grows at rate g forever)
Non-constant growth (supernormal growth then stabilises)
Zero Growth (Constant Dividend)
Dividends = constant forever → a perpetuity.
P0 = D/ R
E.g. Dividend = €10 per year, R = 20%: 10/ 0.20 = £50 P0
Constant Growth (Dividend Growth Model)
Dividends grow at rate g forever:
D1=D0(1+g)
Share price today:
P0 = D1/ R - g
Condition: g < R
Constant Growth Example
D0=£2.30, g=5%, R=13%
D1=2.30(1.05)=£2.415
P0 = 2.415/ 0.13 - 0.05 —= £30.19
Future Price with Constant Growth
Share price in year t:
Pt = Dt + 1/ R - g
E.g. Price in year 5
D5 = D0)1 + g)^5
P5 = D6/ R - g
(where D6=D5(1+g))
When the Constant Growth Model Fails
If g > R
→ Value becomes infinite / formula breaks
Because dividends grow faster than the discounting effect.
Non-Constant Growth (Supernormal Growth)
Dividends grow irregularly for a few years, then settle at constant rate.
Steps:
Forecast dividends during high-growth years
Compute price at start of constant growth using dividend growth model
Discount everything back to today
Non-Constant Growth Example
Company pays no dividends until year 5.
Year 5 dividend = €0.50, grows at 10% forever.
Required return = 20%.
Price in year 4:
P4: 0.50/ 0.20 - 0.10 = £5
P0: 5/ 1.20^4 = £2.41
Non-Constant Growth with Early Dividends
Year 1: €1
Year 2: €2
Year 3: €2.50
After that → constant growth of 5%
Required return = 10%
Price at time 3:
P3: 2.50(1.05)/ 0.10 - 0.05 = £52.50
Present value of:
Dividends for years 1–3
Plus discounted P3
P0=€43.88
Two-Stage Growth
Growth rate g₁ for t years → then growth g₂ forever.
Value:
P0=PV of dividends during stage 1+PV of Pt
Where:
Pt = Dt + 1/ R - g2
Used when firms have early high growth then long-term stable growth.
Components of Required Return
From the dividend growth model:
R = (D1/ P0) + g
2 components:
Dividend yield D1/ P0 income return from dividends
Capital Gains Yield (g) the growth rate of dividends and share price
Required Return Example
Share price = €20
Dividend next year = €1
Dividend growth = 10%
R: 1/20 + 0.10 = 0.05 + 0.10 = 0.15
Required return is 15%
Verifying Required Return
Price in one year:
P1 = 20(1.10) = 22
Return =
Dividend yield: 1/20=5%
Capital gain: (22−20)/20=10%
Total return = 15%
P/E Ratio
P/E Ratio = share price/ Earnings per share
High P/E → High growth expectations
Low P/E → Slower growth / mature industries
Tech = high P/E
Utilities / mining = low P/E
Notes on P/E Ratios
P/E ratios fluctuate with market conditions
COVID-19 caused unusual ratios (price crash → low P/E)
Can be distorted by very low earnings (denominator effect)