KNES 375 Midterm Review (for study guide)
1/23
There's no tags or description
Looks like no tags are added yet.
Name | Mastery | Learn | Test | Matching | Spaced |
|---|
No study sessions yet.
24 Terms
What is the difference between criterion evaluations and normative evaluations?
criterion evaluation → for determining achievement of a specific level (NOT compared to others!)
normative evaluation → comparing results of one individual to others
In what order would formative vs. summative evaluations take place?
formative first then summative
formative assessment → helps understand and define initial conditions, current health status, etc., “starting point”) e.g. quizzes throughout the semester
summative assessment → drawing conclusions, determining effectiveness of a program, describing changes, planning (becoming the new formative assessment in the process) e.g. final exam at end of the semester
What individuals were responsible for the start of the fitness revolution that started in the late 1800’s?
Edward Hitchcock → 1st physical educator at collegiate level, “crusader for fitness”, anthropometric measures
Dudley Sargent → student of Hitchcock, intercollegiate strength testing (including vertical jump test), cardiorespiratory function, father of the cable-based workout machine
What were the basic physical abilities (conceived by Hitchcock and Sargent)?
strength → ability to move/manipulated heavy objects
resistance → ability to resist an external force
speed → ability to move quickly + accurately the limbs or the body as a whole
flexibility → ability to move the limbs through their full range of motion
What events, conditions, discoveries were made around the late 1800’s that helped lead to this new concern about physical health and wellness?
the industrial revolution + urbanization→ people were more sedentary, awful working conditions low life expectancy, more free time = bad lifestyle habits = appearance of lifestyle-related diseases
April 6th, 1896 → rebirth of modern-day Olympics
What are the dimensions of health? Is wellness the same as health or something different?
physical, mental/emotional, environmental, spiritual, social, intellectual
health definitions:
health is the freedom from illness (mental + physical), disability (mental + physical) and disease
a state of complete physical, mental + social well-being, not merely the absence of disease
wellness definitions:
an approach to personal health which puts emphasis on the individual’s responsibility for their own well-being thru emphasis on holistic health promotion lifestyle behaviours, wellness is the active process toward making healthy life choices
As we have developed things like “germ theory” and “physical education” life spans have greatly increased (London in ~1850 average life expectancy was around 40 yrs!). This has caused a shift in health care focus. What was the shift, and how are we adjusting for it?
the shift was from causes of death being related to trauma and infectious diseases to being from chronic disease
adjusting by making changes to:
the working environment
the broader environment
diet
physical activity
When did the surgeon general link (cardiovascular disease) CVD to inactivity?
1996
Why did we not worry about inactivity in the 1800’s and early 20th century?
physical activity/labor was part of the lifestyle in rural communities (farming), industrialization still required some form of physical labor, no technology to encourage sedentarism, less free time
What “problems” does increased life-expectancy have on a country’s economy?
aging population which can lead to:
increased healthcare costs
pension burden
shrinking workforce
higher dependency ratio
What percentage of children and youth meet daily recommended activity requirement to be considered active?
37.6%
Along with cardiovascular health, what other aspects of a person increase and then decay (without maintenance)?
cognitive function
muscle strength
bone density
balance + coordination
lung function
metabolic health
flexibility
When a person is compared to a group of their peers, what type of comparison would that be?
norm-referenced assessment
When a person is compared to an established standard, what type of comparison would that be?
criterion-referenced assessment
Is the decline in physical fitness inevitable regardless of training or physical activity?
no, the decline in physical fitness is not entirely inevitable, especially not at the same rate, and not in all areas, if training and physical activity are maintained.
some natural decline is expected with age, due to biological factors — but how much and how fast you decline depends heavily on your lifestyle
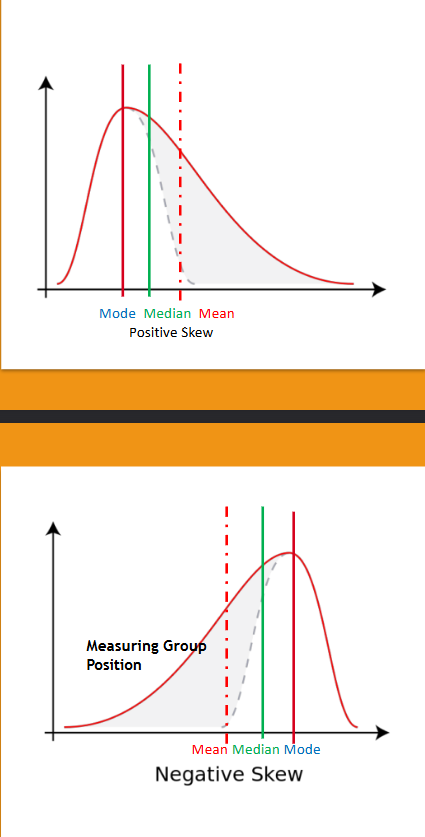
What is skew? How does it affect the mean, mode, and median values?
skew refers to the asymmetry of the data
positive skew (right skew) → tail is on the right, mean is pulled to the right of the median
negative skew (left skew) → tail is on the left, mean is pulled to the left of the median
no skew → symmetrical or normal distribution, mean, median + mode should all be ~equal
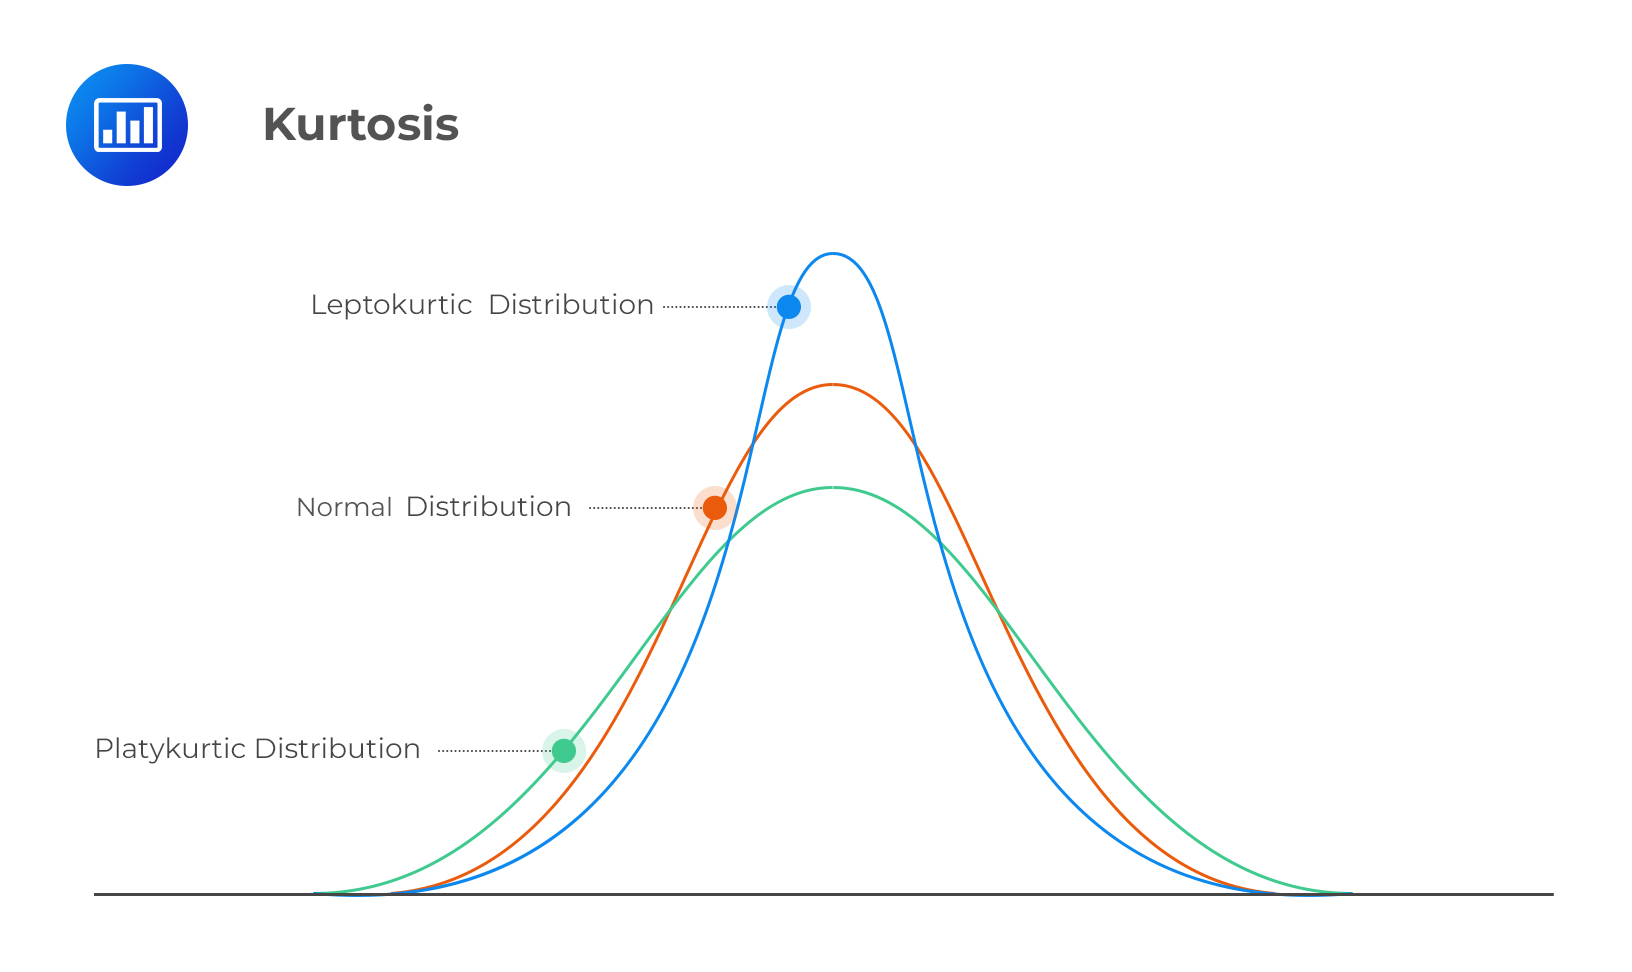
What is kurtosis? What are the 3 variations and what do they imply about the data set?
Kurtosis looks at how data are concentrated in the tails and around the mean.
It tells us about:
The extremes (outliers)
How sharp or flat the peak is
The spread of the distribution
1) leptokurtic → kurtosis > 0, fat tails, skinny, tall peak (many values close to the mean), small amount of variance
2) mesokurtic (normal distribution) → kurtosis = 0, normal tails, moderate width + height of the peak
3) platykurtic → kurtosis < 0, thin tails (fewer outliers), flat + wide peak, less concentrated around the mean, large amount of variance
What is the difference between a “Gold Standard”, “Criterion Standard”, “Normative Standard”?
gold standard → The best possible, most accurate, and most reliable method available for measuring or assessing something
criterion standard → A predefined level of performance or threshold that an individual must meet or exceed to demonstrate competence or success
normative standard → A standard based on how an individual compares to a larger group (the "norm group")
What is the square of the standard deviation?
the variance
Understand what types of variables you can use with specific types of tests. For example: What types of data can you do a T-test on? What assumptions do you make (when using a t-test)?
A t-test is used to determine whether there is a statistically significant difference between the means of two groups
Types of Data You Can Use with a T-Test:
✅ Dependent Variable:
Must be continuous (interval or ratio level data)
Examples:
Test scores (0–100)
Weight (in kg)
Time (in seconds)
Blood pressure
✅ Independent Variable:
Must be categorical with 2 groups (binary)
Examples:
Gender (male/female)
Treatment vs. control
Before vs. after
Types of T-Tests and When to Use Them
Test Type | Used When… | Example |
|---|---|---|
Independent Samples T-Test | Comparing two separate groups | Test scores: males vs. females |
Paired Samples T-Test | Comparing the same group at two times | Weight before vs. after a program |
One-sample T-Test | Comparing a sample mean to a known value | Is a class average different from 75%? |
Assumptions of a T-Test
To validly use a t-test, the following assumptions should be met:
Assumption | Explanation |
|---|---|
1. Normality | The dependent variable should be approximately normally distributed (especially important with small samples). |
2. Independence | Observations must be independent (one person’s data doesn’t affect another’s). |
3. Homogeneity of Variance | For independent t-tests: the two groups should have equal variances |
4. Scale of Measurement | The dependent variable must be continuous (interval or ratio). |
5. No significant outliers | Extreme values can distort the result — check with box plots or z-scores. |
What kind of data can you run a frequency table analysis on?
categorical (nominal → no order e.g. gender, eye colour, ordinal → ordered categories e.g. pain rating)
discrete numerical (# of children, # of goals scored)
continuous data (only when grouped into ranges, e.g. height, weight, test scores, time)
What types of graphs are used in correlations?
scatter plot
line graph
heat map
bubble plot
What do correlations mean / imply?
A correlation measures the strength and direction of a relationship between two variables, tells you how changes in one variable are associated with changes in another
What are the four data containers, what does putting data into them mean? What does it do to the tests you can run?
1. Nominal Data (Categorical)
Data divided into categories without any order or ranking.
Examples: Gender (male/female), blood type (A, B, AB, O), colors.
Putting data into this container means: You’re simply labeling or classifying items.
Tests:
You can use frequency counts, chi-square tests, mode, and non-parametric tests.
You cannot calculate means or standard deviations.
2. Ordinal Data
Data that can be ordered or ranked, but the distances between ranks are not necessarily equal.
Examples: Likert scales (agree, neutral, disagree), race placements (1st, 2nd, 3rd).
Putting data into this container means: You know the order, but not the exact difference between values.
Tests:
Use median, percentiles, non-parametric tests (e.g., Mann-Whitney U, Wilcoxon).
Mean and standard deviation are less appropriate because intervals aren’t equal.
3. Interval Data
Numeric data with equal intervals between values but no true zero point.
Examples: Temperature in Celsius or Fahrenheit, IQ scores.
Putting data into this container means: You can measure differences between values meaningfully, but ratios don’t make sense (e.g., 20°C is not “twice as hot” as 10°C).
Tests:
You can use means, standard deviations, t-tests, ANOVA, correlations.
Ratio-based calculations are not valid due to no true zero.
4. Ratio Data
Numeric data with equal intervals and a true zero point (meaning absence of the quantity).
Examples: Height, weight, time, income, age.
Putting data into this container means: You can do all arithmetic operations (add, subtract, multiply, divide).
Tests:
All statistical tests for interval data apply here, plus meaningful ratios (e.g., twice as heavy).