Cape Geography Unit 1 module 1: POPULATION AND SETTLEMENT
1/216
There's no tags or description
Looks like no tags are added yet.
Name | Mastery | Learn | Test | Matching | Spaced | Call with Kai |
|---|
No study sessions yet.
217 Terms
population
the total number of people living in an area at a particular point in time.

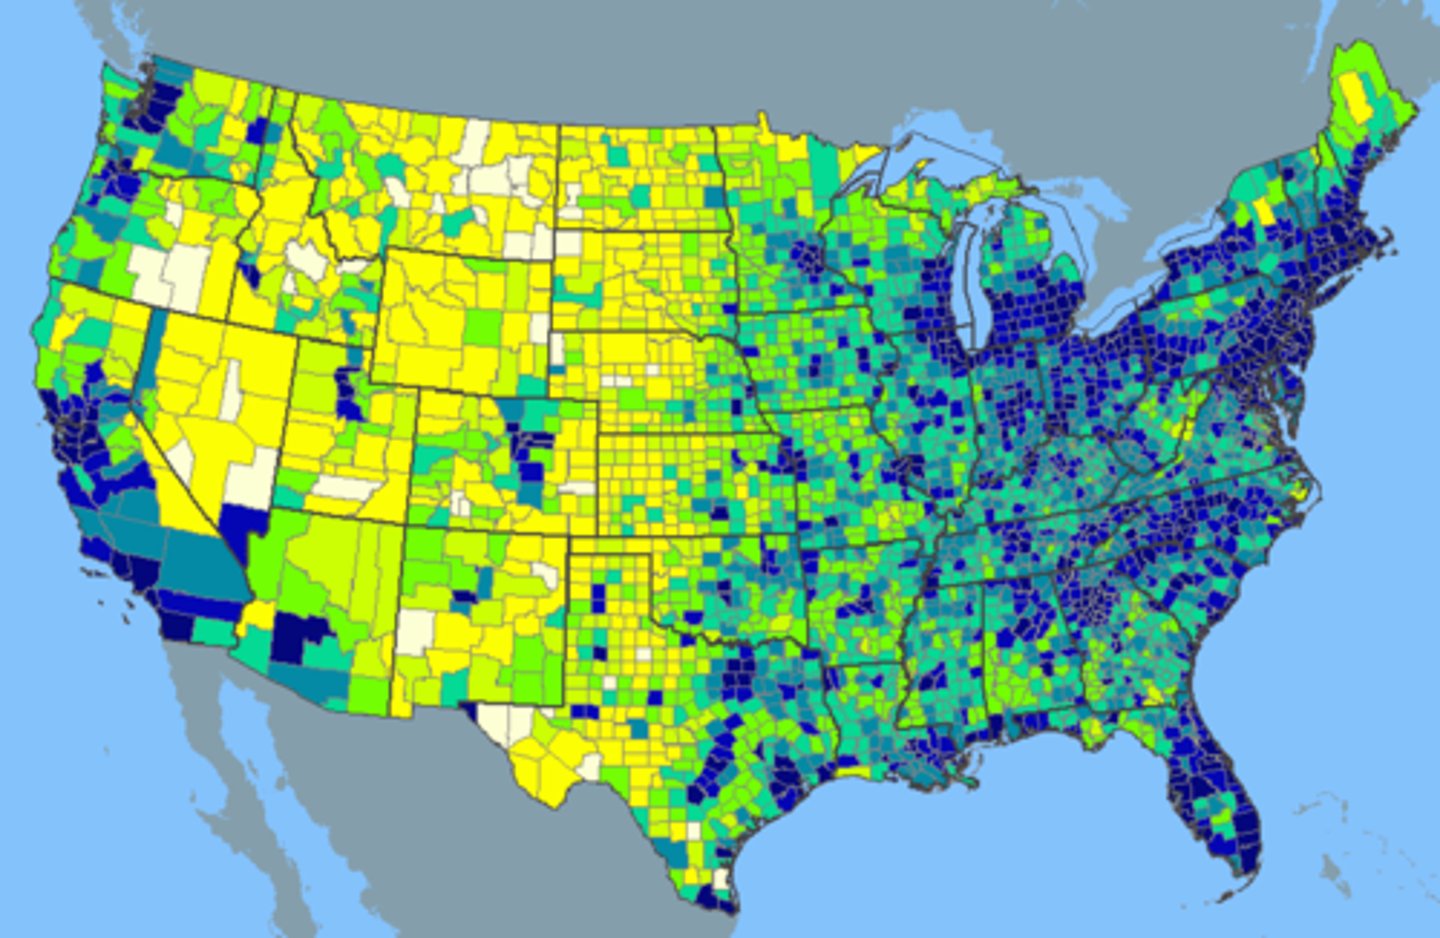
population distribution
how population is spread out in an area. It is patterns of settlement and dispersal of a population.
physical factors influencing population distribution
-climate
-vegetation
-soils
-relief
-provision of natural resources
- diseases and pests
human factors influencing population distribution
-economic activities
-communication networks
-government policy and stability
climate
Parts of the world where the climate is very harsh are generally less densely populated than areas with a favourable climate. Extremely high or low temperatures, along with a shortage of water are not conducive to human survival. For instance, Antarctica is so cold and inhospitable, that nobody lives there. The people who go there are usually scientists who want to conduct research there. The Atacama desert is another example of a place with a very harsh climate. Parts of this desert have not experienced any rainfall for over 400 years. No people, or even animals live in these parts.
soils
Areas with fertile soils tend to have a denser population than areas with infertile or poorly drained soil. Throughout much of history, the Nile delta in the north of Africa has been more densely populated than the surrounding area. The fertility of the soil in the area has allowed it to support a very large population.

vegetation
areas of grassland tend to have a higher concentration of population than dense forest. Sparsely populated areas include dense tropical rainforests, such as those found in the Amazon region and the coniferous forests of northern Canada and Eurasia. In some regions, large areas of forest have been cleared for settlement.

relief (human factors influencing population distribution)
At high altitudes, temperatures drop substantially, resulting in very cold conditions that tend to prevent dense settlement. Steep slopes are generally less densely populated than gently sloping or flat areas. It is much easier to build and to construct communications networks such as roads, on flat land. Where slopes are steep, landslides are a constant threat to buildings and other infrastructure- and even to life. Steep slopes also make farmland more difficult to access and harder to farm productively.
provision of natural resources
Areas where resources are (potable water and mineral resources such as crude oil, bauxite, diamonds, gold and silver) are abundant tend to have a higher concentration of population than areas where they are lacking. Areas which have large deposits of minerals such as bauxite tend to have high population densities. In Jamaica for instance there are relatively high population densities near some bauxite mining areas. Some relatively large settlements such as May Pen and Mandeville are located near bauxite mining areas.

diseases and pests
areas free from causes of human disease and from agricultural pests, or with the wealth and the scientific and medical expertise to eradicate such problems, have higher concentrations of population. (e.g. Ebola in Central Africa) On the other hand endemic diseases such as cholera and yellow fever also reduce human population. serious problems such as food shortages and famine are also caused by pests. (e.g. locusts in Sahel, West African desert)
Methods of depicting population distribution
dot map, lorenz curves.
Dot map
A map that uses dots to show the precise locations or the distribution of a population.
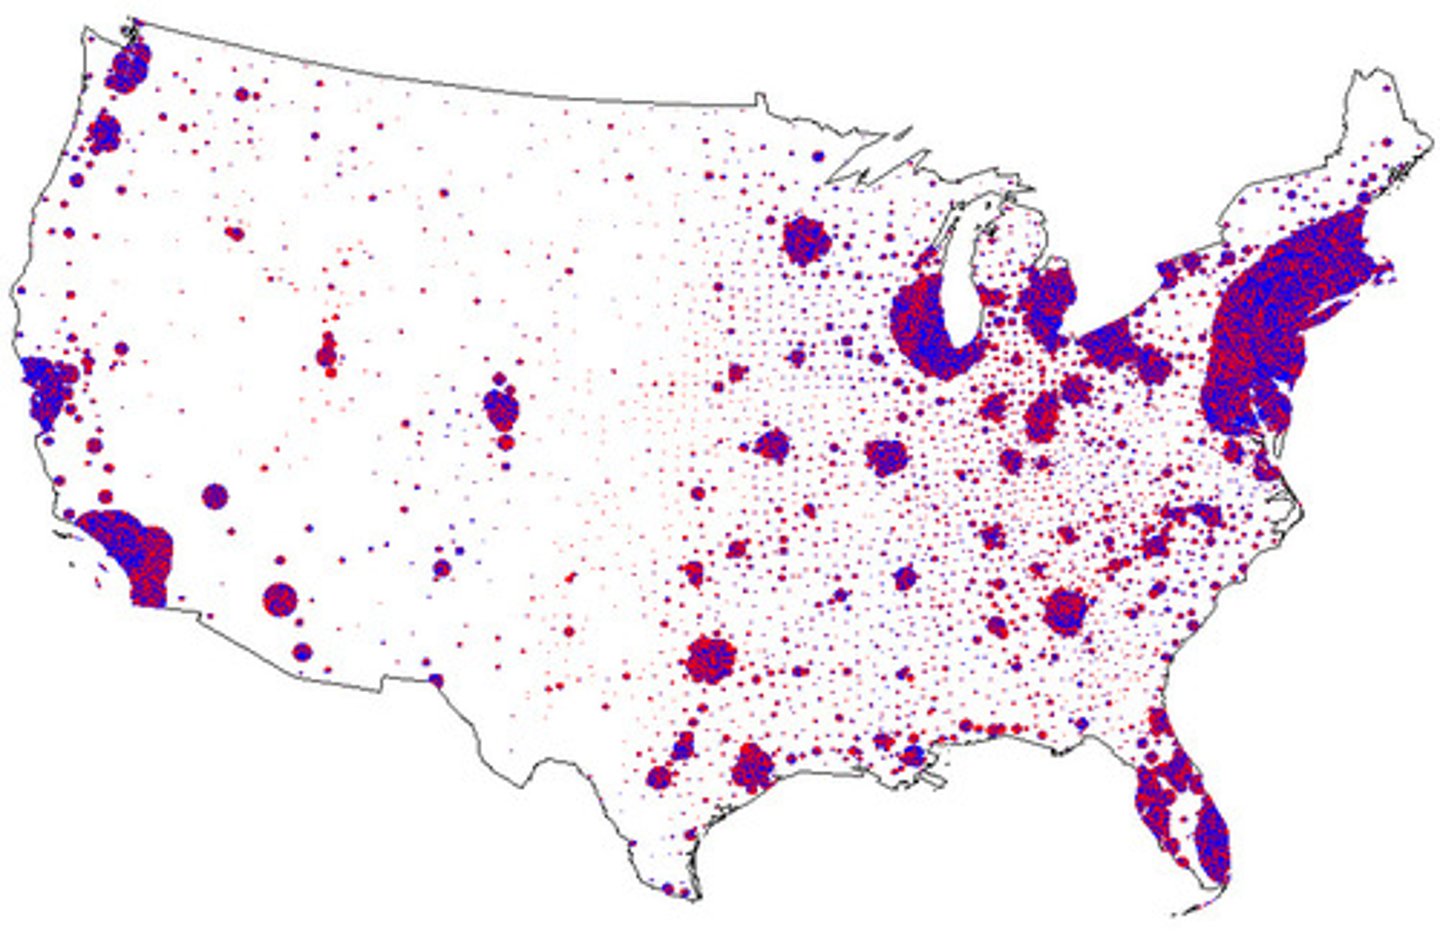
Advantages of Dot Maps
· Dot maps are relatively quick and simple to construct
· They are well suited to the illustration of data that relate to point locations
· They can illustrate the distribution of data and the general trends within a distribution
Disadvantages of Dot Maps
· A false impression of uniformity is created by the even spacing of dots
· When nothing is known of the distribution of items within an accounted area, other techniques may be both easier and provide better results.
· Major features of the distribution are blurred not only by the mapping technique itself but by the lack of detailed information that may be shown within an accounted area.
Lorenz curve
The Lorenz curve is a graph that represents inequality in the distribution of a particular set of values. (e.g. the distribution of population and income)
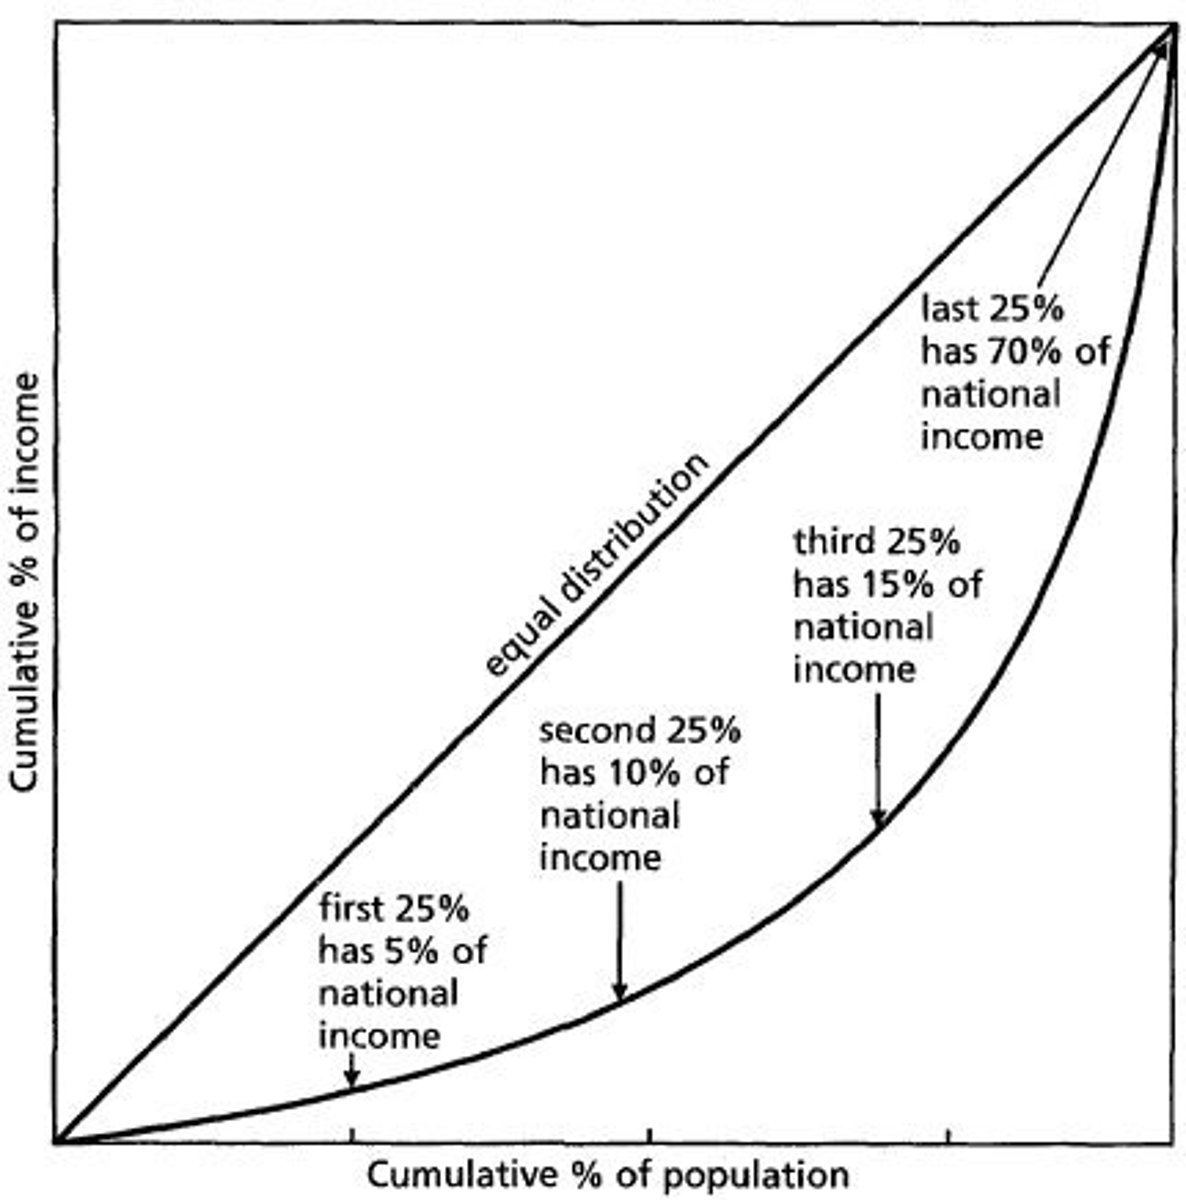
Advantages of lorenz curve
· Lorenz curves are relatively quick and simple to construct
· They provide a visual representation of the inequality of population distribution
· They can be used to compare the distribution of several countries at once by plotting more than one curve.
Disdvantages of lorenz curve
· Lorenz curves can be analysed only in terms of cumulative percentages.
· The graph cannot show exactly where or how the population is distributed within the country or region represented.
· The technique cannot show the population distribution in relation to resources
population change
A growth or decrease in population that results from the combined differences between births and deaths and between emigration and immigration. It is equal to (Births + Immigration) - (Deaths + Emigration).
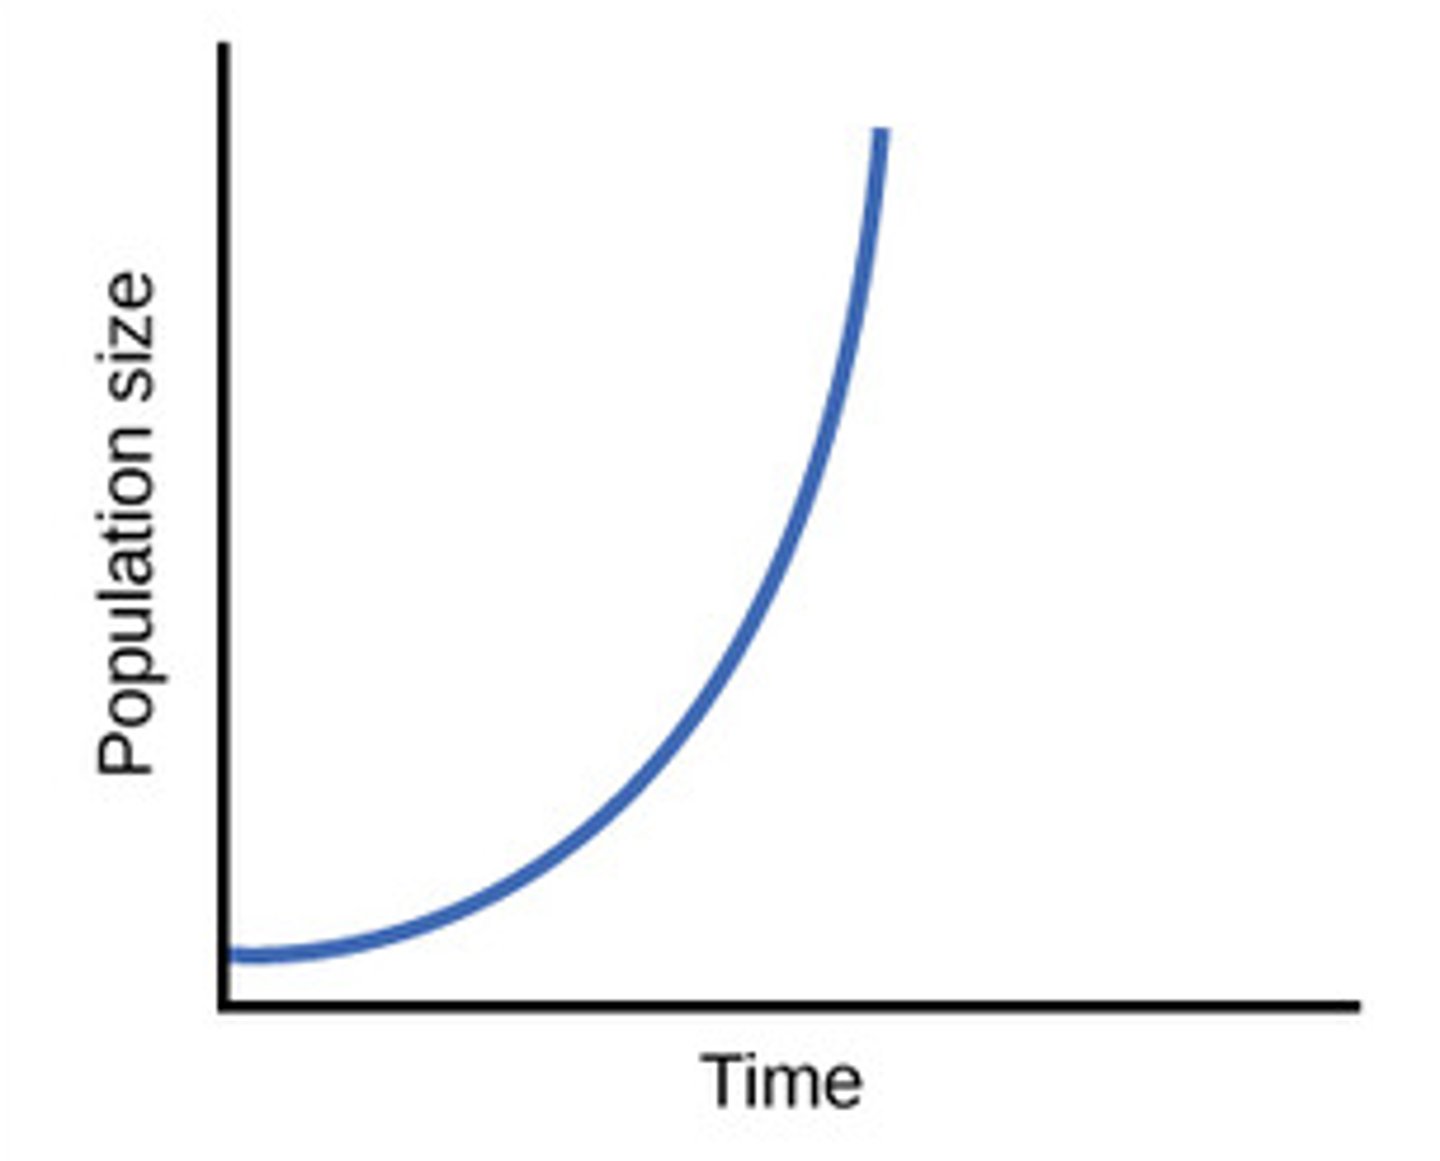
exponential growth
A pattern where the rate of growth constantly increases
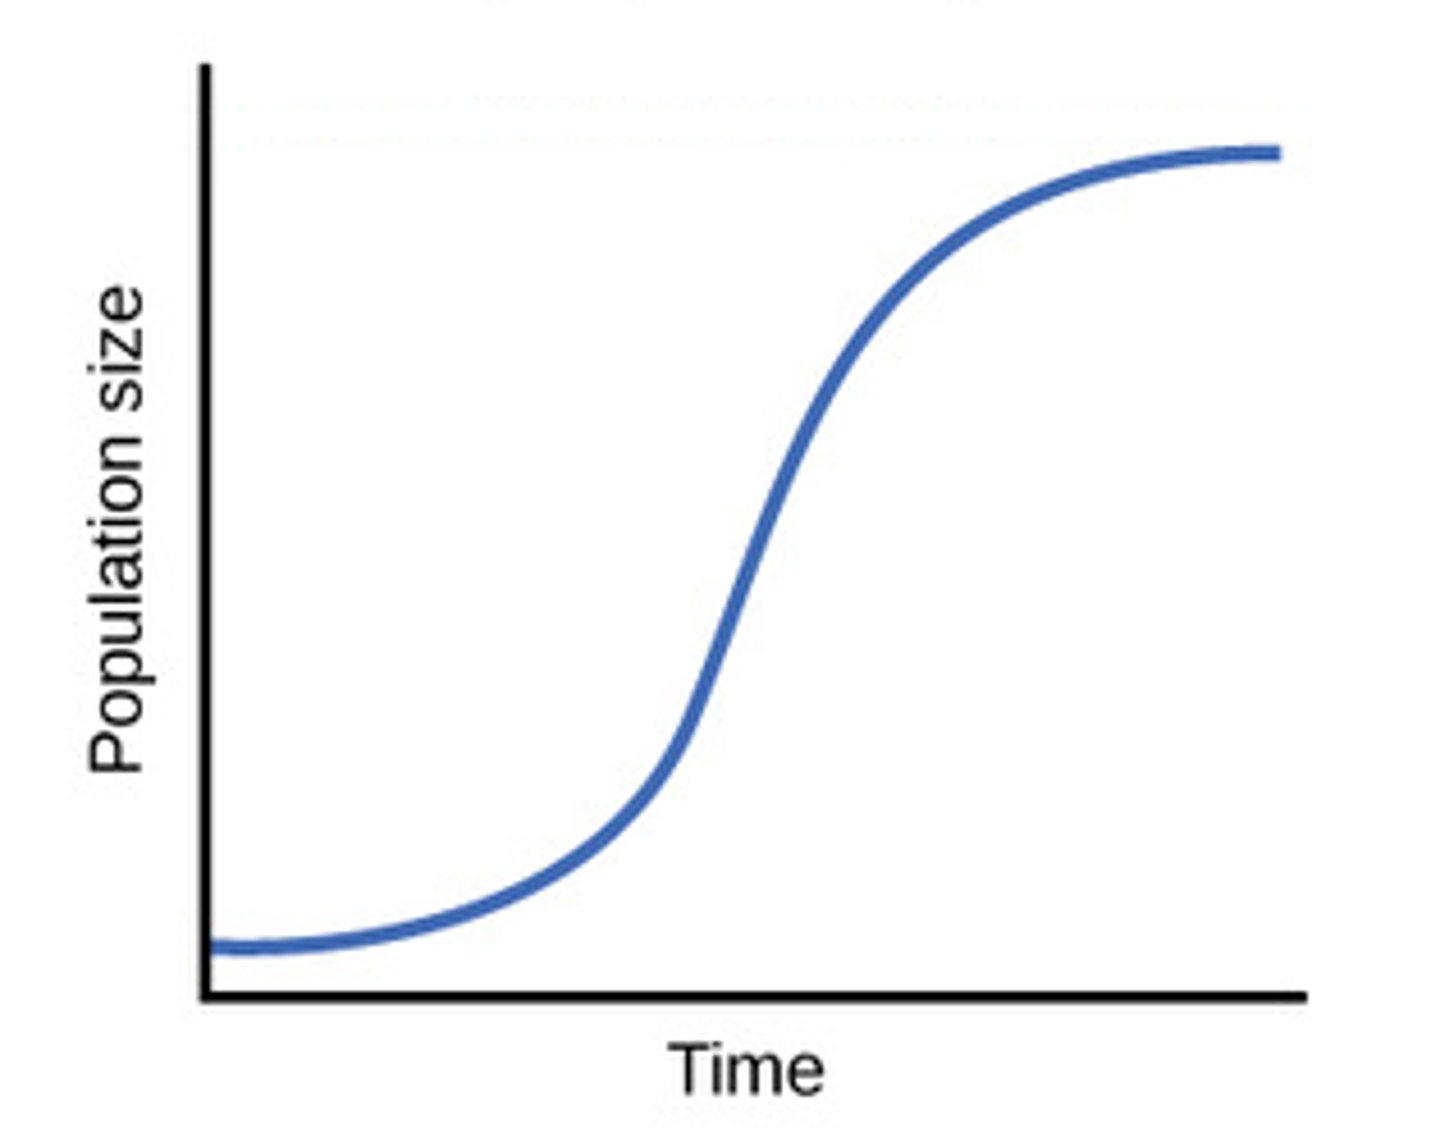
logistic growth
Growth pattern in which a population's growth rate slows or stops following a period of exponential growth
zero growth
Where birth rate is equal to death rate
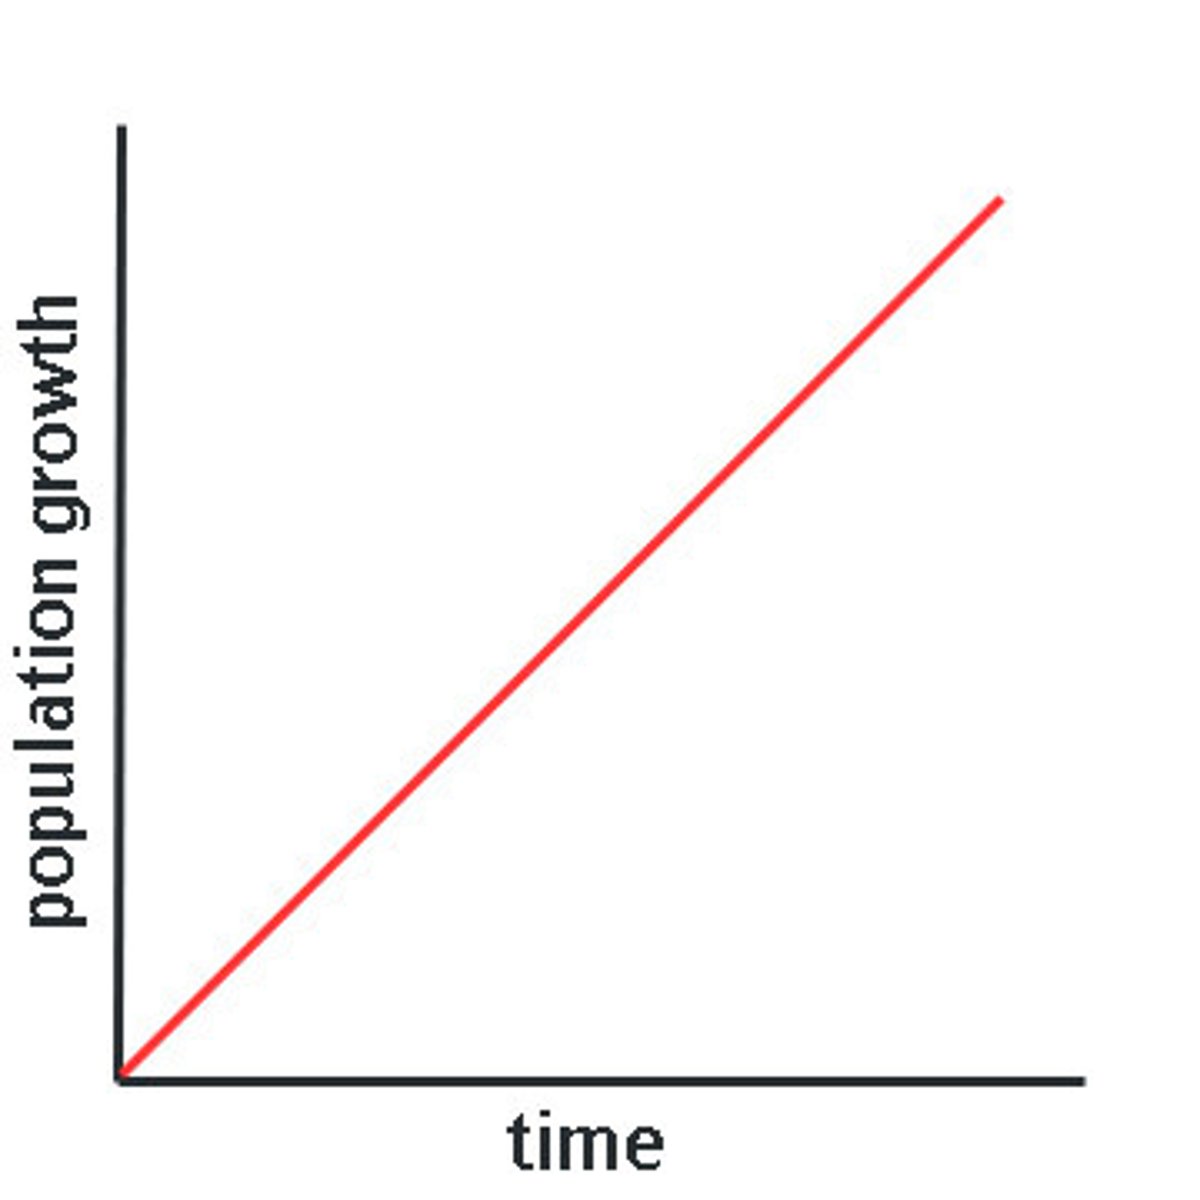
arithmetic growth
a pattern of growth that increases at a constant amount per unit time
cohort
A population group unified by a specific common characteristic, such as age, and subsequently treated as a statistical unit.
Contraception
prevention of pregnancy e.g. birth control, condoms

ecological footprint
the impact of a person or community on the environment, expressed as the amount of land required to sustain their use of natural resources.
vital rates
birth & death rate
sampling frame
list of individuals from which a sample is actually selected
stillbirth ratio
the ratio between the number of stillbirths and live births of the population.
birth rate (crude birth rate)
the number of live births per 1000 of population in a given year. It is only a very broad
indicator as it does not take into account the age and gender distribution of the population
death rate (crude death rate/ mortality rate)
the number of deaths per 1,000 members of the population in a given year.
prenatal mortality
fetal deaths arising from miscarriages, induced abortions and infant deaths during labour.
Natural increase (NI)
The surplus of births over deaths in a population in each time period. i.e. when the numbers of births are higher than the number of deaths.
Natural decrease (ND)
The deficit of births over deaths in a population in each time period. i.e. when the numbers of births are lower than the number of deaths.
Net migration loss (NML)
A country losing more people though emigration than they gain by immigration
Net migration gain (NMG)
A country receiving more people through immigration than losing through emigration
net reproductive rate (NRR)
the difference between the crude birth and death rates per year
potential support ratio (PSR)
A measure that represents the extent that people of working age can support the older population
Median age
the age at which half of the population is older and half is younger
Mid-year population
the population estimate for 1 July of a Given year
Life expectancy
The average number of years a person may expect to live at birth, assuming past trends continue.
sex ratio
The number of males per 100 females in the population.
Dependency ratio
the ratio of people in a dependent age group (those under age 16 or ages 65 and older) to those in the economically productive age group (ages 16to 64) of a population.
Factors that lead to dependency ratio increase
Increasing life expectancy
Falling Death Rates
Rising Birth Rates
Immigration of Dependants
Emigration of the economically active
calculating dependency ratio
Dependents ÷ Workers × 100
Economically active population
People who are at work (15 to 64) and pay taxes so the government can improve its services provision and support the dependent population
Elderly Dependants
People who are aged over 65 who need to rely on others for economic support i.e. pensions.
Young Dependants
People who are aged 0 to 14 and rely on other for economic support i.e schools.
Elderly dependency ratio
is the ratio of the number of people aged 65 and over to those 15-64 years of age.
Youth dependency ratio
is the ratio of the number of people aged 0-14 to those 15-64 years of age
Fertility rate
the average number of children that would be born alive to a woman of childbearing years during her lifetime.(if she had children at the current rate for her country)
Age-Specific Fertility Rate (ASFR)
the number of births during a year to women in a particular age group.
[Births to women age Y ÷ Women of age Y] ×1, 000
Replacement level fertility
is the level at which those in each generation have just enough children to replace themselves in the population.
growth rate
Rate of increase or decrease of a population in a year due to natural increase and migration (expressed as a percentage)
Youthful population
a population with a relatively high proportion of children, adolescents, and young adults and thus a high growth potential.
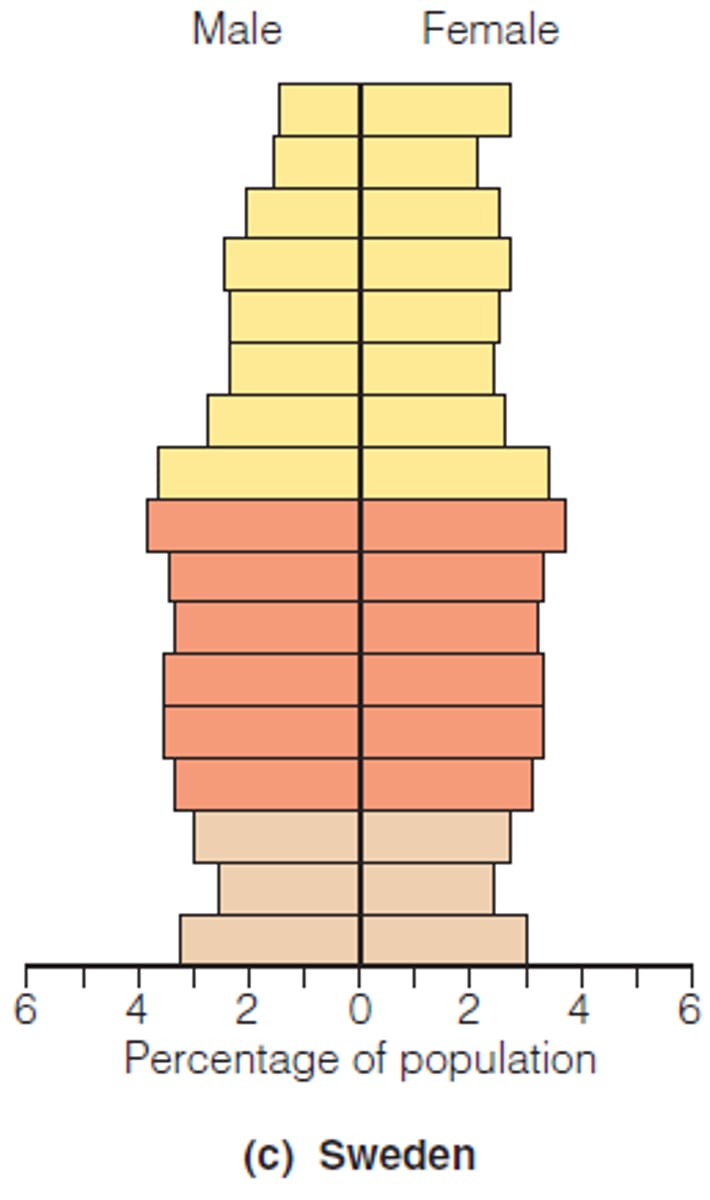
Ageing population
a population with a relatively high proportion of middle-age and elderly persons, a high median age, and thus a lower growth potential. (this occurs when fertility rates decline while life expectancy remains constant or improves at the older ages)
infant mortality
the number of deaths of infants under 1 year of age per 1000 live births in a given year.
reasons for the pattern of infant mortality
poverty, poor sanitation and poor health services.
infant mortality rate
The total number of deaths in a year among infants under one year old for every 1,000 live births in a society.
overpopulation
a population which exceeds its sustainable size within a particular environment or habitat.(results from an increased birth rate, decreased death rate and increased immigration)
Underpopulation
refers to a country's population that has declined too much to support its current economic system.
Optimum Population
refers to where the human population is able to balance maintaining a maximum population size with optimal standards of living for all people.
economic optimum population
the level of population that, through the production of goods and services, provides the highest average standard of living.
doubling time
the amount of time in which a given population will double, based on its annual growth rate.
Pro-Natalist Policies
Government policies which seek to increase the birth rate of a population
Examples of Pro-Natalist Policies
- paternity leave of at least 2 weeks
- maternity leave of at least 16 weeks for the first two children and 26 weeks for a third child
- community-funded daycare centers and nursery schools
- cash allowances to cover the costs associated with the new school year for children with disabilities in single-parent families.
Anti-Natalist Policies
government policies to reduce the rate of natural increase
Examples of Anti-Natalist Policies
*Family planning
*Sex Education
*Contraception
*Sterilization
*Abortion
*Infanticide (illegally practised in some countries)
*public campaigns
*female empowerment
Case studies of pro-natalist and anti-natalist policies
China
India
Singapore
demography
The scientific study of population characteristics.
demographic transition
change over time in a population in the relationship between births and deaths and overall population change.
Demographic Transition Model
A sequence of demographic changes in the crude birth and death rates over a particular time.
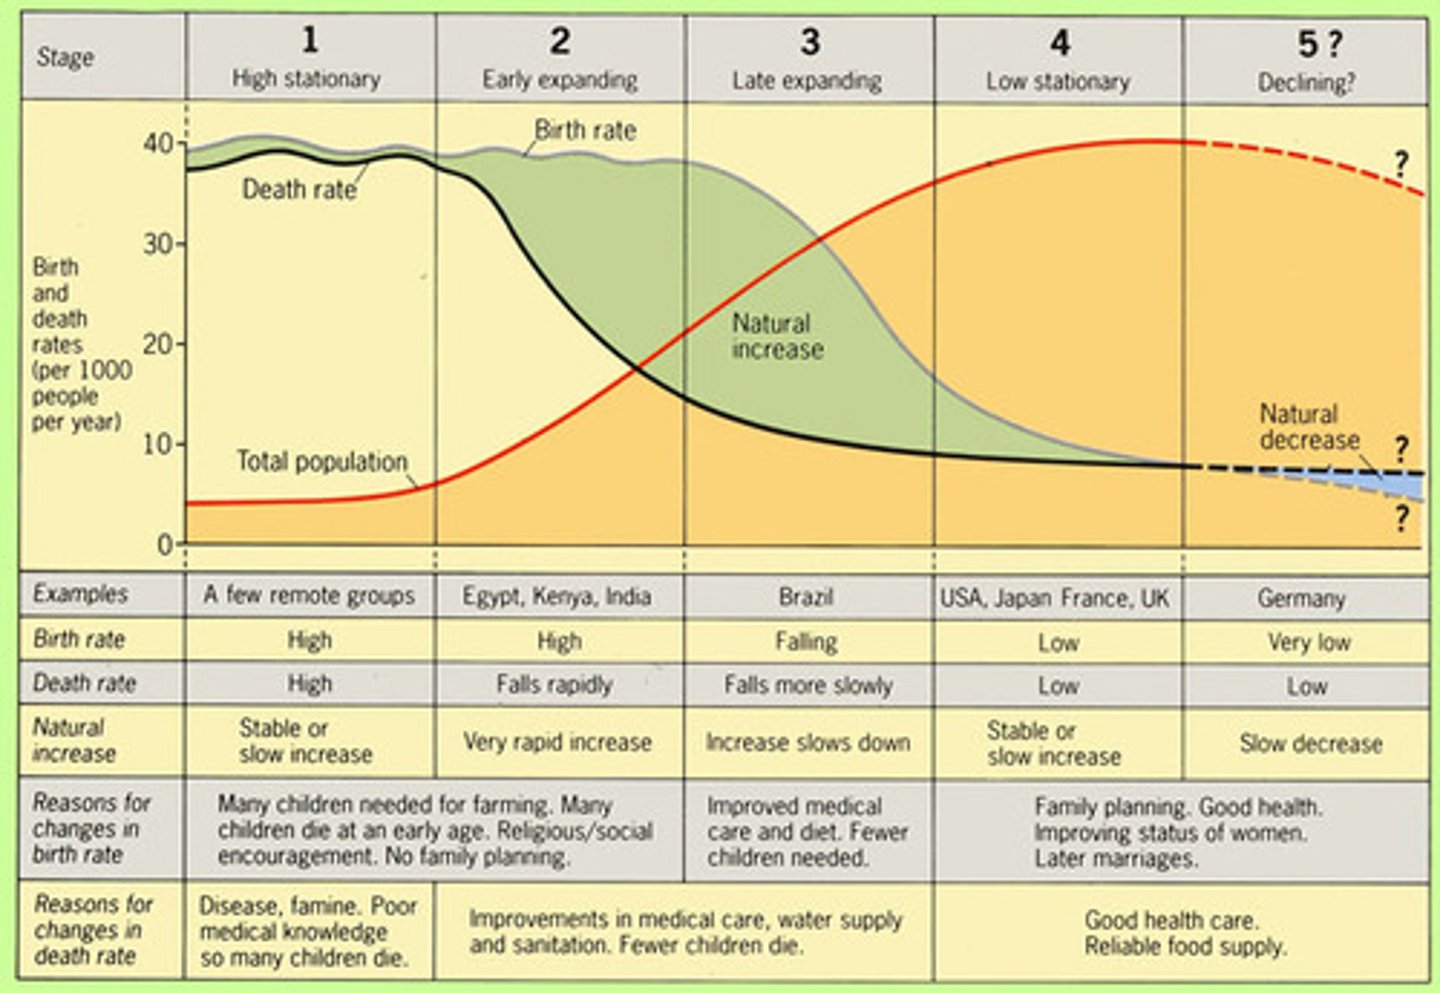
STAGE 1 (High fluctuation) e.g. Amazon Tribes
Both birth rates and death rates fluctuate at a high level giving a small population growth. Low NIR (natural increase rate)
STAGE 2 (Early expanding) e.g. Ethiopia
Birth rates are high but death rates decrease rapidly causing rapid population growth. Very High NIR
STAGE 3 (Late expanding) e.g. India, Brazil
Birth rates fall rapidly whilst death rates fall slightly causing a slowly increasing population. Moderate NIR
STAGE 4 (Low fluctuating) e.g. UK, USA
Both birth rates and death rates are low, fluctuating slightly, creating a steady population. Very Low NIR (0)
STAGE 5 (Decline) e.g. Germany, Japan
Birth rates fall below death rates, causing population to decline. Negative NIR
Benefits of DTM
• Universal in concept - can be applied to all countries in the world.
• Provides a starting point for the study of demographic change over time.
• The timescales are flexible.
• Easy to understand.
• Enables comparisons to be made demographically between countries.
Limitations of the DTM
• Original model does not include stage 5.
• Eurocentric and assumes all countries will follow the European sequence of socioeconomic changes.
• Doesn't include the role of governments.
• Doesn't include impact of migration
• Does not explain why the rates change
• Assumes that the fall in death rate(stage 2) is a result of industrialization
Speed variations of DTM
Countries in the less developed world still seem to be situated in stage 2. The UK took over 100 years to pass stage 2 because the social, economic and technological changes were introduced gradually. In the less developed world death rate has fallen more rapidly because these changes have taken place more quickly. Birth rate however has remained high and so the population has increased rapidly.Failure to move into stage 3 could result in the population exceeding available resources, one of the main reasons why China implemented the one child policy, forcing its population into stage 3
Demographic transition in the developing world
Compared with the experiences of most developed nations before them, in the developing world:
- birth rates in stages 1 and 2 were generally higher
-the death rate fell much more steeply and for different reasons
-some countries had much larger base populations and thus the impact of high growth in stage 2 and the early part of stage 3 has been far greater
-for those countries in stage 3 the fall in fertility has also been steeper
migration
the movement of people across a specified boundary, national or international, to establish a new permanent place of residence.
immigration
the permanent inward movement of people from one region or country to another.
emigration
the permanent movement of people out of their own country to another.
Net migration
the number of migrants entering a region or country minus the number of migrants who leave the same region or country.
International (external) Migration
movement from one country to another.
Internal Migration
movement within a particular country.
in-migration
number of people moving into a given region at a given time
out-migration
number of people moving out of a given region at a given time
migrant worker
person who moves from one region to another in search of work
internal displacement.
someone who has been forced to leave his/her home for reasons similar to a refugee but who remains in the same country
permanent migration
Migration with the intention of staying forever
Temporary Migration
migration for a limited period of time
Voluntary Migration
movement undertaken by free will.
Forced Migration
movement in which the movers have no choice but to relocate.
Chain migration
occurs when one or a small number of pioneering migrants have led the way in rural-urban migration, and others from the same rural community follow.
Channel migration
occurs when migrants follow distinct pathways that have been established over many decades or centuries. (slavery and colonialism)
Primitive migration:
human movements that occur when a population runs out of food
Impelled migration
when individuals leave a country because of unfavorable situations
migration stream
A constant flow of migrants from the same origin to the same destination
internally displaced person
someone who is forced to flee his or her home but who remains within his or her country's borders