AP Pyschology Unit 1: Research and Approachs
1/69
There's no tags or description
Looks like no tags are added yet.
Name | Mastery | Learn | Test | Matching | Spaced | Call with Kai |
|---|
No analytics yet
Send a link to your students to track their progress
70 Terms
William Wundt
Considered the father of pyschology.
Edward Titchener
A student of William Wundt and introduced structuralism.
Structuralism
The study of basic structures that make up the mind.
Functionalism
The study of how the brain adapts and functions.
Pyschoanalytic
The theory that behaviors, are from unconscious drives and conflicts. Things from our childhood unconsciously effects us without knowing .
Sigmund Freud
The father/founder of pyschoanalytic perspective.
Cognitive
How our thoughts impact our behavior. (What you think you will feel)
Albert Ellis and Aaron Beck
The founders of the cognitive perspective.
Humanistic
We are in control and choose the majority of our behaviors.
Abram Maslow and Carl Rogers
The founders of the humanistic perspective.
Behavioral
We learn our behaviors through rewards, punishment, and observation. Our personaility is learned.
Ivan Pavlov, John Watson, and Albert Bandura
The founders of the behavioral perspective.
Biological
How the body/brain impacts our behavior and emotions.
Evolutionary
How some of traits that our ancestors had effect us today. Our behavior is impacted by our ancestors traits.
Sociocultural
How your environment impacts who you are, beliefs of society effects who your are today.
Theory
A belief or an idea about something. Has not yet been proven.
Hypotheses
Testable prediction induced by a theory, to enable us to except or reject a statement.
Operational Definition
An exact description, that needs to be descripitve and measurable. This allows replication of a study.
Hindsight bias
When you think you knew something all along after the outcome has occurred.
Case Study
A in depth study of a person or small group of people.
Naturalistic Observation
A research method of observing research subjects in real life settings and recording behavioral patterns. Involves no interaction between the observer and the people.
Survey
Asserting self reported attitudes of people. Usually through a response to questions.
Random Sample
When the group of subjects in your experiment accurately depicts the population. This should fairly depict the overall population, covering various ethnicities, socioeconomic classes, gender, and age.( CHOOSING PARTCIPATES IN THE STUDY/EXPERIMENT)
Wording Effects
Happens in a survey when words influence a certain response. This can change fidings ina survey.
Correlation vs Causation
Example a study says that you will eat more ice cream if you experience a drowning. Just because there is a correlation between the two does not equal that if you drown you will eat more ice cream.
Correlation
Naturalistic observations and surveys that show that two things are related to each other. (Example: Hight influences a persons weight.)
Correltaion Coefficient
r score
r score
Score between -1- 0 - 1
Closer a number is to either -1 or 1 it proves correlation.
Equally in Strength
R scores -1 and 1 are?
Illusory Correlations
When we perceive random events as being correlated. (Example Sugar makes people hyperactive)
Scattor plot
Shows relationship between to quantitative variables.
Experiment
A controlled environment where are able to test your hypotheses, and find correlation between variables.
Experimental Group
The group that is exposed to the independent variable.(Group that is given the drug)
Control Group
The group that is used for comparison purposes, to be sure your results are due to your independent variable.(not exposed to the drug)
Random Assignment
Every participant having an equal chance of being in either the experimental group or the control group.(DICTATES WHICH GROUP)
Experiments Only
Random assignment is used in…
Double Blind Procedure
The researcher doesn’t know who is in the experimental or control group.(PREVENTS BIAS)
Independent Variable
The variable that is manipulated by the experimenter, usually the if part of a statement.
(Example:drug)
Dependent Variable
The outcome of a case study or experiment. Effected by the independent variable.
(Example: Depression symptoms)
Confunding Variables
A variable of the experiment the reasrcher has not accounted for. ( Example: Amount of sleep)
Placebo
The fake drug.
Descripitive Statistics
Summarizes results with numbers or quantitative data about the group studied.
Inferntial Statistics
Apply’s results to a general population. Generalize the results.(Example: Statistical Significance)
Descriptive Statistics Examples
-Histograms
-Meausres of Central tendency
-Normal curves
-Measures of variability
-Correlations
Histograms
Bar graphs or history destirpution that depect frequency distributions.
Histogram Problems
Notice the label on the vertical access makeing the data look very different.
Measures of Central Tendency
Mean, Mode, Median
Mean
Average of all numbers. Add up all the numbers and the divide by the number of numbers
Mode
Most frequently occuring number.
Median
Middle number. Line numbers up from lowest to highest to find the absloute middle number.
Affects the Mean
Extremely low or high scores.
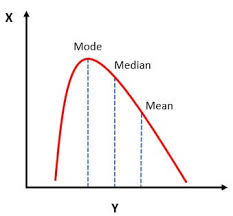
Postive Skewed distribution
Mean is higher then the Median. Few high scores pulling the mean up.
Tail is to the right.
Negative Skewed distribution
Mean is lower than the median . Few low scores pulling the mean down.
Tail is to the left.
Normal Curve
When the Mean, Median, and Mode are the same. No Skewed Data
Range
The gap between the highest and lowest score. Highest score minus the lowest score.
Higher Range
Data is more spread out.
Lower Range
Data is more closer together.
Standard Deviation
Gives you information of how far the each individual score is spread from the mean.
How to do Standard Deviation
1-Find the Mean
2- How far a score is away from the mean, and then minus/add that score by how far away it it.
3-Then add up the numbers=sum of deviations
4-Then square root the→ Sum of deviations/The number of scores
Z Score
What is the number of standard deviations away from the mean.
(Example: Z score +1= One standard deviation above the mean, Z score -2= 2 standard deviations below the mean.
Statistical Significance
Found from highley replicated experiments. Results are not likely due to chance. That less than 5 percent chance of the results are accidental.
P score > 0.05
Likely due to chance or accidental . Not Statistically Significant.
P score less than 0.05
Not due to chance. Statistically Significant.
Debrief
Psychologists provide a prompt opportunity for participants to obtain appropriate information about the nature, results, and conclusions of the research, and they take reasonable steps to correct any misconceptions that participants may have of which the psychologists are aware.
Informed Consent
When psychologist conduct an experiment or assement. They obtain the informed consent of the individual or individuals using language that is understandable to that person or persons.
Avoiding Harm
Psychologists do not participate in, facilitate, assist, or otherwise engage in torture, defined as any act by which severe pain or suffering, whether physical or mental, is intentionally inflicted on a person, or in any other cruel, inhuman, or degrading behavior.
Institutional Approval
Psychologist must have approval before conducting research. They also have to provide accurate information of such research.
Deception
Psychologist can’t lie to participants unless it is for value.
Human Care and use of Animals in Research
Psychologists trained in research methods and experienced in the care of laboratory animals supervise all procedures involving animals and are responsible for ensuring appropriate consideration of their comfort, health, and humane treatment.
William James
Introduced functionalism.