Understanding Supply and Demand in Markets
1/21
There's no tags or description
Looks like no tags are added yet.
Name | Mastery | Learn | Test | Matching | Spaced | Call with Kai |
|---|
No analytics yet
Send a link to your students to track their progress
22 Terms
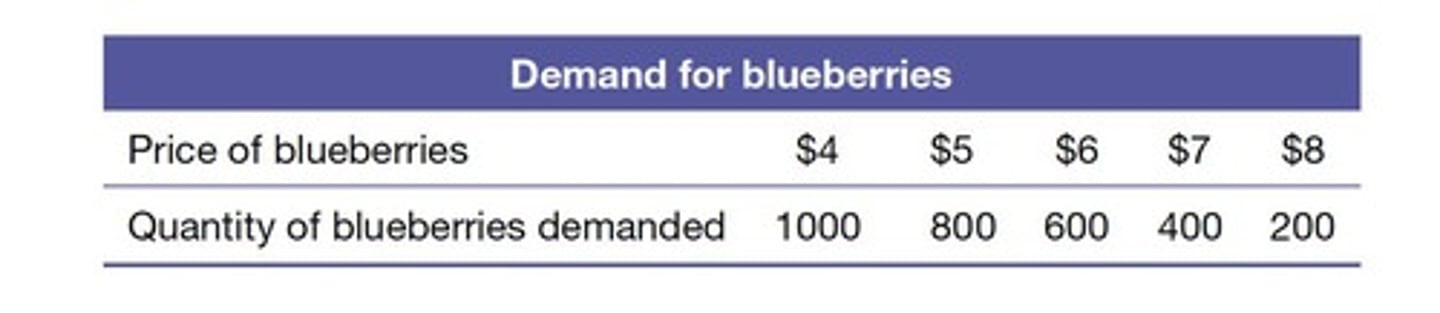
Demand
Quantity consumers are willing to purchase at a price.
Law of Demand
As price increases, demand decreases; vice versa.
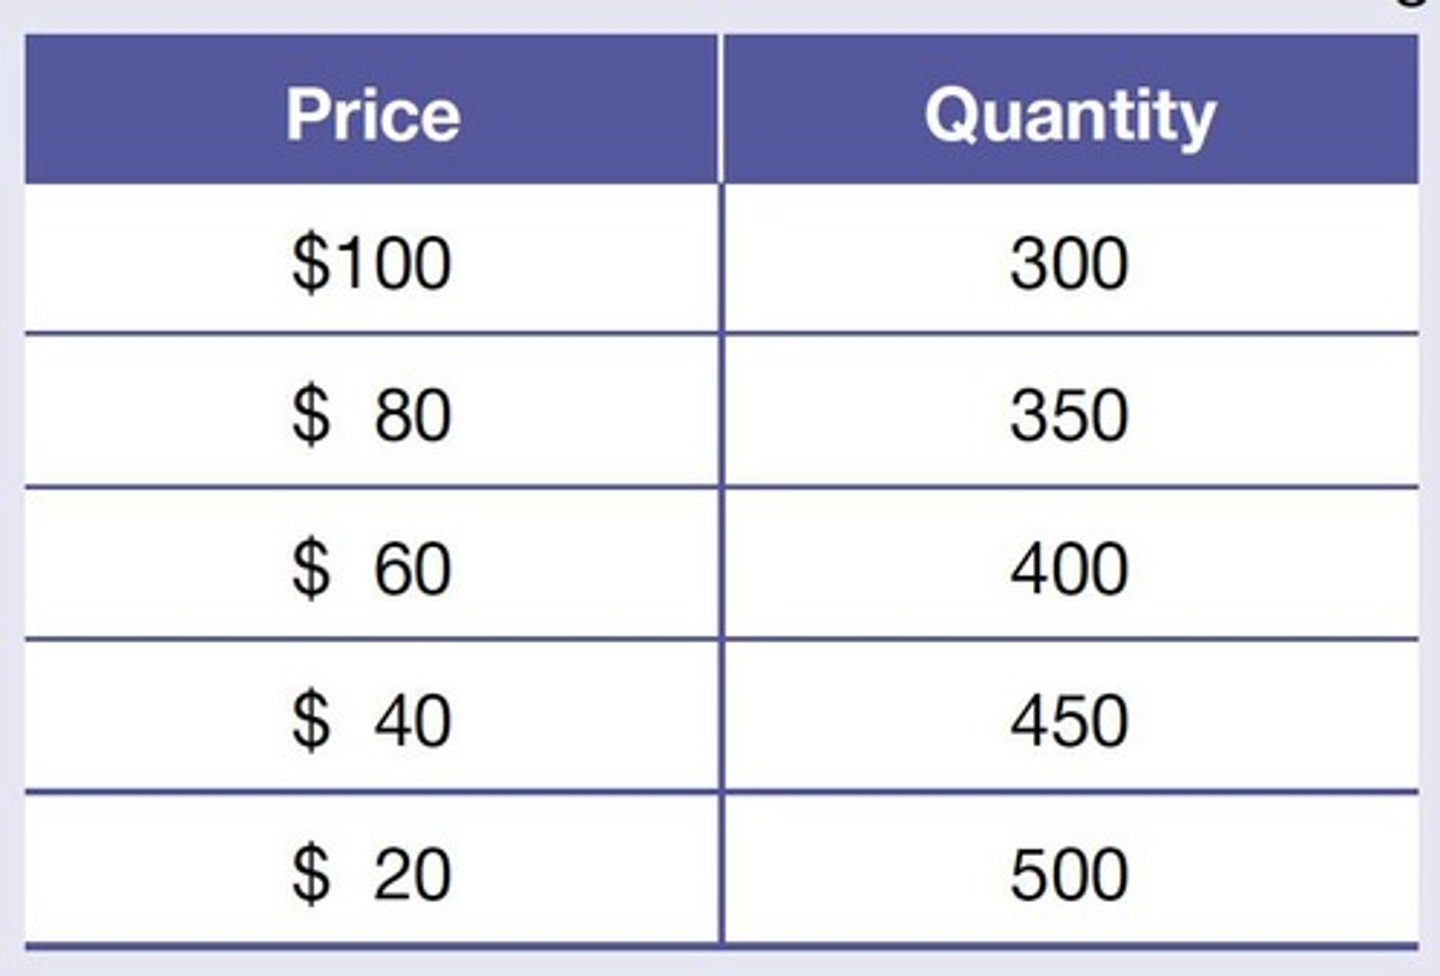
Supply
Quantity businesses are willing to sell at a price.
Law of Supply
As price increases, supply increases; vice versa.
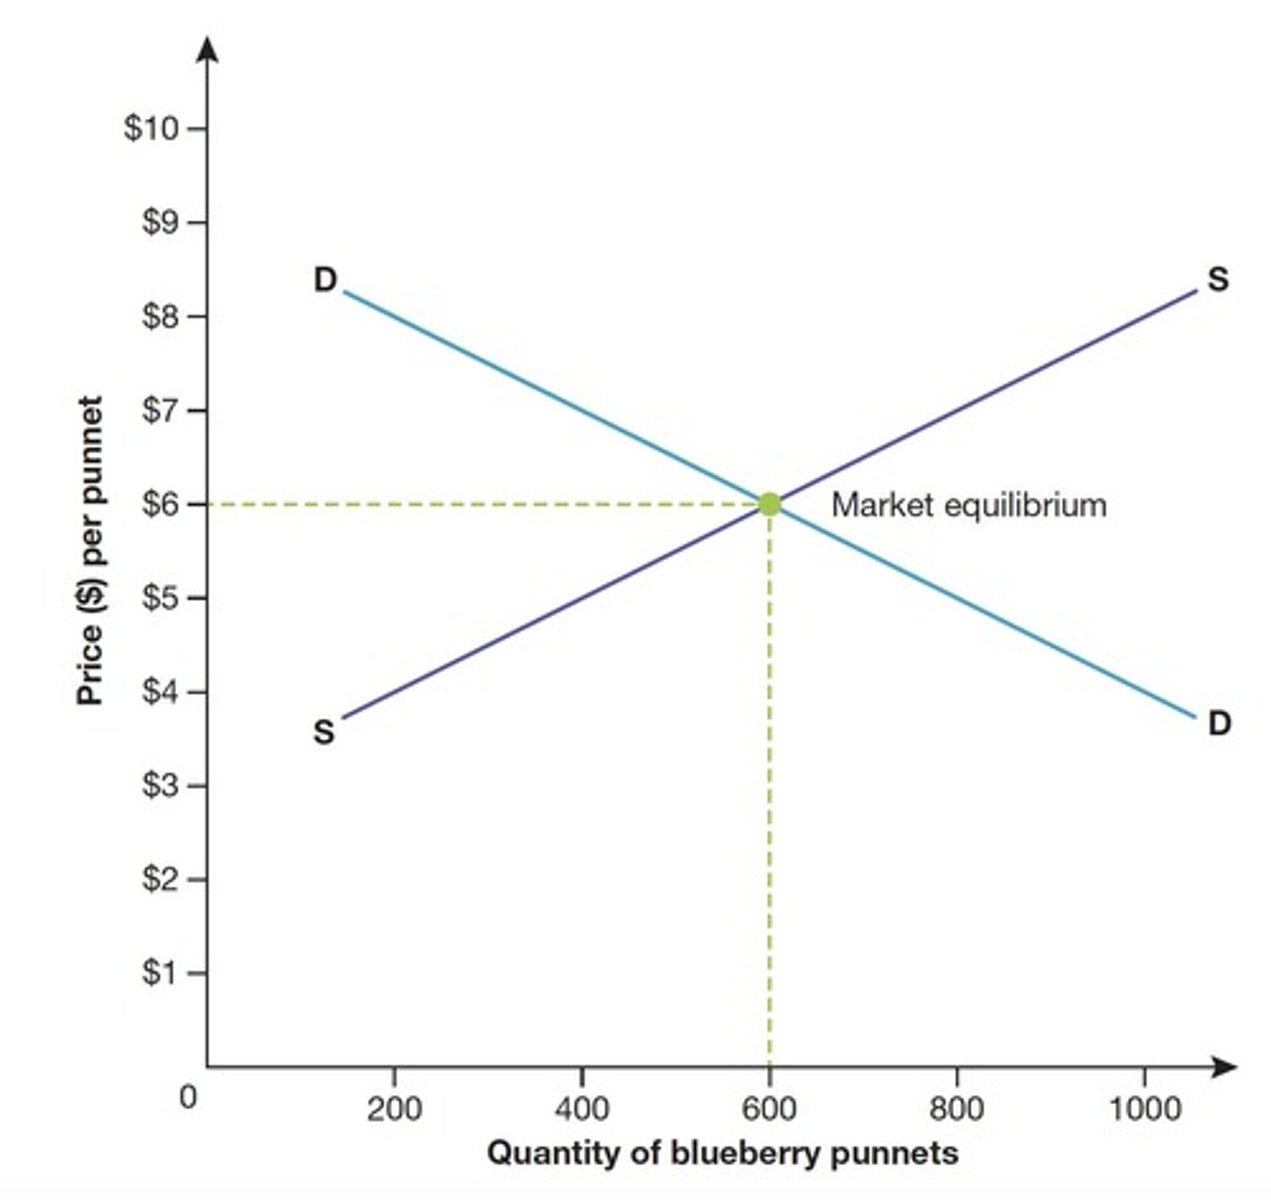
Market Equilibrium
Point where demand and supply curves intersect.
Price Mechanism
Process by which prices adjust based on supply and demand.
Demand Curve
Graph showing relationship between price and quantity demanded.
Supply Curve
Graph showing relationship between price and quantity supplied.
Equilibrium Price
Price at which quantity demanded equals quantity supplied.
Equilibrium Quantity
Quantity at which demand equals supply at equilibrium price.
Graph Construction
Creating visual representation of supply and demand data.
Blueberries Example
Illustrates demand and supply changes with price variations.
Consumer Demand
Desire for goods/services at various price levels.
Seller Supply
Willingness of sellers to offer goods/services at prices.
Price Level
Specific cost at which goods are sold.
Quantity Supplied
Amount of goods sellers are ready to sell.
Quantity Demanded
Amount of goods consumers are ready to buy.
Graph Intersection
Point where supply and demand curves meet.
Market Forces
Economic factors affecting supply and demand.
Price Adjustment
Changes in price based on market conditions.
Demand Shift
Change in demand due to external factors.
Supply Shift
Change in supply due to external factors.