theory part of component 4
1/23
There's no tags or description
Looks like no tags are added yet.
Name | Mastery | Learn | Test | Matching | Spaced |
|---|
No study sessions yet.
24 Terms
Technical analysis
MP already reflects realistic value, share prices, and indices volumes. look at price movement, basic philosophy
Technical analysis basic assumptions
Market demand is determined by the interaction of supply and demand, which is influenced by many factors. Prices tend to form certain trends and these will continue for a reasonable time. A trend will change due to changes in supply and demand
share price indexes
Dow Jones and co, Wall Street Journal, Dow theory, Dow Jones Industrial Average (DJIA is the share price index)
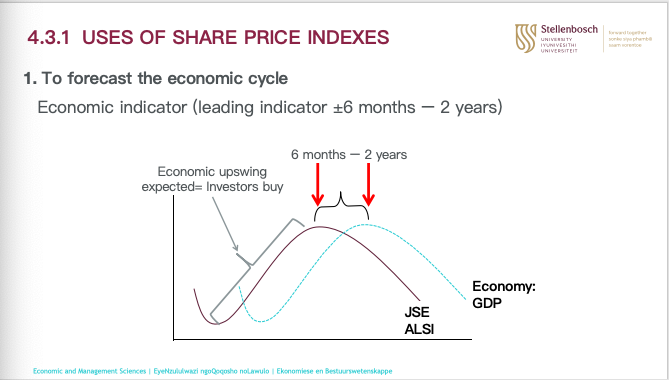
uses of share price indexes: to forecast economic cycle
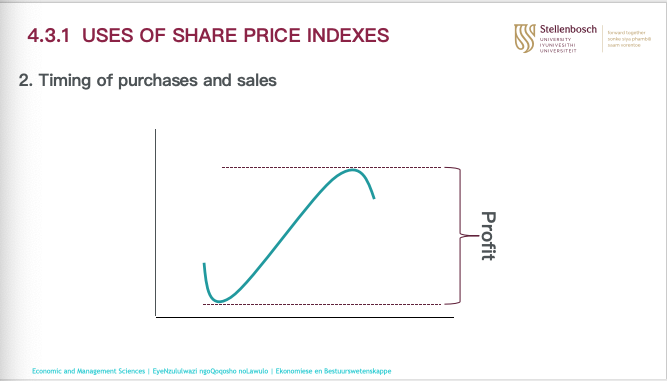
uses of share price indexes: timing of purchase and sales
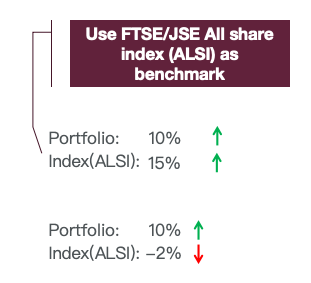
evaluating performance of a portfolio
use of share price indexes: quantifying of risk(Beta anaylsis)
Beta analysis quantifys the sensitivity of a share’s price relative to a sector or general market, higher beta analysis=higher risk
uses of share price indexes: determine speculative activities
By viewing market indexes along with volume and rand value of shares traded, one can determine if activities and movements is purely speculative
THE FTSE/JSE AFRICA INDEX
Financial mail(FM) index- price weighting
Rand daily Mail(RDM)- equal weighting
JSE actuarial index series- market capitalisation
Charts and Technical indicators
focus on past trading activities and price movements to forecast the future. use charts and technical analysis indicators to identfytrends in market and assist with trading activities and timing
DOW-theory
Primary trend
secondary trend
short-term fluctuations
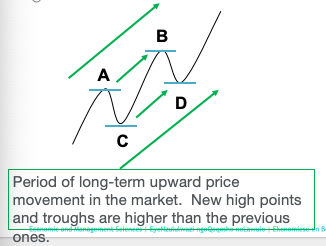
PRIMARY TREND: Long-term trends: bull market
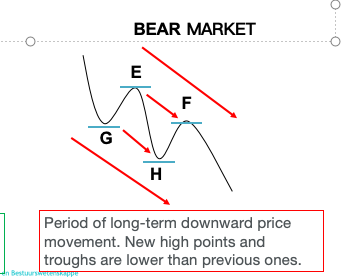
PRIMARY TREND: Long-term trends: Bear market
secondary trend
long-term trend interrupted by periods where price moves in the opposite direction. In a bull market, it is during a reasonable period of price declining, 3 weeks-months and must drop at least a third of the movement
short term fluctuations
study daily fluctuations
Bar Charts
price of share indicated on vertical axis and horizontal axis is time
point and figure chart
assists in analysing price trends, one-dimensional graph, vertical axis price or index value and horizontal axis no value or time dimension. price increase: X, decrease: O
trend lines: Lines that indicate LT price trends
support lines: at the bottom of most formations, if price falls through support line its time to sell and will stabilise at lower level
trend lines: resistance lines
at top of most formations, if price goes above this its time to purchase and will stabilize at higher price
buy and sell signals: 200 day average can be utilised Purchase signals
200 day average flattens or starts rising after decline and daily share price breaks average line in upward movement. if share price is above 200 day line and drops towards average line but does not cross and the starts rising again
buy and sell signals: 200 day average can be utilised sell signals
if 200 day line flattens or declines after a rise and daily share price breaks the average line in downward movement or if share price is below 200 day average and it starts rise towards average line but does not cross and drops again
market breadth
measures direction of overall market: some indices reflect only the price movement of a small number of selected companies, even in market cap indices bigger companies effect the index more that small ones
plot values of cumulative change column together with values of FTSE/JSE ALSI
moving in same direction: strong market
opposite direction: market is weak
Relative strength index(RSI)
momentum indicator, between 0-100, identify buy/sell. RSI value<30=oversold, RSI value>70=overbought. RSI=100-[100/(1+RS)]