MIDTERM REVIEW | Units 1-4
1/204
Earn XP
Description and Tags
Chapters 1-6
Name | Mastery | Learn | Test | Matching | Spaced | Call with Kai |
|---|
No study sessions yet.
205 Terms
probability model/distribution
describes the possible outcomes of a chance process AND the likelihood of those outcomes will occur
can use a table or tree diagram
sum of all probabilities must equal 1
every probability is between 0 and 1, inclusive
random variable
takes numerical values that describe the outcomes of a chance process
values of the sample space
expected value/mean of a discrete random variable
an average of the possible outcomes, but a weighted average in which each outcome is weighted by its frequency
does not have to be a possible outcome; decimals are fine
calculating expected value of discrete variable
μx = E(X) = (x1)(p1) + (x2)(p2) + (x3)(p3) + …
make sure to show at least three terms
first two terms and the last term
median of a discrete random variable
smallest value for which the cumulative probability equals or exceeds 0.5
variance of expected value or a discrete random variable
Var(X) = σx2 = (x1 - μx)2p1 + (x2 - μx)2p2 + (x3 - μx)2p3 + …
make sure to show at least three terms
first two terms and the last term
standard deviation of expected value or discrete random variable
the measure of variability for the center of a discrete random variable
σx = [(x1 - μx)2p1 + (x2 - μx)2p2 + (x3 - μx)2p3 + …]1/2
square root of the variance
adding or subtracting a constant
does not change the shape
does not change the measure of variability
adds/subtracts the constant to the measure of center and location of each point
mean is different, but standard deviation is the same
multiplying or dividing a constant
does not change the shape
multiples/divides measure of center and location of each point by the constant
multiples/divides the measure of spread by the constant
both mean and standard deviation change
mean + standard deviation = multiplied by the constant
variance = multiplied by the constant squared
interpretation of expected value and standard deviation
On average, the (variable) varies from the mean of "x,” by about “y” (units).
independent random variables
when knowing the value of X does not help predict the value of Y
rule for sum of independent variables
mean —> μsum = μx+y = μx + μy
standard deviation —> σsum = σx+y = (σx2 + σy2)1/2
aka square root of the sum of the variances
rule for difference of independent variables
mean —> μdiff = μx-y = μx - μy
standard deviation —> σdiff = σx-y = (σx2 + σy2)1/2
aka square root of the sum of the variances
still ADDING
only for independent variables
continuous random variable
can take any value in an interval on the number line
probability for continuous random variable
the area under the density curve and directly above the values on the horizontal axis that make up the event
probability of a single outcome of continous variable; P(x = a)
is always 0
probability of continous variables are always a range of values
combining two independent normal variables
any sum or difference of independent normal variables is also normally distributed
additive transformations
“y” amount of trial
mean —> μx1+x2+…+xy = y × μx
standard deviation —> σx1+x2+…+xy = [y × σx2]1/2
multiplicative transformations
“y” amount of trial
mean —> μyx = y × μx
standard deviation —> σyx = [y2 × σx2]1/2 = y × σyx
combination
counting when order is not considered
permutation
counting when different orders is considered
multiplication rule
if one event can occur in “m” ways, a second event in “n” ways, and a third event in “r” ways, then the three events can occur in “m × n "× r”
think of a tree diagram
repetition of an Event
if one event with “n” outcomes occurs “r” times with repetition allowed, then the number of ordered arrangements is “nr”
calculating permutations
nPr = n!/(n - r)!
n = number of objects
r = number of positions
calculating combinations
nCr = nPR/r! = n!/[r! × (n - r)!]
n = number of objects
r = number of positions
number of permutations/arrangement of “r” objects
binomial setting
when we perform “n” independent trials of the same chance process and count the number of times that a particular outcome occurs
how to tell if binomal
BINS
B = Binary, can be classified as “success” or “failure”
I = Independent, knowing the outcome of one trial must not tell anything about the outcome of the next
N = Number, the number of trials “n” has already been fixed in advance
S = Same probability, same chance of success of “p” for each trial
binomial random variable
the count of successes X in a binomial setting
x = 0, 1, 2, …, n
calculating binomial probabilities
P(x = k) = nCk × pk × qn-k
n = number of trials
k = number of successes
p = probability of success
q = 1 - p = probability of failure
nCk = n!/[k! × (n - k)!]
Formula for verifying binomial distribution
“y” is a binomial distribution with n = a and p(success) = b
do not actually need to write out BINS, but must clarify the “N” and “S” part
convincing evidence
occurrence of an unlikely or likely event against the assumptions
very small probability = against smth
very large probability = for something
shapes of binomial distribution
can be symmetric or skewed
when p = 0.5, the binomial distribution MUST be symmetric
when p ≠ 0.5. the binomial distribution MUST be skewed
p < 0.5 = right skewed
p > 0.5 = left skewed
as the number of trials gets larger —> closer to a Normal distribution
mean of a binomial random variable
μx = n × p
n = number of trials
p = probability of success
standard deviation of binomial random variable
σx = (npq)1/2
n = number of trials
p = probability of success
q = probability of failure
formula for describing binomial distribution
The distribution of (variable name) is a binomial distribution (skewed towards__/symmetrically), with a peak around “a”. On average, the (variable name) differs from the mean of “μx” (unit) by about σx (unit), when looking at “n” (unit).
must include the amount of trials!!
10% condition
n < 0.10N
when taking random sample of size “n” from a population size of “N”, we can use a binomial distribution to model the count of success in the sample is as long as the sample is less than 10% of the population
approximately independent/binomial distribution
geometric setting
performing independent trials of same chance process and record the number of trials it takes to get one succcess
every trial must have same probability of success
geometric random variable
number of trials “Y” that it takes to get a success in a geometric setting
how to tell if geometric distribution
BITS
B = Binary, can be classified as “success” or “failure”
I = Independent, knowing the outcome of one trial must not tell anything about the outcome of the next
T = Trials, continue with more trials until a success
S = Same probability, same chance of success of “p” for each trial
calculating geometric probabilities
P(Y) = p × qk-1
p = probability of success
q = probability of failture
k = number of trials attempted
mean of a geometric random variable
μx = 1/p
p = probability of success
standard deviation of a geometric random variable
σx = (1 - p)1/2/p
p = probability of success
describing a geometric distribution
ALWAYS skewed to the right, as there is no max value
center = use the mean
variability = use standard deviation
formula for interpreting mean and standard deviation of geometric random variables
On average, if many trials (use the real context) are conducted, the (variable name) differs from the mean of “μx” (units) by about “σx” (units).
Large Counts condition
the probability distribution of a binomial random variable is approximately Normal if
np ≥ 10
nq ≥ 10
total amount of failures and successes is at least 10
verifies that there is enough data for an approximately normal distribution to occur
bias
when the calculated value from the sample is CONSISTENTLY an over- or underestimate of the true value of the population
low bias = high accuracy
high bias = low accuracy
accuracy
when the calculated value from the sample (the mean, etc) is close to the true value of the population
high accuracy = low bias
low accuracy = high bias
variability
when the calculated values from the sample are CONSISTENTLY scattered/can be at extremes and far away from each other
or, low variability = when calculated values are CONSISTENTLY CLOSE to each other
*does not imply that they have to be close or far from the true value of the population; that’s bias
low variability = high precision
high variability = low precision
precision
when the calculated values from the sample are CONSISTENTLY close to each other
high precision = low variability
low precision = high variability
census
a survey of the ENTIRE population; usually not feasible, and samples are preferred
simple random sample (SRS)
sampling method where choosing every individual AND group of individuals is equally likely to occur
LOW BIAS
can lead to mid-high VARIABILITY
METHOD: conducting a simple random sample (SRS)
label the individuals by assigning them numbers from 1-X
or, write names on slips of paper
using an RNG, randomize the labels by choosing [sample size] UNIQUE numbers
or, shuffle slips in a hat and select [sample size] - without repeating any names
select the individuals (and conduct the study/administer a survey/etc) that correspond to those numbers
or, select the individuals whose names were chosen
population
entire group/pool of potential people who could be selected for a study
CAN generalize to the population when: random sample FROM that exact population is chosen
convenience sample
sampling method where the experimenter chooses the experimental units that are closest by, the first ones, easiest to reach, etc.
HIGH BIAS (first ones often have a trait that the rest of the population might not)
voluntary response sample/bias
sampling method where the experimental units/subjects choose to be a part of the sample
HIGH BIAS: people who choose often have polarized opinions
μ (population mean)
population mean; true value that the sample mean (σ) should be close to
stratified random sample
sampling method where the population is split into homogeneous groups (strata), and SRS’s of the appropriate/representative number are taken from each stratum to make up the whole sample
LOW BIAS
LOW VARIABILITY: due to homogeneous groups, groups that tend to be similar in the measured value aren’t going to be disproportionately overrepresented, leading to a lower variability in the calculated sample value
METHOD: conducting a stratified random sample
split the population into [#] strata according to [trait]
starting with the [X] stratum, assign all [# participants] numbers from 1-X
use an RNG to randomly select [stratum sample size] unique numbers between [#-# in the stratum]
with [stratum sample size] being the proper number of experimental units from that stratum, such that the stratum’s representation in the sample is weighted as desired
select (and conduct the study upon) the individuals whose labels correspond to the selected numbers
repeat this process for the other strata
added from SRS: splitting population & starting from x stratum; repeating process for other strata
REASONING: conducting a stratified random sample
to reduce variability from an SRS; the strata should be homogeneous in terms of their values that the study is measuring, so limiting how many experimental units come from that stratum will make it imposible to overrepresent values like theirs → less extremity in both directions
cluster sample
sampling method where the population is split into heterogeneous groups (clusters), and then the proper number of those clusters is chosen to create the whole sample
LOW BIAS
same VARIABILITY as SRS
EASIER/LESS COSTLY TO CARRY OUT
METHOD: conducting a cluster sample
split the population of [# experimental units] into [#] clusters according to the [cluster reason/group]
label each cluster with a number from 1-[# of clusters]
using an RNG, choose [# of clusters to select according to sample size; pick ENOUGH clusters to SATISFY sample size] unique numbers from 1-[# of clusters]
select the clusters that correspond to the chosen numbers, then select all of the [experimental units] within those chosen clusters
i.e. conduct a census of the cluster
added from SRS: split population into clusters, label CLUSTERS and CHOOSE # of clusters, then select all individuals within those clusters
systematic random sample
sampling method where a starting individual is randomly identified in the population, and then the individual x individuals away from that individual (x being the interval size) is selected; repeats until the desired sample size is achieved (and should go through the whole population at least once)
METHOD: conducting a systematic random sample
label all [experimental units] with a number between 1-X
using an RNG, generate a number between 1-[# of the interval’. the [individual] corresponding to this number represents the starting [individual].
select the starting [individual]. then, select every [#interval]th player that is past this player on the list, UNTIL [#sample size] players are selected.
interval selection: if you need sample size of n and population is N, interval should be N/n ish so you go through about the whole population
REASONING: conducting a cluster sample
easy, fast, and cost-effective to collect data from a cluster, because they’re all centralized in the same location(s)
REASONING: conducting a systematic random sample
easy and simpler to carry out and conduct (in some ways)
if the list is in order of something, it has an effect that reduces variability (assuming the order is homogeneous somehow)
otherwise, it is just another method of getting a sample
“pathway” to a study
population
sample frame
undercoverage bias starts here
target sample
nonresponse bias starts here (between this & respondents)
respondents
response bias starts here
question wording bias starts here
sample frame
the list (in reality) of experimental units available from which a sample is chosen; aimed to be as equal to the population as possible
target sample
selecting a sample from the sample frame using an unbiased method, potentially reducing variability by choosing stratification, etc.
undercoverage bias
when the sample frame is NOT representative of the population; usually, it excludes or favors certain groups in the population
nonresponse bias
when a proportion of the target sample does NOT respond and does NOT become part of respondents
cause: people can’t be reached or refuse to answer
effect: less responses, may exclude a certain group (that’s more likely to not answer) from the final respondents group
response bias
when the data gathered from respondents (whether the data itself, the process of getting the data, etc) has bias or issues of some kind and affects the accuracy of the responses
examples: experimenter’s attire when collecting the data pressures people to give a certain answer so they don’t disappoint the experimenter; people lie to represent themselves in a better light to the experimenter
question wording bias (response bias)
specific type of response bias, where the respondents give inaccurate responses because the question is worded in a manner that pressures them to give a certain response
observational study
study where NO treatments are imposed on experimental units; the subjects are NOT made to do anything
prospective (observational) study
“looking forward” — a type of observational study, where experimental units are identified in advance (potentially collecting data at the beginning), and then later experimenters follow up with the experimental units (no imposition of treatments)
retrospective (observational) study
“looking backward” — a type of observational study, where experimental units are identified and their pasts are inquired about (no imposition of treatments)
experiment
a type of study where treatments are imposed on experimental units
experimental units
participants in the study (can be objects, animals, people, etc); what or who treatments are imposed on
subjects if the experimental units are human beings
treatments
what is done/not done to experiment units/what is imposed or not imposed; usually the explanatory variable’s options; can include levels OR combinations of the explanatory variables
explanatory variable (factor)
impacts the response variable; the options/treatments possible — must specify:
“whether or not” if it’s a YES/NO
the “level” of the treatment if it’s a varying intensity
response variable
the measured variable that is analyzed after the explanatory variable is manipulated
confounding variables
other potential factors that affect or create the results that we observe (especially common in observational studies); related to/influences the explanatory variable (one goes up, other goes down; both go up; both go down), and ALSO influences the response variable (one goes up, other goes down; both go up; both go down)
MUST SPECIFY relationship/direction between:
confounding variable & explanatory variable
confounding variable & response variable
creates illusion that explanatory variable affects the response variable in the way that the confounding variable does
correlation, but NOT causation
well-designed experiments include…
replication
random assignment
comparison
control
replication
repeating the study multiple times, either through multiple trials on the same people OR multiple trials with different groups of people
increases validity
random assignment
when experimental units are randomly assigned their treatments; reduces bias and potential confounding variables that would result from subjects choosing their own treatments
benefit: allows us to claim/prove causation between the treatments/explanatory variables & the response variables
allows GROUPS to be ROUGHLY EQUIVALENT
comparison
having another group, whether a control or an experimental group, to compare results to
control group: group without treatment that acts as comparison
experimental group: group receiving a different treatment that acts as comparison
required to have an experimental group with another treatment draw conclusions between these 2 different treatments
control
keeping other variables (that may affect results) constant, to reduce potential confounding variables
CONDUCTING: random assignment
label all individuals within the sample 1-X
using an RNG, select [amount for one treatment] unique #s between 1-X
the individuals who were selected receive the [X] treatment
if more than 2 treatments: remove the numbers selected and then reselect [amount for one treatment] more unique #s between 1-X that weren’t chosen before; the individuals corresponding to these numbers will receive the [X] treatment…
repeat for all treatments (except the last one:)
last treatment: the remaining individuals will receive the [X, last] treatment
placebo effect
when people receive a treatment without an active ingredient/any true effect, they still show “improvement”/get better due to a psychological bias and idea that they should feel better from the treatment
blinding
when the experimenters or the subjects (or both; see double-blinding) are not aware of whether subjects received a real treatment or a placebo
reduces bias:
for subjects: will not have biased results depending on if they know they got a real treatment or not; can determine if there is the placebo effect
for experimenters: will not act biased when interacting with subjects depending on their treatment or placebo assignment (e.g. won’t tailor themselves in certain ways, won’t subconsciously hint at/reveal the truth of the treatment)
double-blinding
when NEITHER the experimenters NOR the subjects are aware of whether subjects were given a real treatment or a placebo; reduces bias on both ends (see blinding)
completely randomized design
an experimental design that consists of a single experiment, with experimental subjects in a randomized and heterogeneous sample
block
group of experimental units that are similar with respect to their response (to the measured, response variable)
randomized block design
an experimental design that separates the sample into homogeneous (with respect to their response to the response variable) blocks, then randomly assigns all treatments within each block (as if conducting microcosm-experiments in each block)
reduces variability** IF blocks are correctly split into homogeneous groups, since their responses are similar to each other
controls for BLOCKS as confounding variables
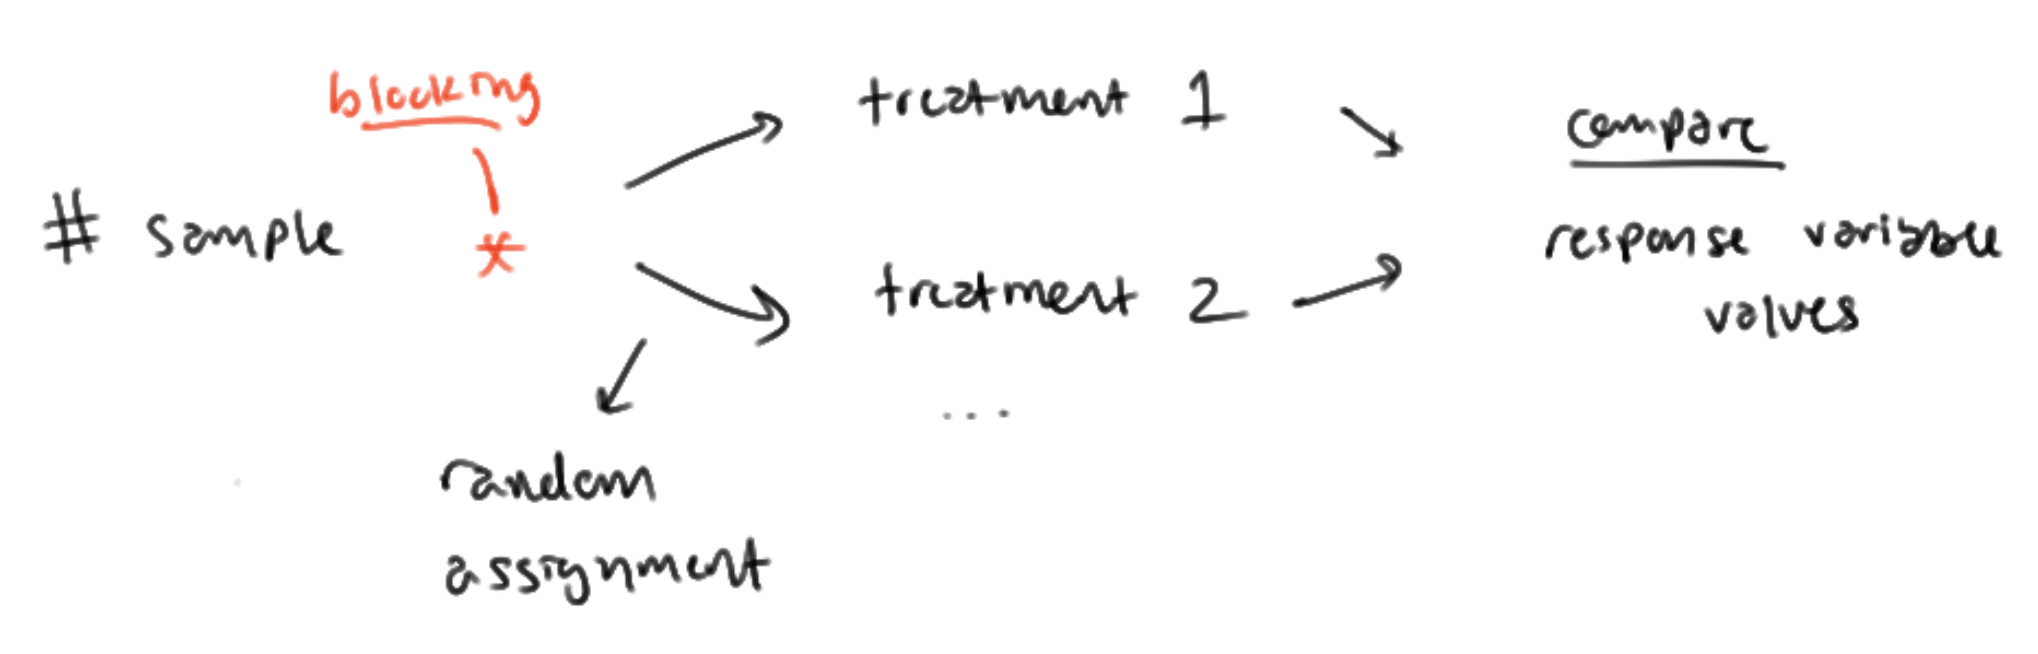
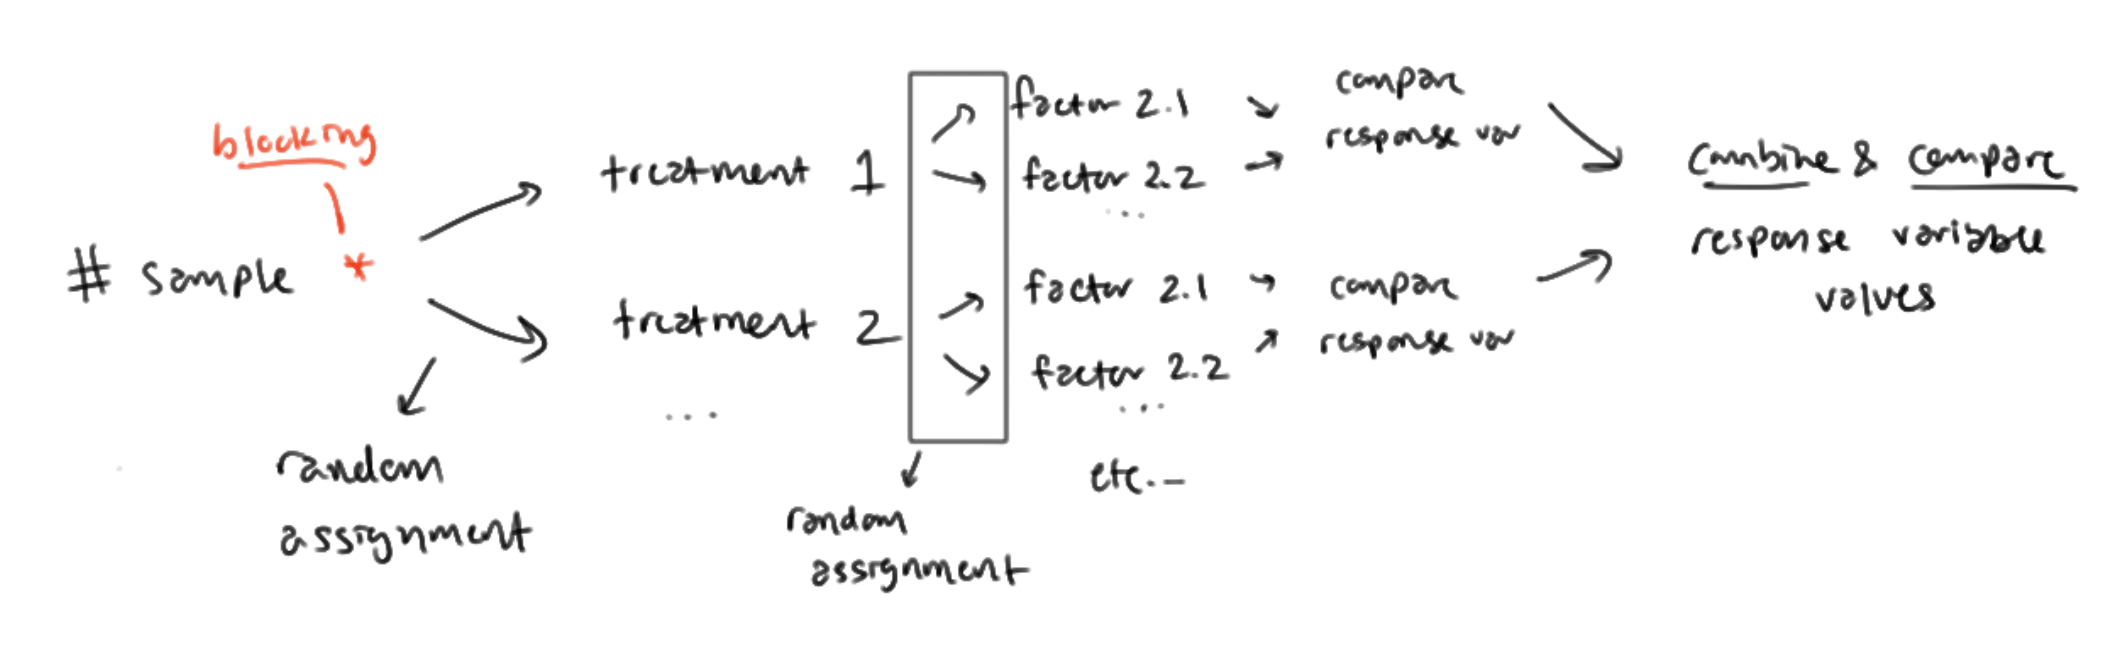
METHOD: conducting a randomized block design (writing)
separate the [experimental units] into blocks of [X] (specify all blocks). within each block, number the [experimental units] from 1-X
for the first block, use an RNG to select [X] unique numbers, and give the individuals who correspond to those numbers the [X] treatment. (specify the other treatments…) repeat this step for every block
compare their [response variable/effect] in each of the blocks
finally, bring all the blocks together to combine and compare overall
METHOD: randomized block design with ONE factor (diagram)
METHOD: randomized block design with MULTIPLE factors (diagram)
REASONING: randomized block design
Randomized block design helps to:
control for ____ (what the blocks are sorted for) as a confounding factor.
Within each block, there will be:
lower variability of results
making it easier to determine ____ (what the experiment is trying to determine)
REASONING: confounding variables are problems
If [an effect is observed], we wouldn’t know if it was because of [explanatory variable] or because of [confounding variable], as [confounding variable] may be a confounding variable and we would not correctly determine causality.
matched pairs design
a type of randomized block design where the “blocks” are pairs, of either 2 very similar subjects OR 1 person but 2 trials/2 parts of the subject
2 subjects: the two subjects are randomly assigned to 1 of 2 treatments, and results are compared
1 subject: each subject receives 2 treatments, still randomized: e.g. the order in which they receive them is randomized; where they receive them (e.g. on two comparable parts of their body, like right/left leg) is randomized; results are compared
METHOD: conducting a matched pairs design
if 2 subjects: pair 2 very similar/comparable subjects, then the next two, and so on, forming [#] pairs. label the first person in the pair “1,” and the second “2”
randomize: using an RNG, select 1 or 2. for the first pair, the subject corresponding to the # selected will receive [X] treatment; the other subject will receive [Y] treatment
if one subject: for each subject, run the RNG for 1 or 2, and then assign [X] treatment first/on the right/etc if 1, second/on the left if 2 (or something similar)
repeat the above for all pairs/subjects
compare the difference between the two treatments for every pair of subjects/subject