6a. Indirect taxes
0.0(0)Studied by 8 people
Card Sorting
1/4
Earn XP
Description and Tags
Last updated 1:44 AM on 4/9/23
Name | Mastery | Learn | Test | Matching | Spaced | Call with Kai |
|---|
No analytics yet
Send a link to your students to track their progress
5 Terms
1
New cards
Indirect tax
A tax on goods and services.
2
New cards
Specific tax
A fixed amount of tax paid on each unit sold
3
New cards
Ad valorem tax
A tax charged as a % of the price of a good e.g. VAT
4
New cards
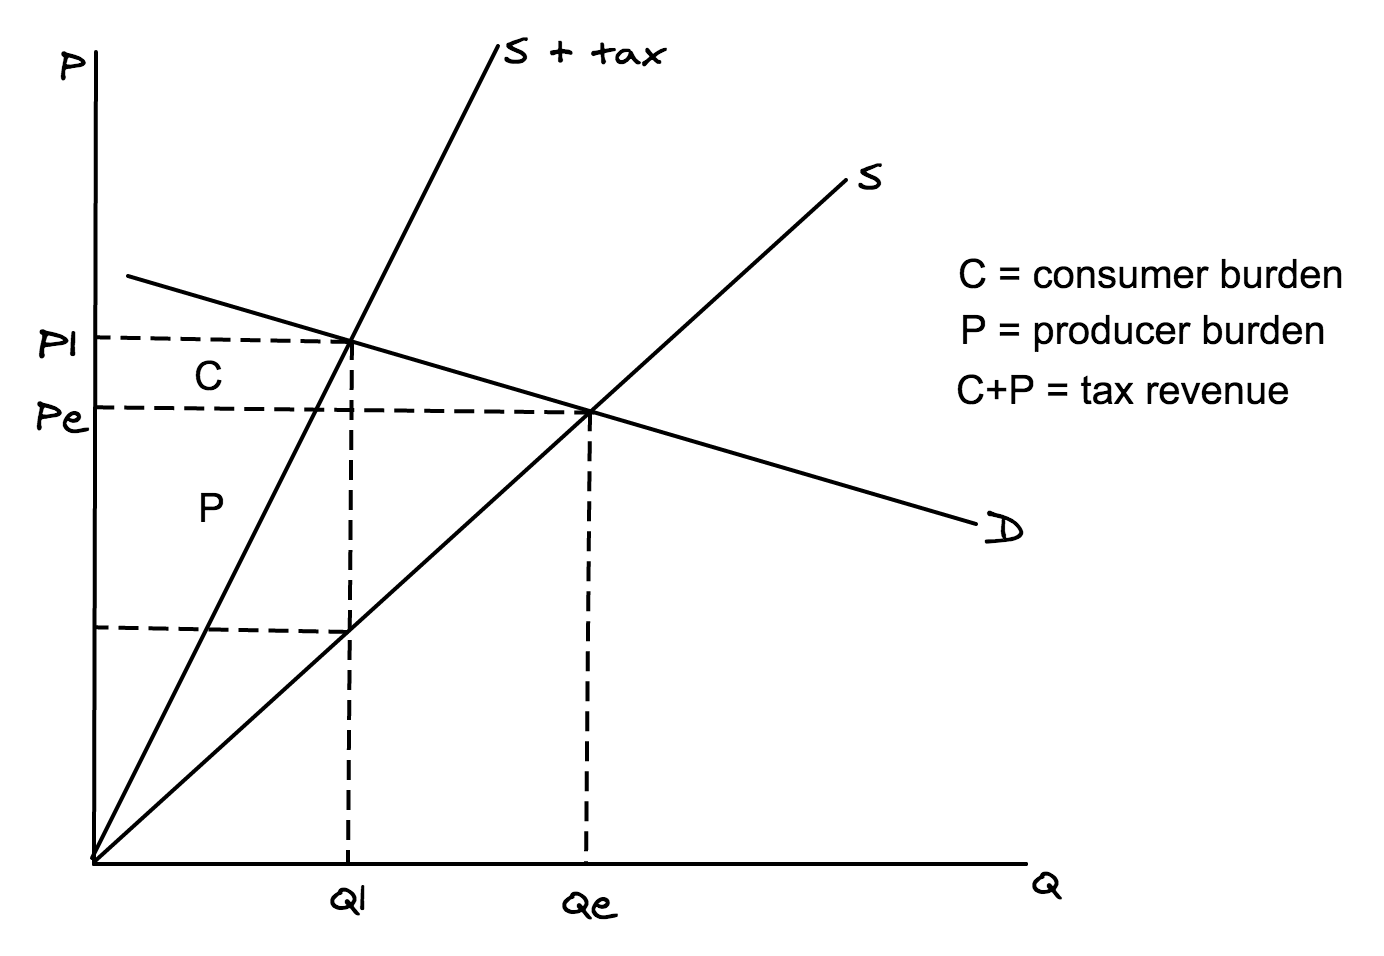
Illustrate the effects of an ad valorem tax on a diagram, when demand is more inelastic than supply.
To score full marks in your exam, make sure your diagram includes ALL of the following (you will lose marks if you miss any of these out):
\- Labelled axes (P and Q)
\- Labelled curves (S and D)
\- Demand must be steeper than supply, because demand is more inelastic
\- New supply curve (S + tax) rotated inwards
\- Equilibrium price (Pe)
\- Equilibrium quantity (Qe)
\- New equilibrium price (P1)
\- New equilibrium quantity (Q1)
\- Consumer burden labelled (C)
\- Producer burden labelled (P)
\- A key, to explain consumer burden, producer burden and tax revenue (as shown below)
\
Note: consumer burden is bigger than producer burden because demand is more inelastic than supply, so producers pass on most of the tax to consumers through higher prices.
5
New cards
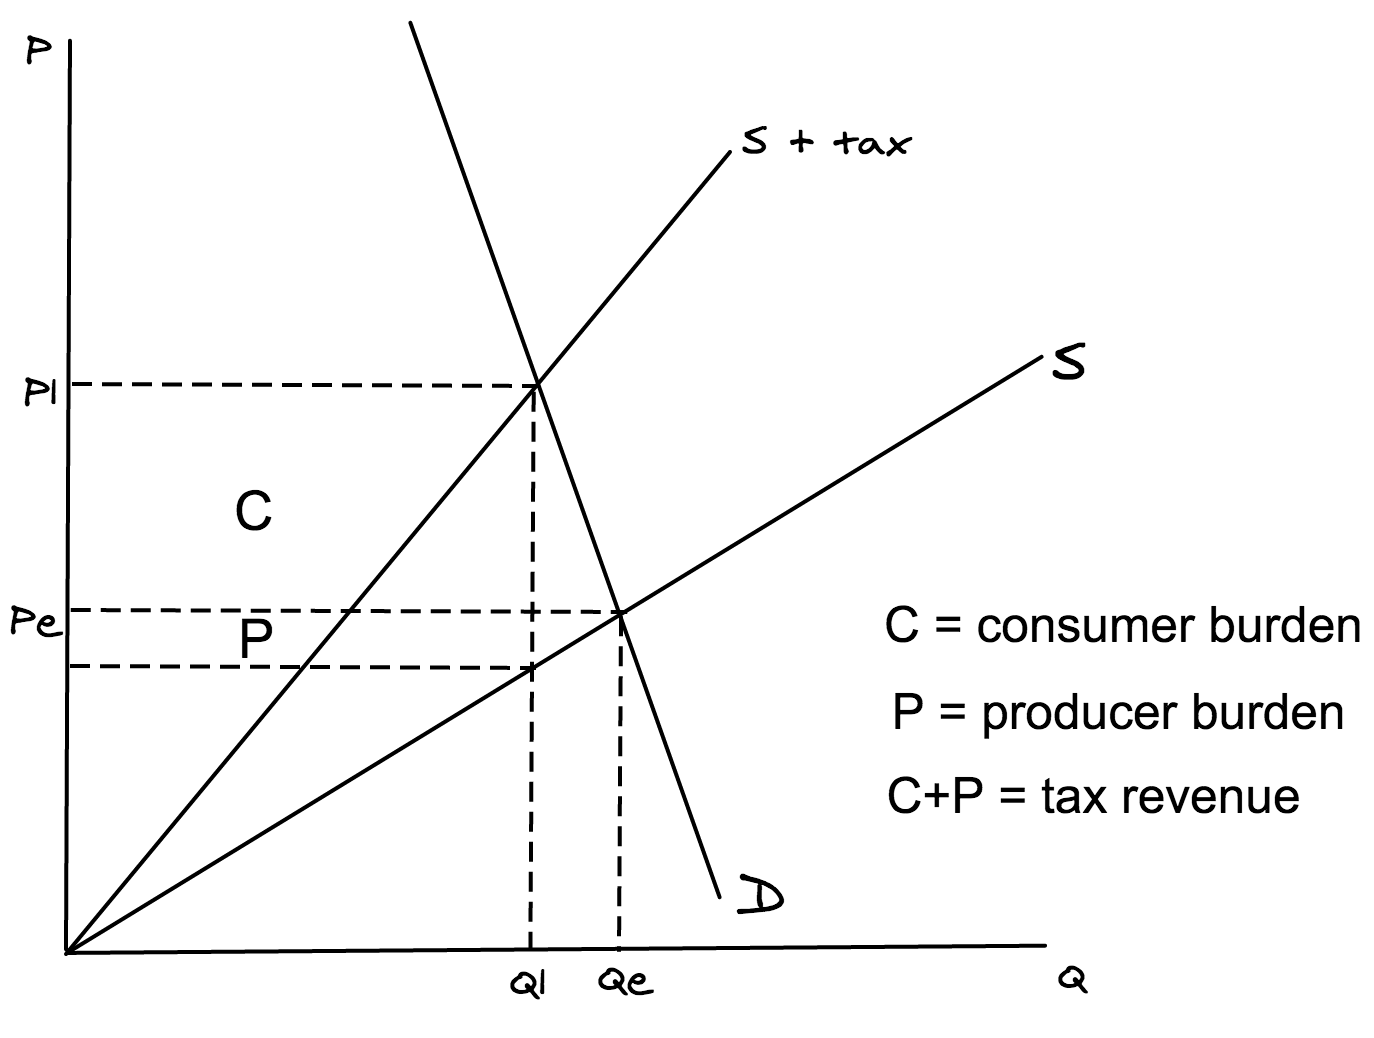
Illustrate the effects of an ad valorem tax on a diagram, when demand is more elastic than supply.
To score full marks in your exam, make sure your diagram includes ALL of the following (you will lose marks if you miss any of these out):
\- Labelled axes (P and Q)
\- Labelled curves (S and D)
\- Demand must be flatter than supply, because demand is more elastic
\- New supply curve (S + tax) rotated inwards
\- Equilibrium price (Pe)
\- Equilibrium quantity (Qe)
\- New equilibrium price (P1)
\- New equilibrium quantity (Q1)
\- Consumer burden labelled (C)
\- Producer burden labelled (P)
\- A key, to explain consumer burden, producer burden and tax revenue (as shown below)
\
Note: consumer burden is smaller than producer burden because demand is more elastic than supply, so producers can't pass on as much of the tax onto consumers as they'll lose too many sales.