knowt logo

1.7 Organizational planning tools

Introduction

  • Organizational planning: process of identifying an organization’s immediate and long-term objectives, and formulating and monitoring specific strategies to achieve them; it also involves employee and resource allocation to allow for the effective completion of projects.

  • Project: specific and temporary activity with a start and end date, clear goals, defined responsibilities and a budget.

  • Project management: using modern management techniques to plan, carry out and complete a project from start to finish in order to achieve preset targets of quality, time and cost.

  • Fishbone diagram: visual identification of many potential causes of a problem.
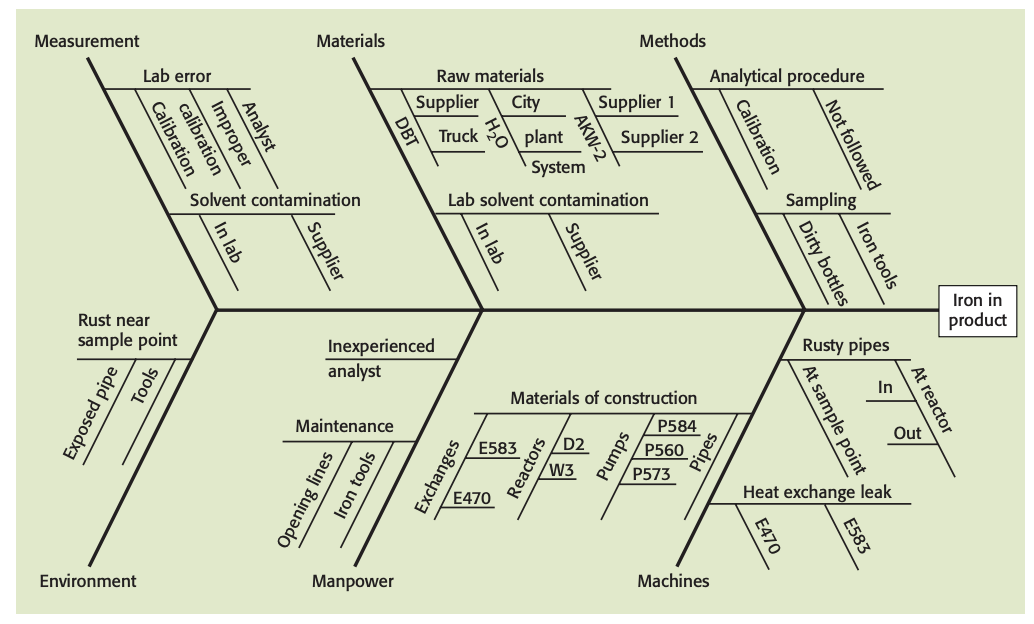
Example of a fishbone diagram

  • Decision tree: diagram that sets out the options connected a with a decision and the outcomes and economic returns that may result.
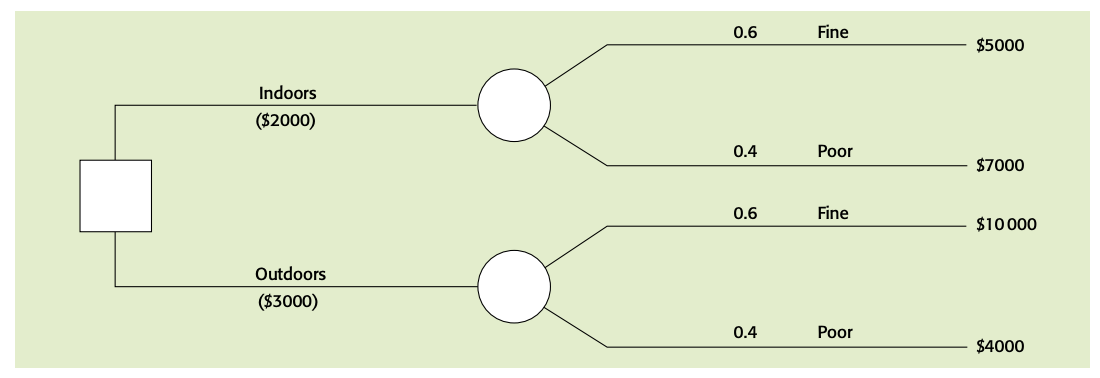
    Decision tree for the fundraising auction

    • Expected value: likely financial result of an outcome obtained by multiplying the probability of an event occurring by the forecast economic return if it does occur.
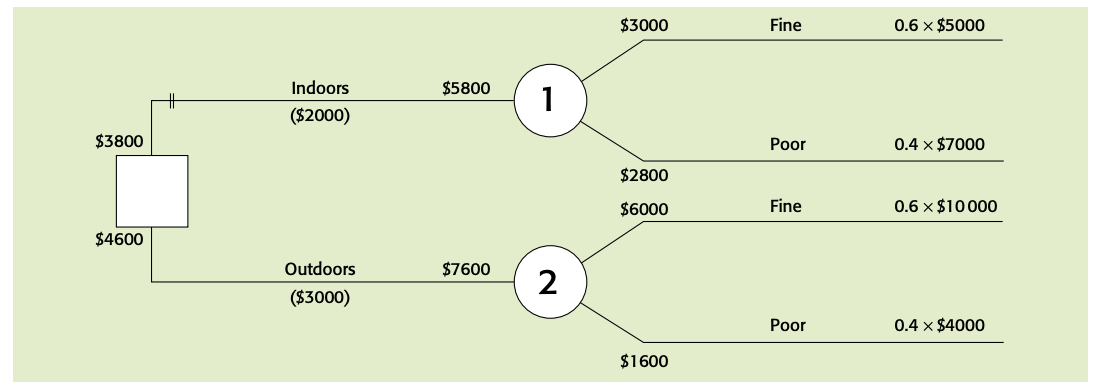
Calculating expected values - working from right to left

  • Force-field analysis: analytical process used to map the opposing forces within an environment (such as a business) where change is taking place.
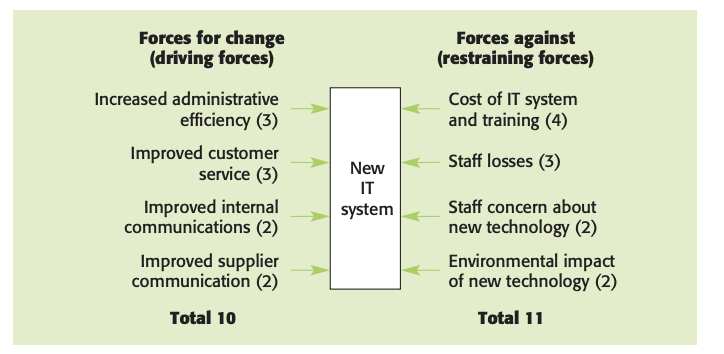
Force-field analysis of an IT-controlled machinery proposal

  • Gantt chart: visual representation of a project schedule in which a series of horizontal lines shows the amount of work planned in certain periods of time.

A simple Gantt chart

robot