Ch 2 - Modeling Distributions of Data
1/33
There's no tags or description
Looks like no tags are added yet.
Name | Mastery | Learn | Test | Matching | Spaced | Call with Kai |
|---|
No analytics yet
Send a link to your students to track their progress
34 Terms
percentile definition
the value with p percent of the observations less than or equal to it (“at” not “in)
percentile sentence template
___ is at the pth percentile
p% of data points (units) were less than/greater than or equal to____
(general = less than, specific = greater than)
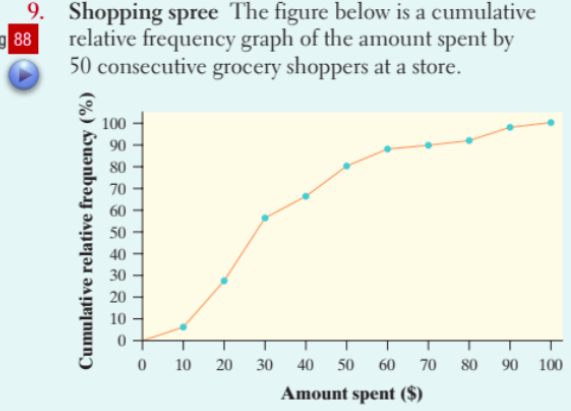
cumulative relative frequency
a graph showing the accumulation of frequencies up to each category in a dataset, allowing comparison of different percentiles.
z score
how many standard deviations from the mean & observation falls & whether it is above (pos.) or below (neg.) the mean
also known as the standardized score
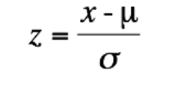
z score formula
data item - mean / standard deviation
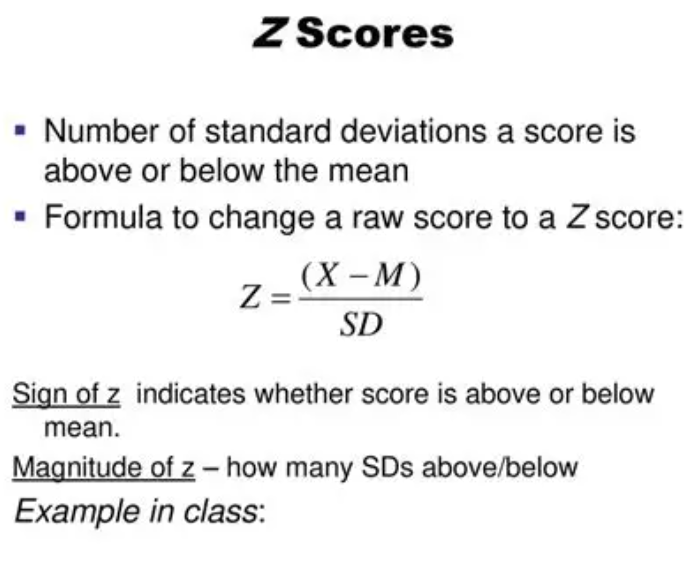
z score sentence template
The “data item” is “absolute value of z-score” standard deviations above/below the mean.
measures of center & location
max, min, mean, median, quartiles
measures of spread
standard deviation, range, IQR
measures of correlation
r, r²
transforming data with addition or subtraction (of constant a)
center & location (min, max, mean, median, quartiles) change by a
spread (standard deviation, range, IQR, r, r²) and shape stay the same
Z SCORE DOESNT CHANGE (bc total stand devs)
bc the pts are still the same relative to each other (horizontal/vertical shift)
transforming data w/ a multiplier (of constant b)
center & location (min, max, mean, median, quartiles) shrink/stretch by b
spread (standard deviation, range, IQR, shrink/stretch by b
correlation does not change (r, r²)
shape does not change
Z SCORE DOESNT CHANGE (bc total stand devs)
bc this is a stretch/shrink it zooms in/out the graph
μ
population mean :)
M
population mean (to do w/ normal curve)
x bar
sample mean
σ
standard deviation :)
a density curve
the smooth curve drawn thru the tops of HISTOGRAM bars (2 characteristics)
is always on or above the horizontal axis
has TOTAL area exactly 1 underneath it
(no set of real data can be exactly described by density curve, curve is an approximation)
does not matter on a continuous x axis if x=# bc if it equals its a vertical line ~ 0
median of a density curve
equal area point where half the area under the curve lies to the left and half to the right, representing the middle value of the distribution.
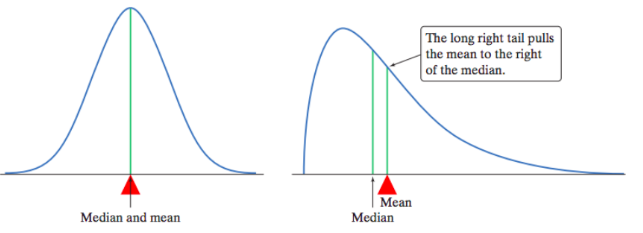
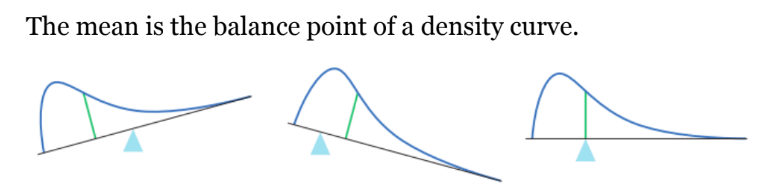
mean of a density curve
balance point of a density curve (the center of gravity of the distribution, not necessarily where the areas are equal.
Skew pulls the mean toward the longer tail.
proportion probability
4 things
[0,1] bc def of density curve
P(x>#) = x(height) = .decimal area
=%
UNITS
P(point = x)
is about 0 bc is a vertical line
Normal Distributions
“special” type of density curve
notation: Normal
same overall shape: symmetric, unimodal, and bell-shaped
(not all symmetric curves are normal, ie bimodal)
Describing normal distribution
Must identify 2 things:
mean μ→ the center (bc symmetric)
standard deviation σ → is the dis. from the center to the change-of curvature points on either side (points of inflection)
1 standard dev. above mean, 1 standard dev. below
larger stand dev = more spread
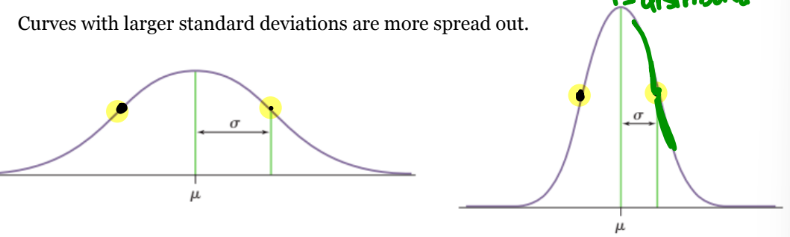
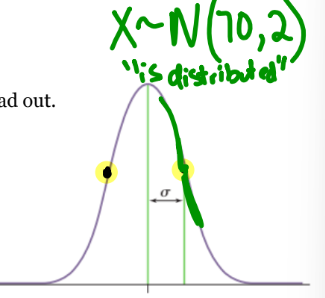
normal distribution notation
uses N(µ, σ), where µ is the mean and σ is the standard deviation
X ~ N (70,2)
“x is distributed” on normal curve mean of 70, standard deviation of 2
any Normal curve “standardized” =
N(0,1)
converting this to z score
mean: 0
standard deviation: 1
STANDARDIZING DOES NOT CHANGE the overall shape of the distribution.
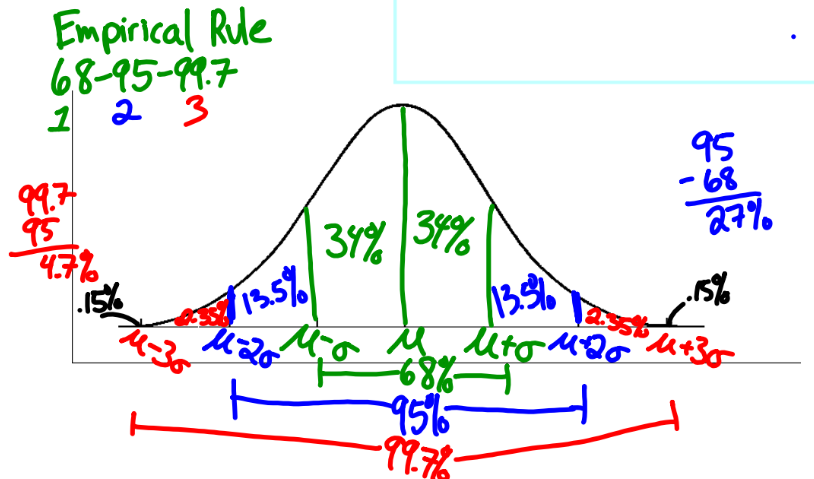
Empirical Rule
68-95-99.7 rule
appx. 68% of area falls within σ of the mean µ
if the curve is symmetric & normal
(1 stand below mean - 1 stand dev above mean)
appx. 95% of area falls within 2σ of the mean µ
(2 stand below mean - 2 stand dev above mean)
appx. 99.7% of the area falls within 3σ of the mean µ
(3 stand below mean - 3 stand dev above mean)
.15%, 2.35%, 13.5%, 34%, 34%, 13.5%, 2.35%, .15%
f(μ) of a normal curve
steps to proportion when z score is not integer
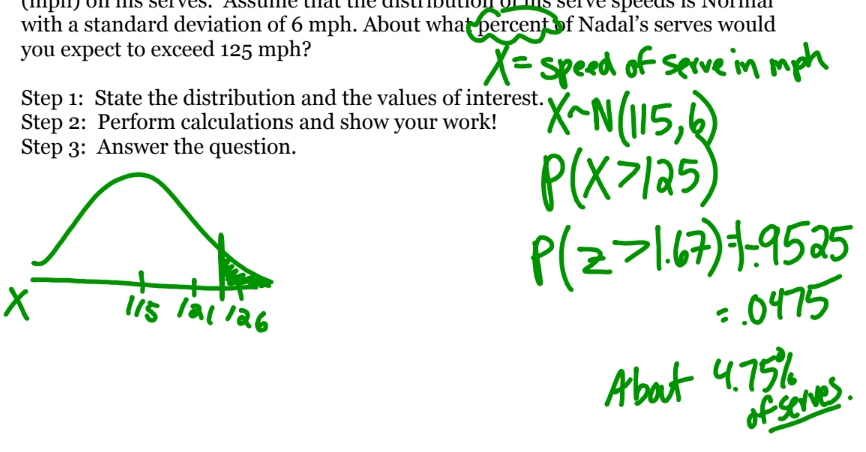
draw normal curve and shade area of interest
use proper notation to write proportion of interest p(z < #) = proportion of area to left of z score
(if u use a diff variable u must define it and x~N(115,6) before converting to z score
Is the data normal?
Make a Normal Probability Plot (which assumes data is normal)
enter data
→ stat plot
→ select graph
→ zoom 9
“The Normal Probability Plot is roughly linear so the data is approximately Normal”
if its asks abt a percentile, proportion or percent its asking for?
area!
if it asks abt a data item, mean, or standard deviation?
find z score! go backwards
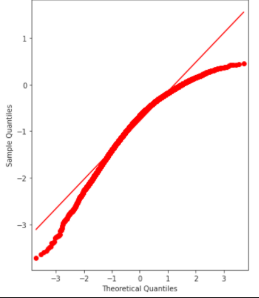
normal probability plot ∩
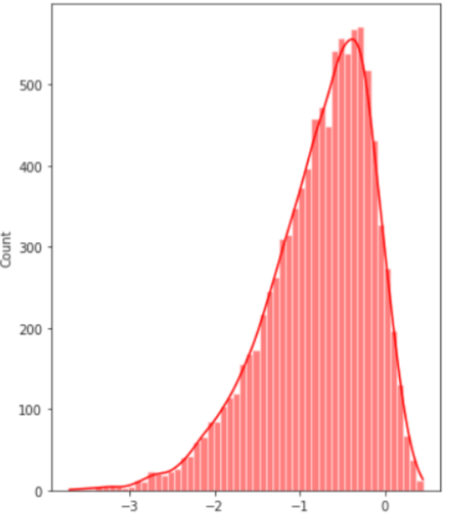
majority of data points falls on the right side (of the linear line), which indicates a tail on the left, so the data is skewed left
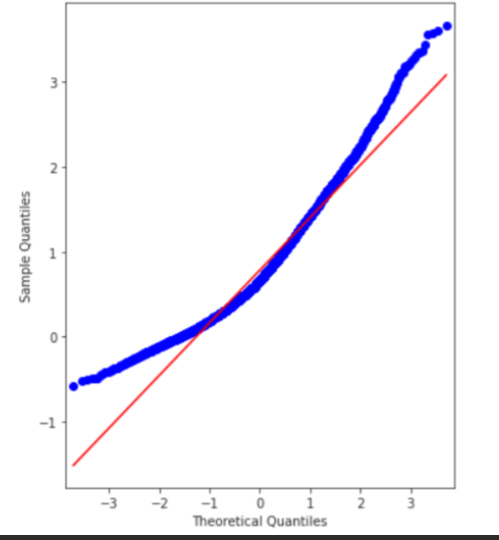
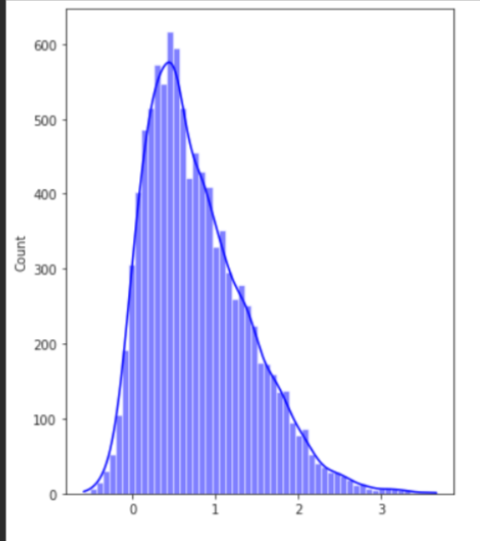
normal probability plot ∪
majority of data points falls on the left side (of the linear line), which indicates a tail on the right, so the data is skewed right
when changing the paramenters of a Normal curve?
restate the distribution
distribution on calc
2nd → distribution
2 or 3