Module 4: Multiple Regression
1/33
There's no tags or description
Looks like no tags are added yet.
Name | Mastery | Learn | Test | Matching | Spaced |
|---|
No study sessions yet.
34 Terms
Main advantage of using multiple regression over correlation
The ability to test the association of multiple predictors and a criterion variable.
What can multiple regressions test?
Whether the predictors are significantly associated with the criterion as a group
Whether individual predictors are associated with the criterion when we account for overlap between the predictor variables themselves
I.e. Isolating the variables
Bivariate regression analysis
Form of multiple regression where there is a single predictor
Multiple regression assumes your variables are measured on a _________ scale.
continuous
While you can use categorical predictor variables the criterion must be…
continuous
What should you do if you have a categorical variable in a multiple regression?
Code it to make it continuous
Think: Variable is attendance, we are interested in perfect vs non-perfect attendance, therefore we can dummy code it by giving non-perfect a value of 0 and perfect a value of 1.
Formula for multiple regressions
Y’ = b0 + b1X1 + b2X2 + b3X3…
Where each bX is a predictor variable
Unstandardised Coefficients for the intercept and slopes are based on…
The metric of the variable
The relevant unit of measurement for the variable
Think: CM, test score, attitude score, frequency of occurrence, etc
Limitation of using unstandardised coefficients in multiple regressions
You can’t tell which predictor variable is the ‘better’ one with the most predictive value
It’s like comparing apples and oranges, or a test scored out of 80 vs out of 200.
Think: If you score 100% on both tests, the score for the out of 80 will always be lower.
Why do we use standardised coefficients in multiple regressions?
It converts measures of all variables to a common unit to make comparisons.
In the case of the multiple regression analysis the test of significance refers to…
The association between each predictor and controlling for the other predictor variables.
What does the significance value in the ANOVA table tell us?
The significance of the total model
The significance of the combined effect of all predictors
Significance of R
What do the significance values in the coefficients table tell us?
The significance of each predictor, controlling for combined effects of other variables (isolating the predictor variable of interest)
The significance of the bivariate correlation
The significance of r
Where can the value of R be found and what does it mean?
It is the combined effect of all the predictor variables on the criterion.
Model summary table
Interpreted as a correlation
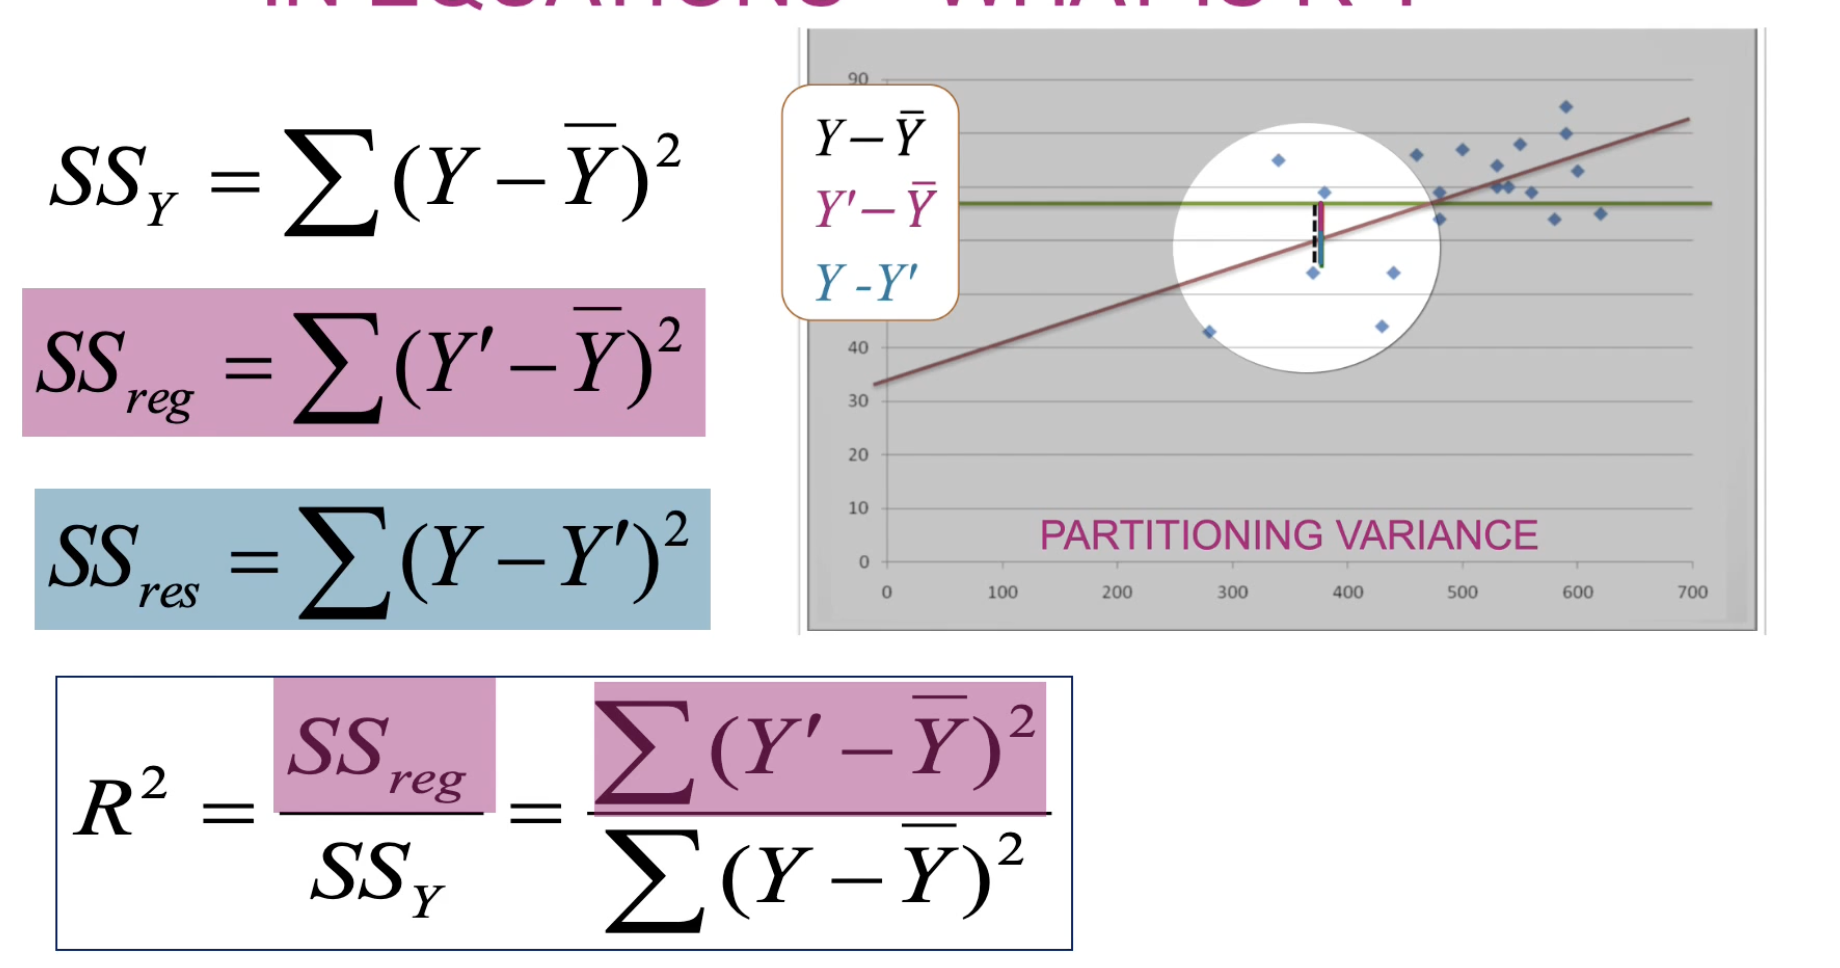
What does R Square in the model summary table tell us?
The amount of variance accounted for by the predictors (combined).
% variance in response variable (criterion) explained by variables a b and c.
Unique Variance
Variance that is unique to each predictor
Independent of any other predictor
Think: Isolating the variable
Explain multiple regressions in the analogy of a group assignment
Criterion: Grade for assignment
Predictor Variables: Effort of Individual Group Members
You would use R, R squared and the significance to see if the group as a whole was predictive of the grade received on the assignment.
You would use r, r squared and the significance to see how much each individual’s effort explained the grade.
Looking at R, you might see that the group effort as a whole explained 90% of the grade (we could say that 10% was explained by the fact that it was a difficult subject)
If you look at r, you might see that one person accounted for 80% of that model and the others slacked off.
Therefore you would interpret this as, the entire model (group) was significantly predictive of the grade, but person A accounted for most of this.
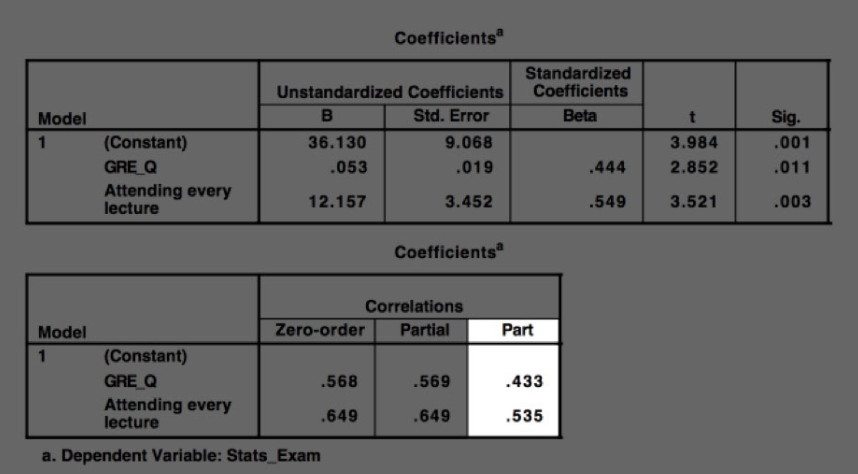
How do you get the unique variance of each predictor variable?
Square the ‘part correlation’ values in the SPSS output.
Can convert it into a % of variance explained

If the criterion is the orange circle, the unique variance of predictor 1 with the criterion is shaded…
Yellow/red

If the criterion is the orange circle, the unique variance of predictor 2 with the criterion is shaded…
Yellow/red

If the criterion is the orange circle, the shared variance of predictors 1 and 2 with the criterion is shaded…
Orange
Multicollinearity
When predictor variables have very high correlations with each other
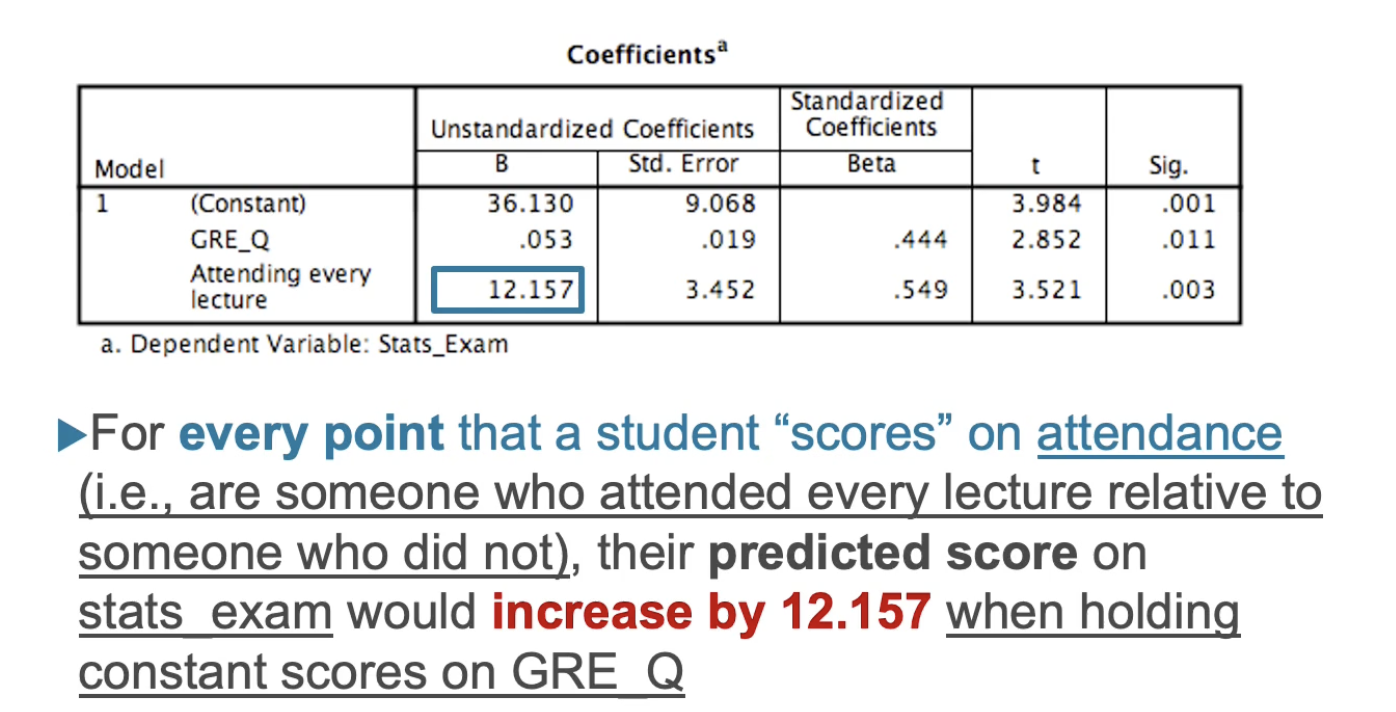
In a multiple regression, b-weights are referred to as…
Partial slopes
Each b-weight tells us how much change in Y’ for each unit change in that variable when all other variables are held constant.
Think: In the equation there are multiple slopes (b1’s) because there is one for each predictor variable
Think: In the equation/formula itself, b1X1 forms the slope, and b1 (the b-weight) forms part of the slope
Linear Composite
The regression equation (model)
H0
The null hypothesis
There is no linear relationship between X and Y in the population
H1
Alternative hypothesis
There is a linear relationship between X and Y in the population
R square formula
Gives variance explained by the model
Semipartial Correlations
Measures the unique relationship between one independent variable and the dependent variable, while controlling for the influence of other independent variables.
Square to get proportion % of accounted variance by that variable
Under ‘part’ column in SPSS
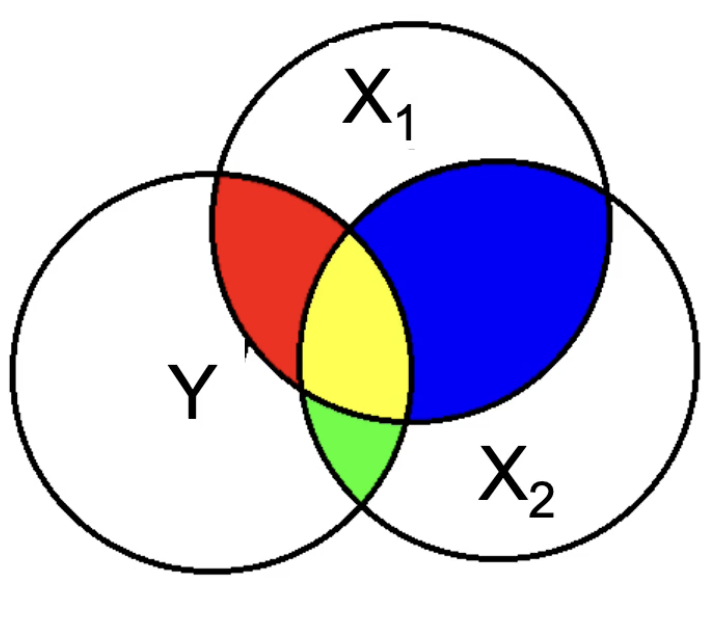
What does the blue represent?
Unique variance that is not accounted for by the model at all.
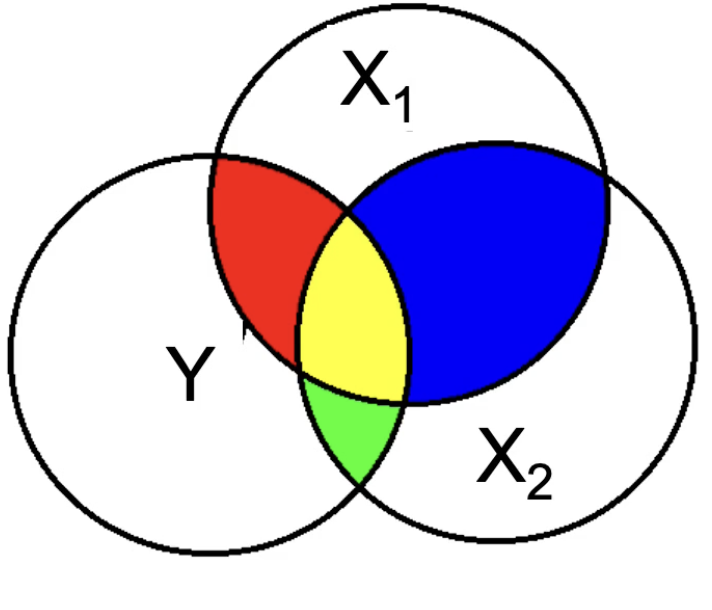
Which colours represent unique variance?
Red and green

What does yellow represent?
The shared effect
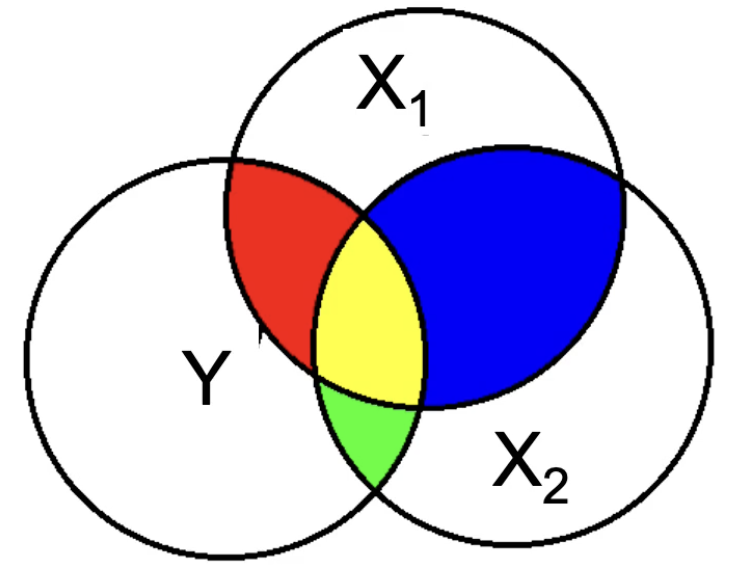
What do the red, green and yellow sections combine represent?
R squared
Any correlation value squared gives you…
Proportion of variance explained
Shared variance refers to
Combined effects of predictor variance on criterion