1 - regression, correlation + hypothesis testing
1/7
There's no tags or description
Looks like no tags are added yet.
Name | Mastery | Learn | Test | Matching | Spaced | Call with Kai |
|---|
No analytics yet
Send a link to your students to track their progress
8 Terms
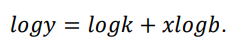
when you have an exponential graph/equation, what can u do to make it simpler
take logs and make it linear

write as a linear
.
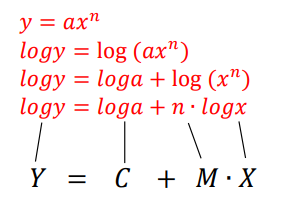

make it linear
.
how do you know whether its better to use an exponential model or linear model for the data
whichever one the regression line is more perfect for when u enter the data into ur cg50
how does hypothesis testing come into this topic
you test if the r (PMCC) of a sample indicates a linear relationship of a whole population (p)
hypotheses for both 1 and 2 tailed tests for zero correlation
1-TAILED
positive:
H0: p=0
H1: p>0
negative:
H0: p=0
H1: p<0
2-TAILED
any correlation:
H0: p=0
H1: p≠0
u basically always assume no correlation until u prove there is one
how to find the critical value of the test
use critical value table on p37 of formula booklet
match sample size to percentage level given in question to find critical value
TWO TAILED = halve percentage level BEFORE looking at table
how to know whether to reject or accept H0
given r > critical value —> sufficient evidence to reject H0 and conclude that p>0 (positive relationship in the population)
given r < - critical value —> sufficient evidence to reject H0 and conclude that p<0 (negative relationship in the population)
but if critical value > r > - critical value then there is insufficient evidence