310 FINAL
1/64
There's no tags or description
Looks like no tags are added yet.
Name | Mastery | Learn | Test | Matching | Spaced | Call with Kai |
|---|
No analytics yet
Send a link to your students to track their progress
65 Terms
What makes a true between-groups study experimental?
Random assignment to conditions
What makes a within-groups study experimental?
Counterbalancing
Factors making quasi-experiments NON-EXPERIMENTAL:
Missing control group OR participants not randomly assigned
How do quasi-experiments eliminate the directionality problem? HOWEVER…?
IV manipulated BEFORE the DV is measured
Does NOT eliminate confounding variables
Types of one group quasi-experimental designs?
One-Group Pretest-Posttest
One-Group Post-Test Only
Non-Equivalent Groups
Time Series
Type of one group Quasi-experimental design: IV (anti-drug education program) is implemented and then a DV (elementary school students’ attitudes toward illegal drugs) is measured once after the treatment is implemented
One-group Post-test Only Design
Why is One-Group Post-test Only Design the weakest quasi exp??
No control or comparison group (No way to determine attitudes of
students if they hadn’t completed the anti-drug program)
Type of one group Quasi-experimental design: DV measured once before the treatment (IV) is implemented and once after it is implemented.
Like within-subjects BUT order of conditions is not counterbalanced
One-Group Pretest-Post-test Design
Quasi experimental One-Group Pretest-Post-test Design ALTERNATIVE EXPLANATIONS
Instrumentation: basic characteristics of the instrument change over time.
Regression to the mean; high scores pretest tend to get lower Post-test (vice versa)
Spontaneous remission; tendency for psychological problems to improve over time without treatment
Type of Quasi-experimental design: a set of measurements taken at intervals over a period of time, which are “interrupted” by a treatment (Pretest x3, Intervention, Post-test x3)
One group: Interrupted Time Series Design
Type of design: a between-subjects design in which participants have not been randomly assigned to conditions. What are the types?
NON-EQUIVALENT GROUPS DESIGNS
Post-test Only
Pretest-Post-test
Interrupted time-series
Switching Replication
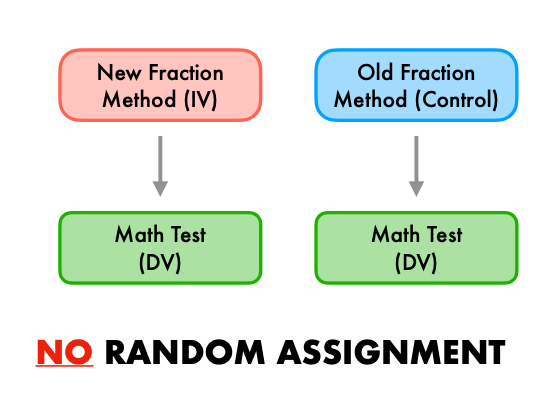
Type of quasi non-equivalent groups design: Participants in one group are exposed to a treatment, a nonequivalent group is not exposed to the treatment, both groups are compared.
Post-test Only Nonequivalent Groups Design


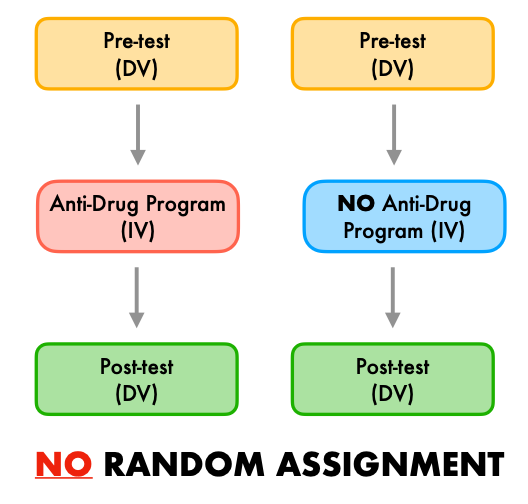
Type of quasi non-equivalent groups design: Treatment group is given a pretest, receives a treatment, then given a post-test, non-equivalent control group is given a pretest, does not receive the treatment, is given a post-test.
Pretest-Post-test Nonequivalent Groups Design
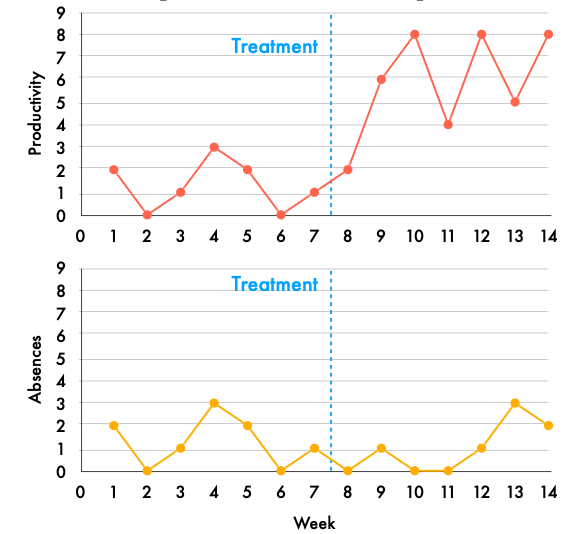
Type of quasi non-equivalent groups design: Measurements at intervals over time both before and after an intervention in two or more non-equivalent groups. (E.g., finding a manufacturing company who does not plan to change their shift length (nonequivalent control group))
Interrupted Time-Series Design with Nonequivalent Groups

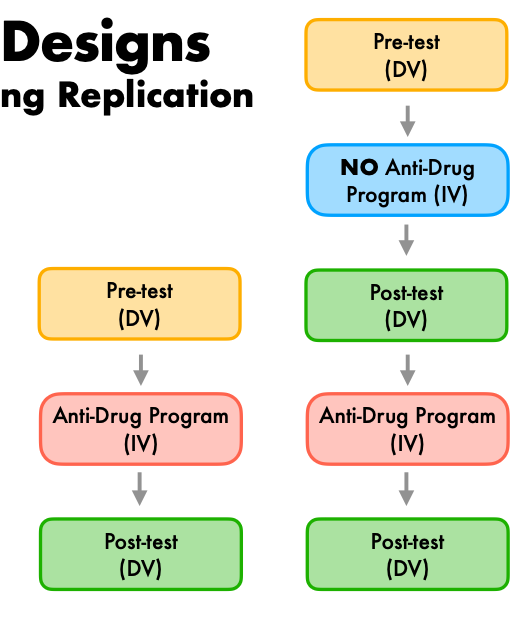
Type of quasi non-equivalent groups design: Two groups get a pretest (measuring DV), then one gets the IV followed by a post-test, while the other group gets no IV first, post-test, then IV, then another post-test. (If Group 1 improved more than Group 2, that suggests the program worked. But you can't be fully sure because the groups weren't randomly assigned, maybe Group 1 was just more motivated. If the program genuinely works, you should now see Group 2 improve the same way Group 1 did in Phase 1- REPLICATION)
Pretest- Post-test Design With Switching Replication

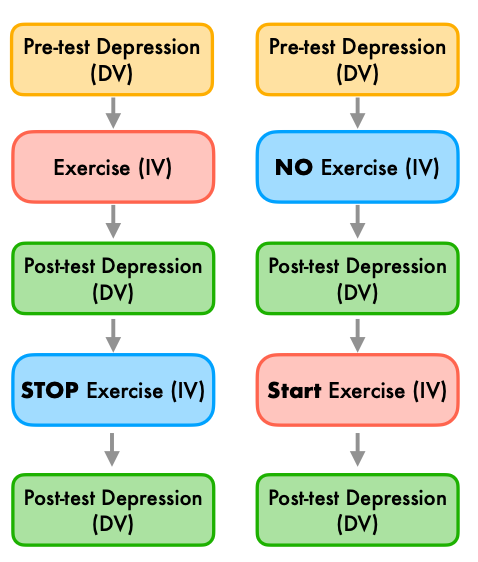
Type of quasi non-equivalent groups design: The treatment is removed from one group when it is added to the second group, We observe the effect of the removal of treatment from one group, we observe replication when it is added to the second group) *You're turning the treatment on and off like a light switch — if depression reliably goes down when exercise is added and back up when it's removed, that's strong evidence exercise is actually causing the change*
Switching Replication with Treatment Removal Design

What’s one solid advantage of Quasi-Experimental Designs over Experimental designs?
You can study real-world situations that you couldn't ethically or practically manipulate in a lab.
How do you design an experiment with more than 1 IV?
Factorial Experiment
Determining if the effect of one IV depends on the level of another - aka?
An interaction between IVs

Most common approach to including multiple IVs (Factors) is the _______
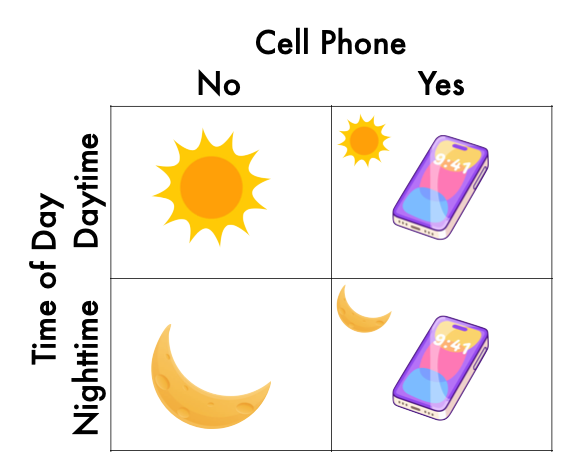
Factorial design: (E.g., effect of cell phone use (yes vs. no) and time of day (day vs. night) on driving ability)
Each level of one IV is combined with each level of the others; producing all possible combinations, each combination is a condition in the experiment)
IMAGE = 2 × 2 factorial design
Factorial experiment: If one IV has 3 levels (handheld, hands-free, not using cellphone), thus it is a….
3 × 2 factorial design with 6 distinct conditions
E.g., 4 x 5 = 20 conditions (2 factors)
2 x 2 x 2 = 8 conditions (3 factors)
Explain participant assignment to conditions for Between-subjects factorial designs and Within-subjects factorial designs, respectively
Between-subjects = Each participant tested in only one condition
Within-subjects = Each participant tested in all four conditions
Type of factorial design: Every participant is tested both with and without a phone (within-subjects), but each participant is only tested at one time of day — either daytime or nighttime, not both (between-subjects).
Mixed factorial design
An IV that is a pre-existing participant trait (e.g., hypochondria) that you measure and sort people by, rather than assign. You can't draw causal conclusions about it.
Non-manipulated IV in factorial designs
A factorial design where neither IV is manipulated — both are just measured traits. No causal conclusions can be drawn about anything. It becomes experimental the moment at least one IV is manipulated
Non-Experimental Factorial Design
In factorial designs, there are three kinds of results:
Main effects,
Interaction effects
Simple effects
Type of factorial exp effect: Effect of IV on DV, averaging across the levels of the other independent variable (Such effects are independent of each other)
Main effects
Type of factorial experiment effect: Interactions
When the effect of IV on a DV differs depending on the level of another IV
Types of factorial experiment interactions?
Spreading Interactions
Cross-over interaction
Which factorial experiment interaction effect type? When one IV has an effect at one level of another IV, but the effect is weaker or absent at the other level.
Spreading interaction
Which factorial experiment interaction effect type? When one IV has an effect at one level of another IV, but the effect completely reverses direction at the other level.
Crossover Interaction
In a 2x2 design you get main effects (__ per IV) and ___ simple effects (___ for each cell combination).
2 main effects (1 per IV) // 4 simple effects (1 for each cell combination)
Key rules for interpreting results of a factorial experiment:
No interaction = main effects only
If interaction exists, you run simple effects to break it down
E.g.,
2×2 = 4 conditions, 2 main effects, 4 simple effects
2x3 = 4 conditions, 2 main effects, 5 simple effects
3x3 = 9 conditions, 2 main effects 6 simple effects
Q: How do you know if there's an interaction in the study strategy x environment experiment?
A: Look at the gap between rote and elaborative in each environment. In the no-interaction example, elaborative always beats rote by 5 points whether the room is quiet or noisy — the gap is identical, so the two IVs are working independently.
If that gap changed — say elaborative beats rote by 5 in quiet but only by 2 in noisy — that's a spreading interaction: the study strategy effect is weakened by noise.
If the gap flipped — elaborative beats rote in quiet but rote beats elaborative in noisy — that's a crossover interaction: noise completely reverses which strategy works best.
What is a simple effect?
The effect of one IV at a single level of the other IV. You only run them when there's a significant interaction.
In a 2x3 design, how many simple effects are there?
5— you add the levels of each IV together (2+3=5).
How do you distinguish a spreading from a crossover interaction?
Spreading = the gap between conditions shrinks but never reverses (The advantage of elaborative over rote goes 6→4→1 as noise increases. Elaborative always wins, the gap just shrinks)
Crossover = the gap flips direction entirely at some level (Elaborative beats rote in quiet (18 vs 12), but rote beats elaborative in loud (12 vs 9). The winner flips depending on the environment.)
Type of research design: Quantitative research studying of the behaviour of each of a small number of participant
(Typically n=2 to 10) - Small n design
NOT single participant study
Single-Subject Research
Historically, who used Single-Subject Research?
Wundt - Sensation and consciousness with small n
Pavlov - Classical/Operant conditioning
Skinner - How rewards, punishments, external factors affect behaviour
Single-Subjects Design features
1 participant measured repeatedly over time across distinct phases
Steady state strategy: One condition per phase; don’t move on until behaviour stabilizes (reducing “noise”)
Reversal design: condition sequence goes A→B→A, returning to baseline to confirm the treatment was actually causing the damage.
How does ABA design go?
Baseline
Intervention
Return to Baseline (intervention is withdrawn to observe if the behaviour reverts to the original baseline levels, confirming the intervention caused the change)
No such thing as “scientific proof”, there is only…
Scientific evidence
In a frequency table describing single variables, the first column lists the ______ of there variable, whereas the second column lists the ______ of each score.
Values (possible scores on the scale)
Frequency
When there are many different scores across a wide range of values, it is often better to create a…
Grouped frequency table
One way to display the distribution of a variable is in a…
Frequency table
A graphical display of a distribution; presents the same information as a frequency table. Where the x-axis represents _____ and the y-axis represents ______.
Histogram; The Variable; Frequency
Most common measure of central tendency
Mean
Mean is not a good indicator of the central tendency if…
The distribution is skewed
In a skewed distribution, the _______ is the preferred measure of central tendency
Median
The _____ is the only measure of central tendency that can be used for categorical variables., e.g., favourite type of Ice Cream
Mode
Extent to which the scores vary around their central tendency
Variability
What are the measures of variability?
Range
SD
Percentage of scores in the distribution that are lower than that score
Percentile rank
The difference between an individual’s score and the mean of the distribution, divided by the standard deviation
Z-score (indicates how far above or below the mean a raw score is, but it expresses this in terms of the standard deviation)
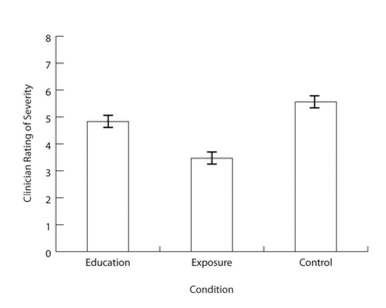
What are the smaller vertical bars that extend both upward and downward from the top of each main bar?
Error bars - they represent the variability in each group or condition and can be Standard Deviation, Standard Error, 95% CI
What are the ways to express statistical results?
Bar graph
Line graph
Scatterplot
Which type of graph is used when the IV is quantitative and qualitative, respectively?
Quantitative IV = Line graph
Qualitative IV = Bar graph
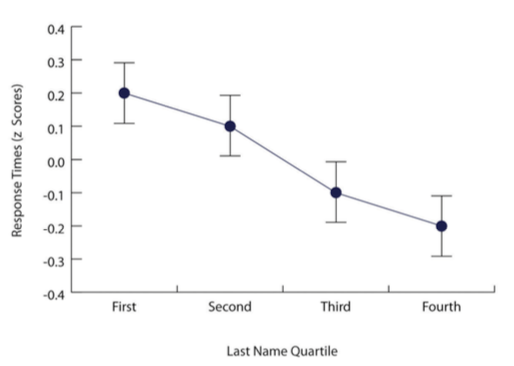
On a line graph, what does each point represent?
Each point represents the mean score on the dependent variable for participants at one level of the independent variable
When we want to know whether our sample meaningfully different from what we expect in the population, how do we answer it and what do we need?
Z-test (need: Population mean and SD)
When we want to know whether our sample meaningfully different from what we expect in the population, how do we answer it? We have the population mean BUT no population SD
Single sample T-test
What if we wanted to know whether two different samples were meaningfully different from each other?
We don’t know the population mean or standard deviation AND both samples are independent
How do we determine this?
Independent samples t-test
What if we wanted to know whether the scores different for the same people measured twice? (E.g.,before and after intervention)
Both groups are dependent AND we don’t know the population mean or SD
How do we determine this?
Dependent Sample t-test
How do we determine whether the means different across three or more groups?
ANOVA (Analysis of Variance)
Term for when we want to know how strongly two variables are related, and in what direction.
(e.g., Is there an an association (r) between how many hours you spend studying and the results you get on an exam?)
Correlation
Term for when we want to know whether one variable can predict another variable.
(e.g., Can we predict the score you will get on future exams (y) based on how much time (x) you spent studying (y = a +b*x) )
Linear regression