Epi test 3
1/71
There's no tags or description
Looks like no tags are added yet.
Name | Mastery | Learn | Test | Matching | Spaced |
|---|
No study sessions yet.
72 Terms
Necessary Cause
required for the disease to occur. More applicable to infectious disease and is caused by a single pathogen.
Sufficient Casual set
set of factors working together, requires joint action of component causes, each component plays a necessary role. More applicable to non-communicable diseases with multiple causes.
Ronald Ross
A British physician known for his work in identifying the malaria parasite's transmission through mosquitoes, significantly advancing the understanding of infectious diseases.
Tuberculosis
Top infectious killer in the world
1.5 million died in 2018
HIV and TB high correlation
Criteria for causation and which are different from Bradford Hill
Temporal relation- Does the cause precede the effect
Plausibility is the association consistent with other knowledge
Consistency- Have similar results to other studies
Strength- Is there a strong association between the cause and effect?
Dose- response relationship- Is increased exposure possible cause leas to the reduction of disease risk
Different
Reversibility- Does the removal of a possible cause lead to reduction of disease risk
Study design- Is the evidence based on a strong study design
Judging the Evidence- How many lines of evidence lead to the conclusion
Ability to prove causation
RCT
Cohort studies
case-control
cross section
Ecological
Bias?
Evidence quality?
strong
moderate
moderate
weak
weak
Risk of bias lowest in RCT and increases down the list highest in Cross sectional (ecological not on pyramid)
Evidence quality lowest in RCT and increases down the list highest in Cross sectional (ecological not on pyramid)
Systematic review
uses standardized methods to select and review studies on a particular topic
Meta-Analysis
Pools and re-analyzes data from other studies often used in tandem with systematic review
Upstream
root causes
ex. access to healthy foods, access to quality health care, reliable transportation, stable housing, and economic stability
Downstream
Effects
Ex. chronic disease, infection, mortality
Distal causes
factors that are further removed from the immediate health outcomes, often encompassing broader social and environmental determinants.
proximal cause
factors that are closely related to health outcomes, such as individual behaviors or specific medical conditions.
causal interference
The process of determining whether an observed association is likely to be causal.
Hierarchy of causes
some causal factors lead to exposure that are the direct cause of the disease

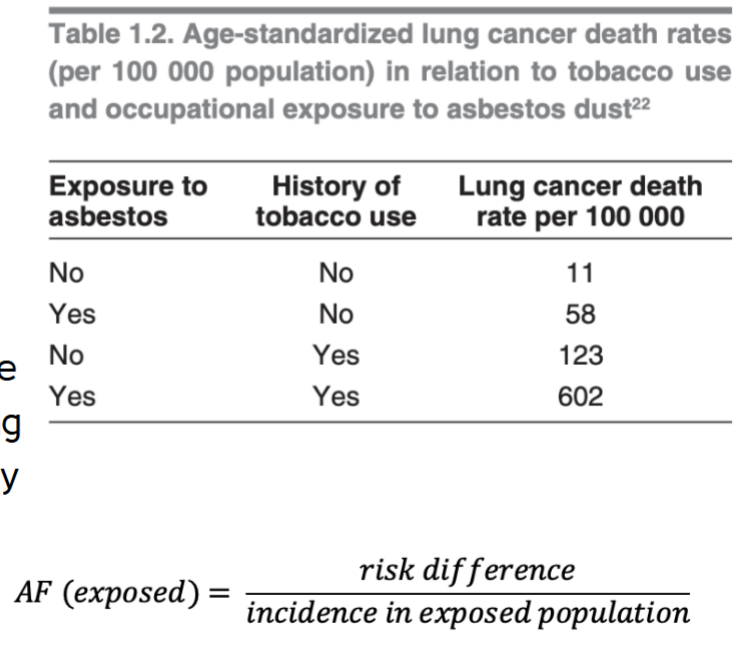
calculate the attributable fractions of smoking and asbestos exposure for lung cancer
AF of smoking among asbestos workers: (602-58)-602=0.904
AF of smoking among non-abestos workers: (123-11)/123=0.910
AF of eliminating asbestos exposure among smokers:(602-123)/602=.0796
AF of eliminating asbestos exposure among non-smokers:(58-11)/56=0.810
Why can attributable fractions add up to more than 100%
The fractions can add up to more than 100% because they are each dependent on the other.
Which criteria of causation would you want to establish first
Temporal relationship
Why is time-series analysis of short term association considered an acceptable method to assess causality
a short time frame reduces chance of other confounding variables
What is meta-analysis and which conditions have to be met
Meta- analysis combines data from more than one study in order to achieve more stable and precise conclusions concerning causal assocations. To use this method each study needs to have used the same exposure and health outcomes varaibles and the basic population characteriscs (age, sex, etc. )
Sample
subset of the population
We dont really care about the sample but about describing the whole population.
Biostats gives us tools to determine how well the sample describes the whole population
Binary Variable
Two categories eg yes or no
Nominal variables
Multiple categories which are not numbered or ordered eg hair color
Ordinal variables
multiple categories which are ordered e.g. level of education
Continuous variables
Numeric values with theoretically infinite numbers of value e.g. height and weight
Discrete
Numeric values with finite numbers e.g. number of siblings
categorical variables
Binary, nominal, ordinal
Quantitative variables
continuous and discrete
Mean
average value
Standard deviation
What percent falls in one and two SD from the mean
How is SD related to variance
numerical value which tells us how spread out the normal distribution is from the sample population
One SD is 68%
Two SD is 95%
SD= Square root of the variance
Variance
is the distance between points and the mean
95% CI
What would happen to the CI if the sample size is reduced
Typically includes the mean
95% of the true population mean is in the range x-y
CI would be larger
Standard Error
how spread out the sample means would be, if we were drawing multiple random samples from the same population and measuring the distribution of those sample means
Ho
Null hypothesis there is no difference between two things
H1
Alternative statement that there is a difference
When do we reject the Ho
observed outcome is rare or unlikely p<0.05
Null Hypothesis rejected when it is false
correct
true positive
probability =1-B
AKA Power
Null hypothesis is rejected when it is true
Type 1 error
false positive
Probability = a
Null hypothesis is not rejected when it is true
correct decision
true negative
probability 1-a
Null hypothesis not rejected when it is false
Type II error
False negative
Probability =B
Binary outcomes
Two possible results
chi-squared or logistic regression
for all statical methods p-value or CI can be used to accept or reject null hypothesis
Continuous outcomes
wide range of numerical data like temperature
t-test or linear regression
for all statical methods p-value or CI can be used to accept or reject null hypothesis
Time to event
Time elapsed before an event occurs
survival analysis (Kaplan-Meier Curves)
for all statical methods p-value or CI can be used to accept or reject null hypothesis
P value= 0.59 do we accept or reject Ho
Accept null hypothesis Treatment did not have significant effect
P value = 0.01 do we accept or reject Ho
Reject Null hypothesis treatment did have a significant effect.
If CI overlap do we accept or reject Ho
Accept the null hypothesis no significant effect
Causation in chronic disease
Chronic disease is increasing in high, middle and low income countries
major cause of morbidity in most of the world
No single cause
4 levels of prevention
Primordial, primary, secondary, and tertiary
Primordial prevention
addressing social determinants of health
Targeted towards the entire population
ex. income, access to care
Primary prevention
Addressing specific causal factors, education, laws, vaccines, sanitation
Suseptible population aims to stop the disease form ever occuring
Secondary prevention
Treating disease in its early stages to shorten duration
Healthy appearing individuals
early detection and treatment
screening to find early stages of disease
Tertiary prevention
Late stages to reduce complications
Targets symptomatic patients
screening in public health
process of using test on a large scale to identify the presence of disease in apparently healthy people
Sometimes establishes diagnosis, more often identifies risk factor like high BP
Disorder must be well defined, known, long period between first signs and development, test simple safe and cheap, treatment should be accessible and affordable.

How does sensitivity and specificity relate to these variables
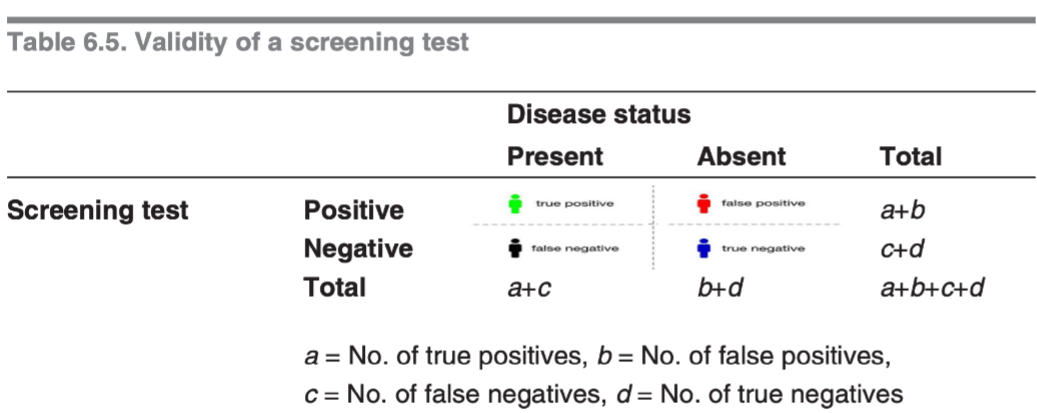
Sensitivity= probability of a positive test in people with the diseae a/a+c
Specificity= probability of a negative test in people without the disease d/(d+b)
Sensitivity
Proportion of people with disease who have a positive test result
high sensitivity reduces false negatives
Specificity
proportion of people without disease who have a negative test result
Positive predictive value
probability of the person having the disease when the test is a positive a/a+b
Negative Predictive value
Probability of the person not having the disease when the test is negative d/d+c
Odds ratio
a statistical measure that compares the likelihood of an event occurring in a group exposed to something versus a group that was not exposed.
(a/b)/(c/d)
population had ___ times the odds of having outcome if exposure than compared to group without exposure
Risk ratio
the ratio of the probability of an outcome in an exposed group to the probability of an outcome in an unexposed group.
RR=[a/(a+b)]/[c/(c+d)]
population had ___ times the risk of having outcome if exposure than compared to group without exposure
Epidemic
refers to an increase, often sudden, in the number of cases of a disease above what is normally expected in that population in that area
Pandemic
refers to an epidemic that has spread over several countries or continents, usually affecting a larger number of people
Endemic
refers to a relatively stable pattern of occurrence in a given geographical area or population group at relatively high prevalence and incidence.
Communicable disease
caused by transmission of specific pathogenic agent to a susceptible host, either directly from infected humans or animals or indirectly through vectors, airborne particles or vehicles.
vector
living organism carrying infectious agent on/in its body
vehicle
non-living substance e.g. soil, water, air carries infectious agent to a new host
Infectious disease
same as communicable disease
contagious disease
spread directly between humans without intervening vector or vehicle
R-naught
Number of people that one sick person will infect on average
What three things affect the transmission process
Environment, host, and agent
Linear regression
dependent variable is continuous
logistic regression
dependent variable is binary
survival analysis
dependent variable is a time interval until a prespecified event